HitoeSleep
Wireless Solution for Childrens' Sleep Studies - Powered by Hitoe
Sleep studies using polysomnography tend to be uncomfortable for patients especially in the case of children. Our team is providing a Proof-Of-Concept implementation of NTTData’s ‘hitoe’ smart t-shirt system for use as a wireless sensor suite in sleep studies at Great Ormond Street Hospital’s (GOSH) Respiratory Sleep Clinic. We will be modifying the existing ‘hitoe’ Android app to store data in the cloud. A physician can then view this data in real time through a web portal. Our project will pave the way for future development of the ‘hitoe’ as a viable replacement for polysomnography in sleep studies, providing a more comfortable and potentially more reliable source of sleep data for physicians.
Key Features
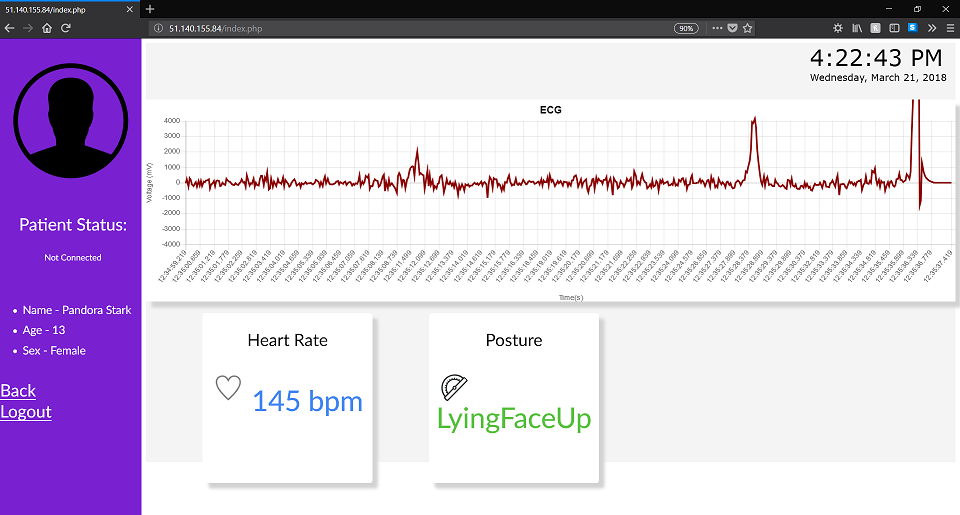
Real-Time Data StorageAll data received from the Hitoe is automatically stored in the cloud, physicians no longer need to fear data loss due to machine failure
Real-Time Data DisplayData from the Hitoe can be viewed in real time from our web portal from anywhere in the world. This opens up the possibilities for remote monitoring of home sleep studies.
100% WirelessPatients only need to put on the hitoe t-shirt; no wires need to be connected at all. No wires means a more comfortable sleep experience for patients and less data loss for physicians
Our Team
Mariam Abbas
Team Leader/Mobile Developer
Client Liaison
Android App Developer
Unit Testing
Abhinath Kumar
Front-End Developer
UI Design
Dashboard Development
Integration Testing
Vijeykannen Vijayaratnam
Back-End Developer
Azure Cloud Management
Report Editing
System Testing
Requirements
Client Information
NTT Data
NTT Data Corporation is a Japanese System Integration Company and a partially owned subsidiary of Nippon Telegraph and Telephone (NTT). It is the largest IT services company headquartered in Japan. NTT Data develops many products for use in multiple applications. One such product is the Hitoe smart t-shirt, it has electrocardiogram sensors and an accelerometer embedded within the t-shirt which can provide detailed and real-time information on its wearer's heart rate, posture and heart activity. NTT Data has found applications for the Hitoe in the sport, racing and military sectors among others. NTT Data is looking to expand the use of the Hitoe into the medical sector as a wireless sensor suite for sleep studies.
Great Ormond Street Hospital
Great Ormond Street Hospital (GOSH) is a children's hospital located in the Bloomsbury area of the London Borough of Camden. It is the largest
centre for child heart surgery in the UK and one of the alrgest centres for heart transplantation in the world.
The Respiratory Sleep Unit of GOSH evaluates and treats sleep disorders in children.
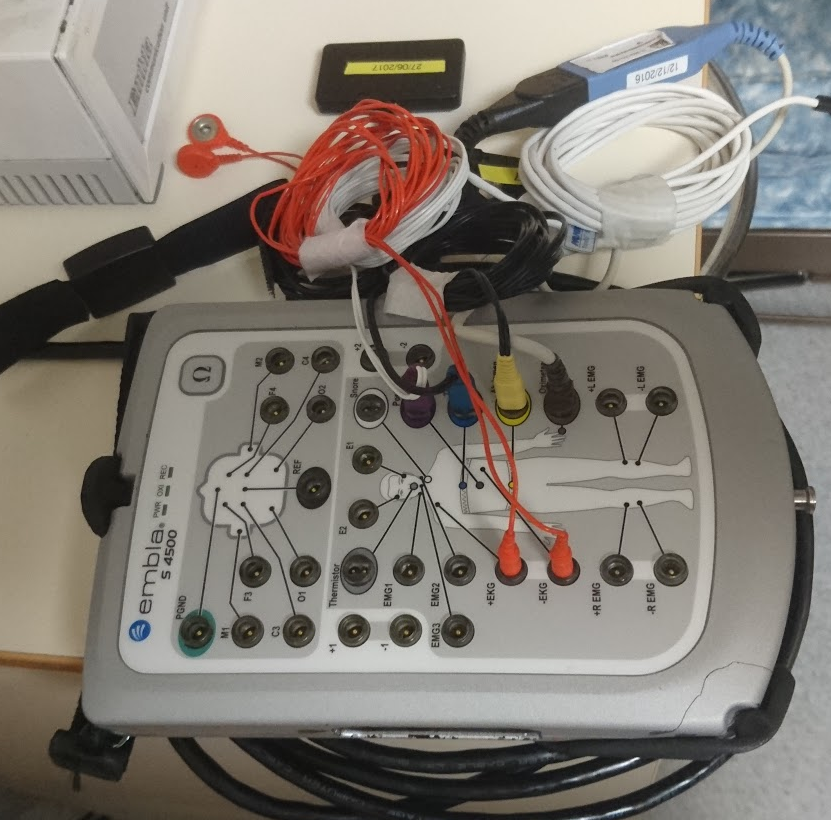
A sleep study involves the use electrocardiogram sensors, chest and lung excursion sensors, oxygen saturation sensors,
and occasionally brain activity sensors. Each sensor is individually wired to a
it difficult for patients to sleep reducing the effective duration of the test. Furthermore, if the patients move or touch the wires in the sleep
it could lead to data loss and may require physicians to adjust the sensors further disrupting the study.
The physicians from GOSH want a wireless sensor suite so that patients can sleep comfortably and have less data lost due to wire movement.
They also want to explore the possibilities for remote monitoring of patients, so that patients could perform sleep studies from the comfort
of their own homes without compromising the usefulness of the data.
Project Goals
Our team was tasked with providing a Proof-Of-Concept implementation of the Hitoe as a wireless sensor suite for sleep studies. We were to modify the Hitoe Android app to push data to a database instead of only displaying on the phone. We had to make a web portal to view the data received from the Android app. This would pave the way for the use of the Hitoe in remote monitoring of sleep studies done at home.
Requirements Gathering
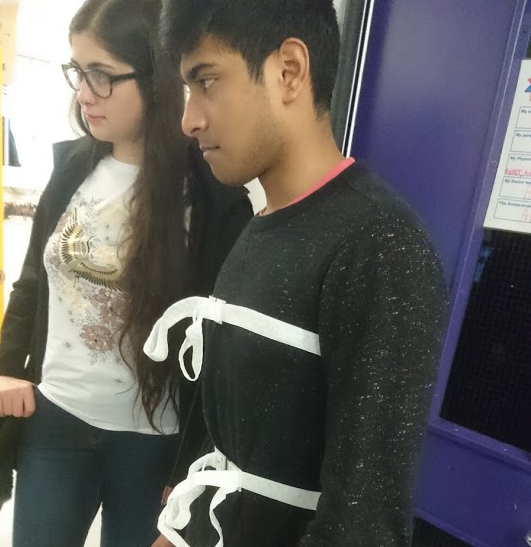
We gathered our requirements through multiple discussions with our client. We talked with both Doctors and Sleep Physicians to get a better idea of the problem from multiple perspectives. Due to confidentiality issues, we were unable to interview any patients but we did have a hands-on trial with the existing sensors to get an idea of how the wires affected patients.
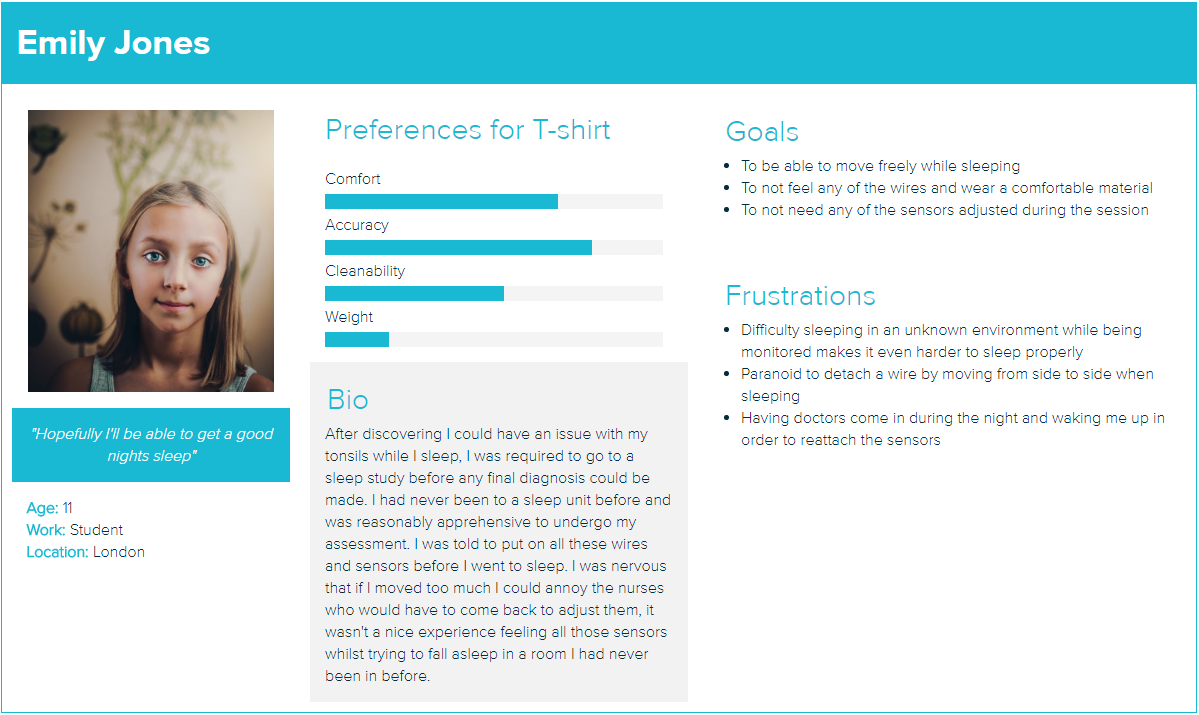
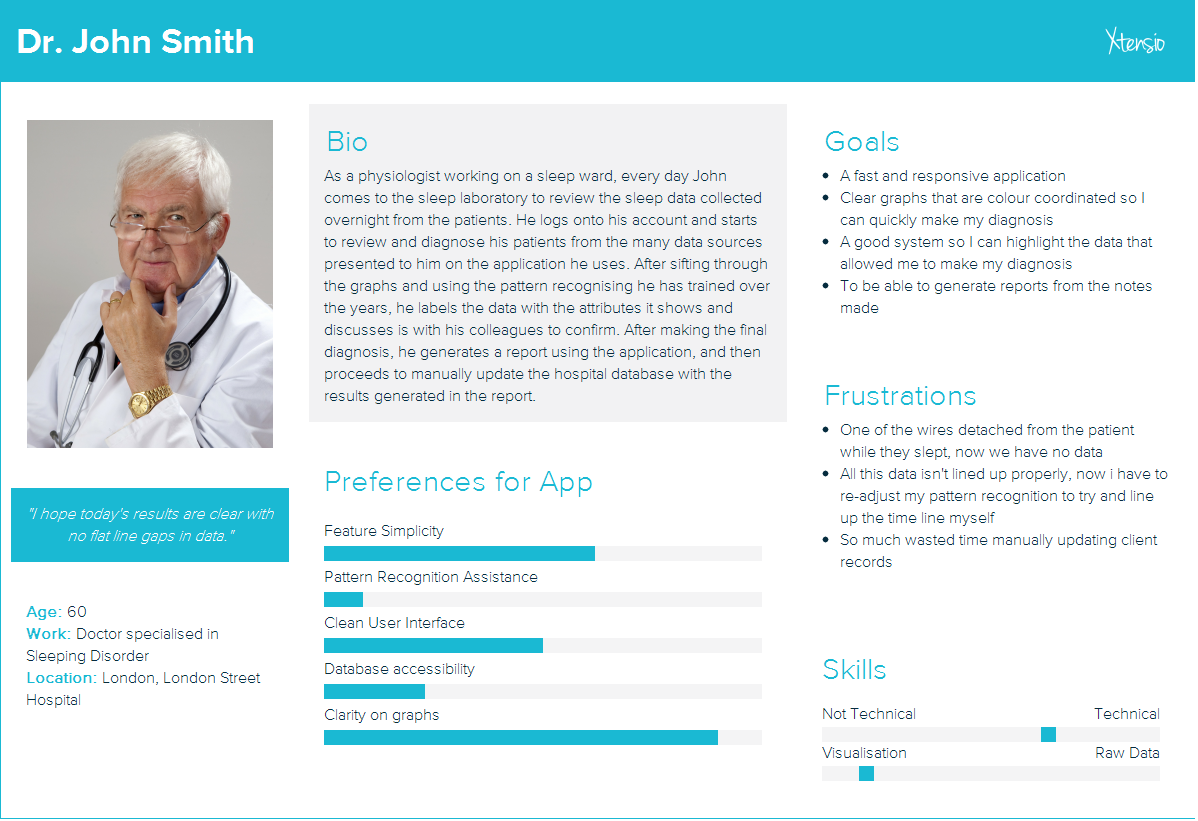
Personas
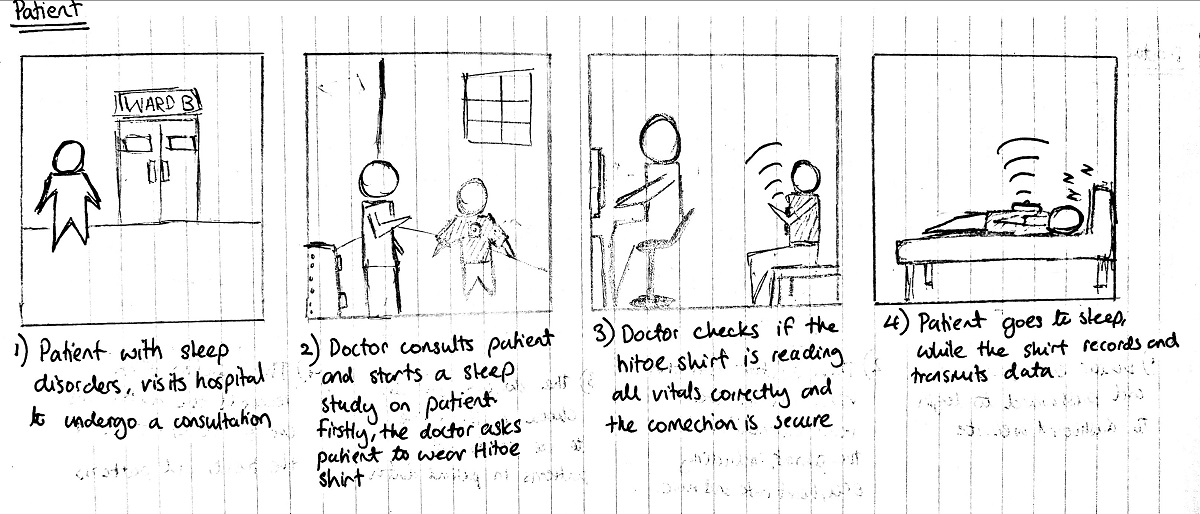
Storyboards

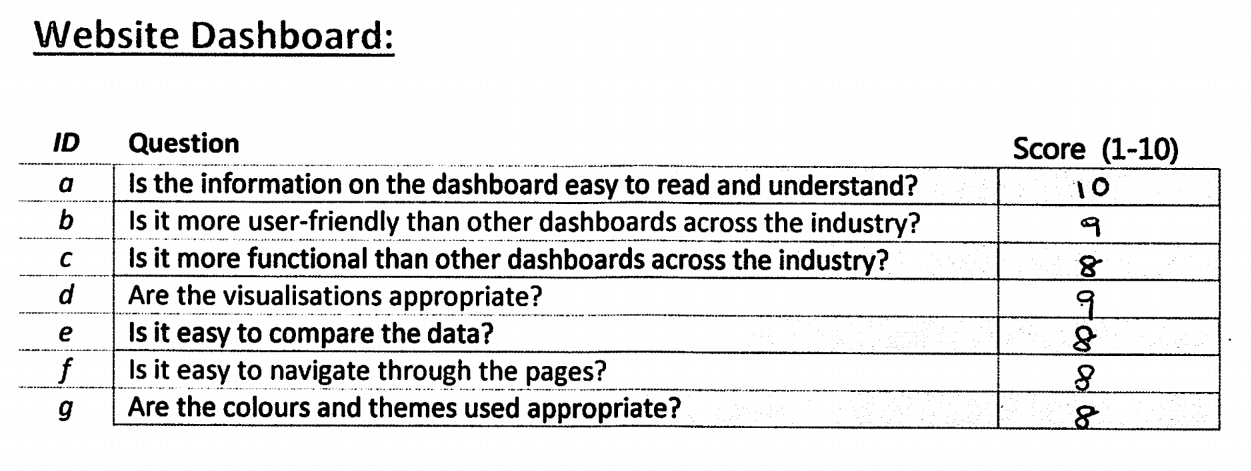
MoSCoW Requirements
Once we gathered all our requirements, we classified them into functional and non-functional requirements and then further divided them into Must Have, Could Have, and Should Have.
| Requirement | Priority | Type |
|---|---|---|
| System must be stored in the cloud or accessible on a localhost | Must | Functional |
| System must be able to operate wirelessly | Must | Functional |
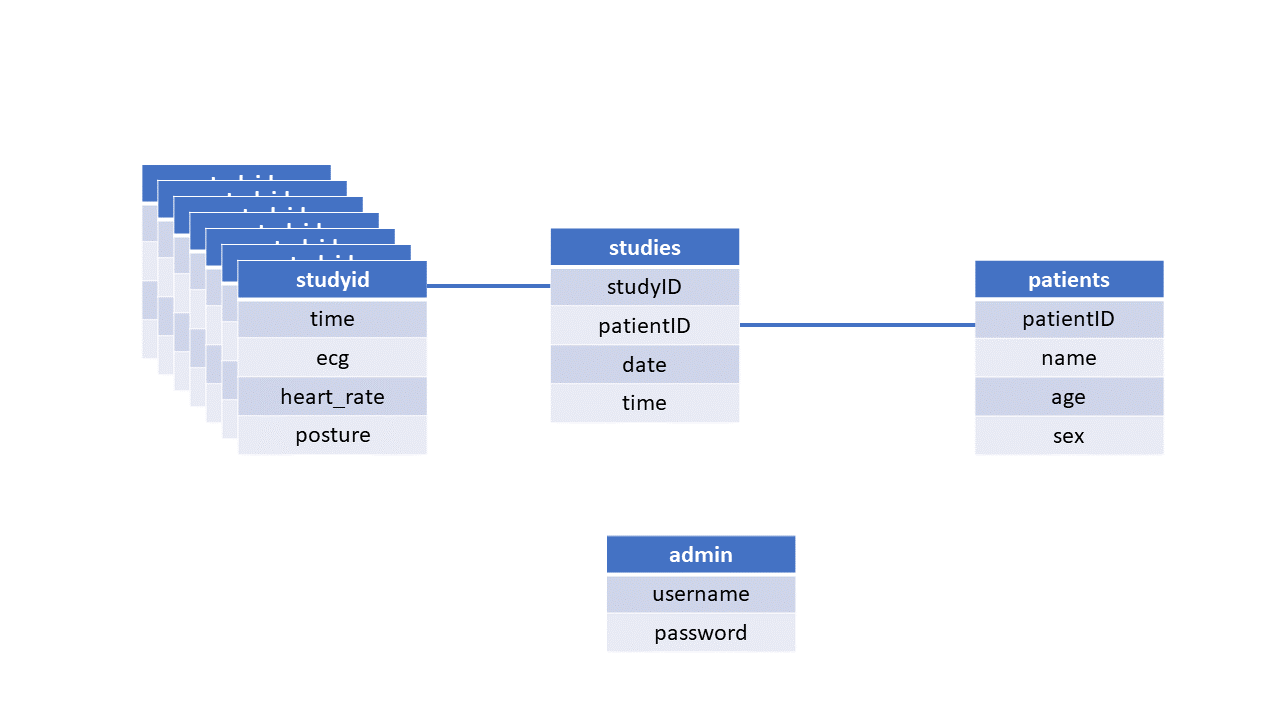
| All data must be stored in a database | Must | Functional |
| A web portal must be built to view the data | Must | Functional |
| The web portal must be able to display the data in real time | Must | Functional |
| Mobile app must send data received from Hitoe in real time to database | Must | Functional |
| The web portal should be able to updata data in real time without refreshing the page | Should | Functional |
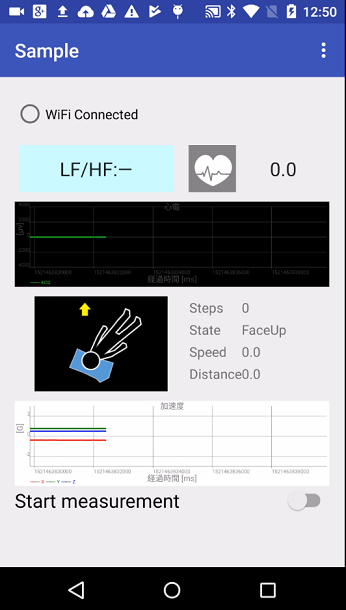
| Mobile App should be able to show if it is connected to the necessary systems (WiFi, Server, Hitoe) | Should | Functional |
| The web portal should have a login system | Should | Functional |
| Database should be encrypted. Data should only be viewable from the dashboard and not from the database admin. | Should | Non-Functional |
| System could notify doctors if sensors are disconnected | Could | Non-Functional |
| Web portal could have a slider to view past data from at least the past 2 hours | Could | Non-Functional |
| Web portal could allow Physicians to export a study as a CSV | Could | Functional |
| System could be able to handle multiple concurrent studies | Could | Non-Functional |
| Web portal could be accessible by multiple physicians from different computers | Could | Non-Functional |
Use Cases
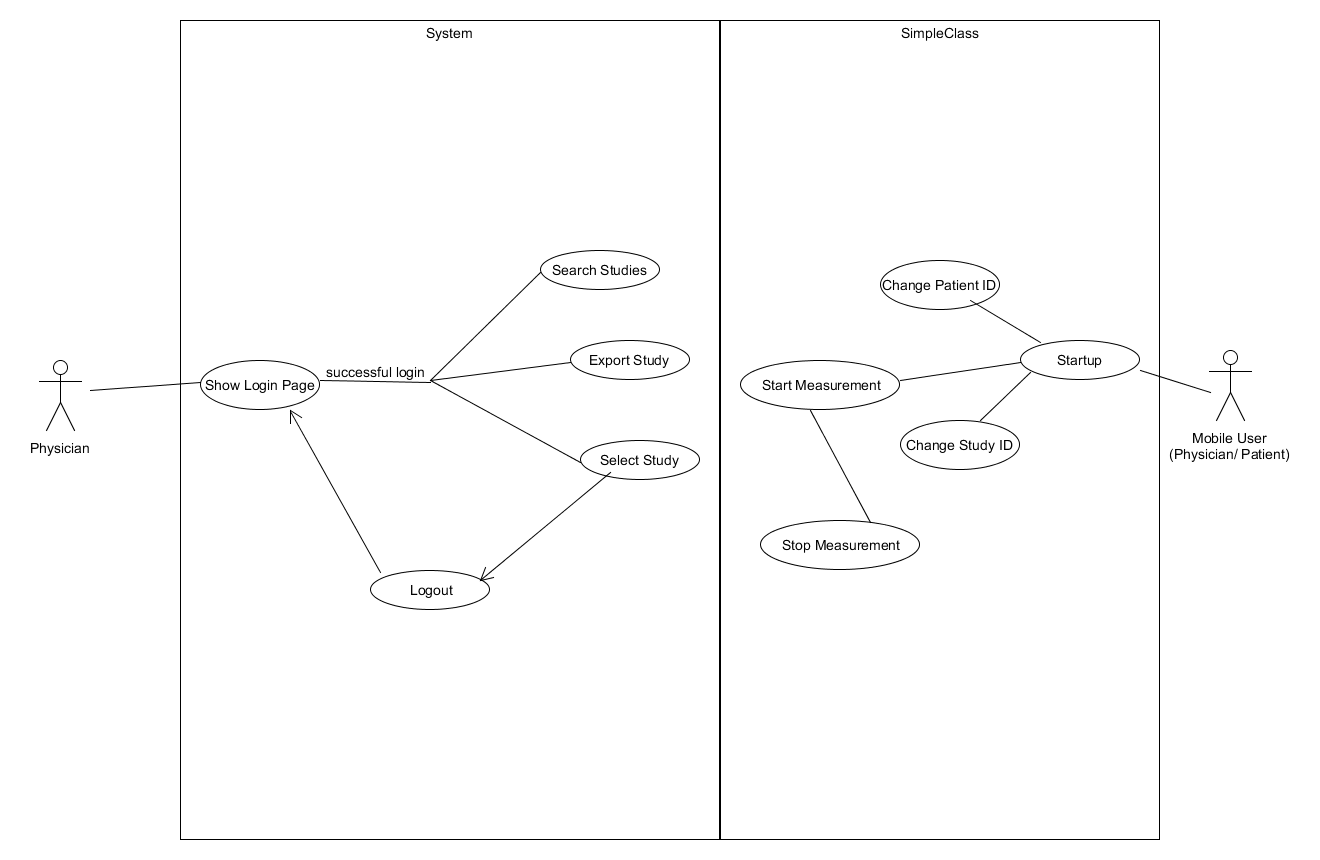
| ID | Use Case |
|---|---|
| WP1 | Show Login Page |
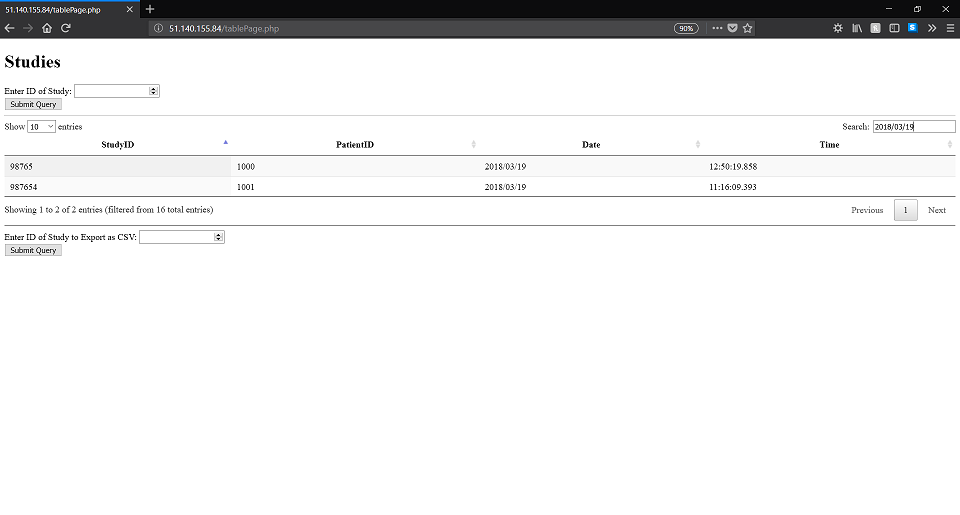
| WP2 | Search Studies |
| WP3 | Export Study |
| WP4 | Select Study |
| WP5 | Logout |
| AA1 | Startup |
| AA2 | Change Patient ID |
| AA3 | Change Study ID |
| AA4 | Start Measurement |
| AA5 | Stop Measurement |
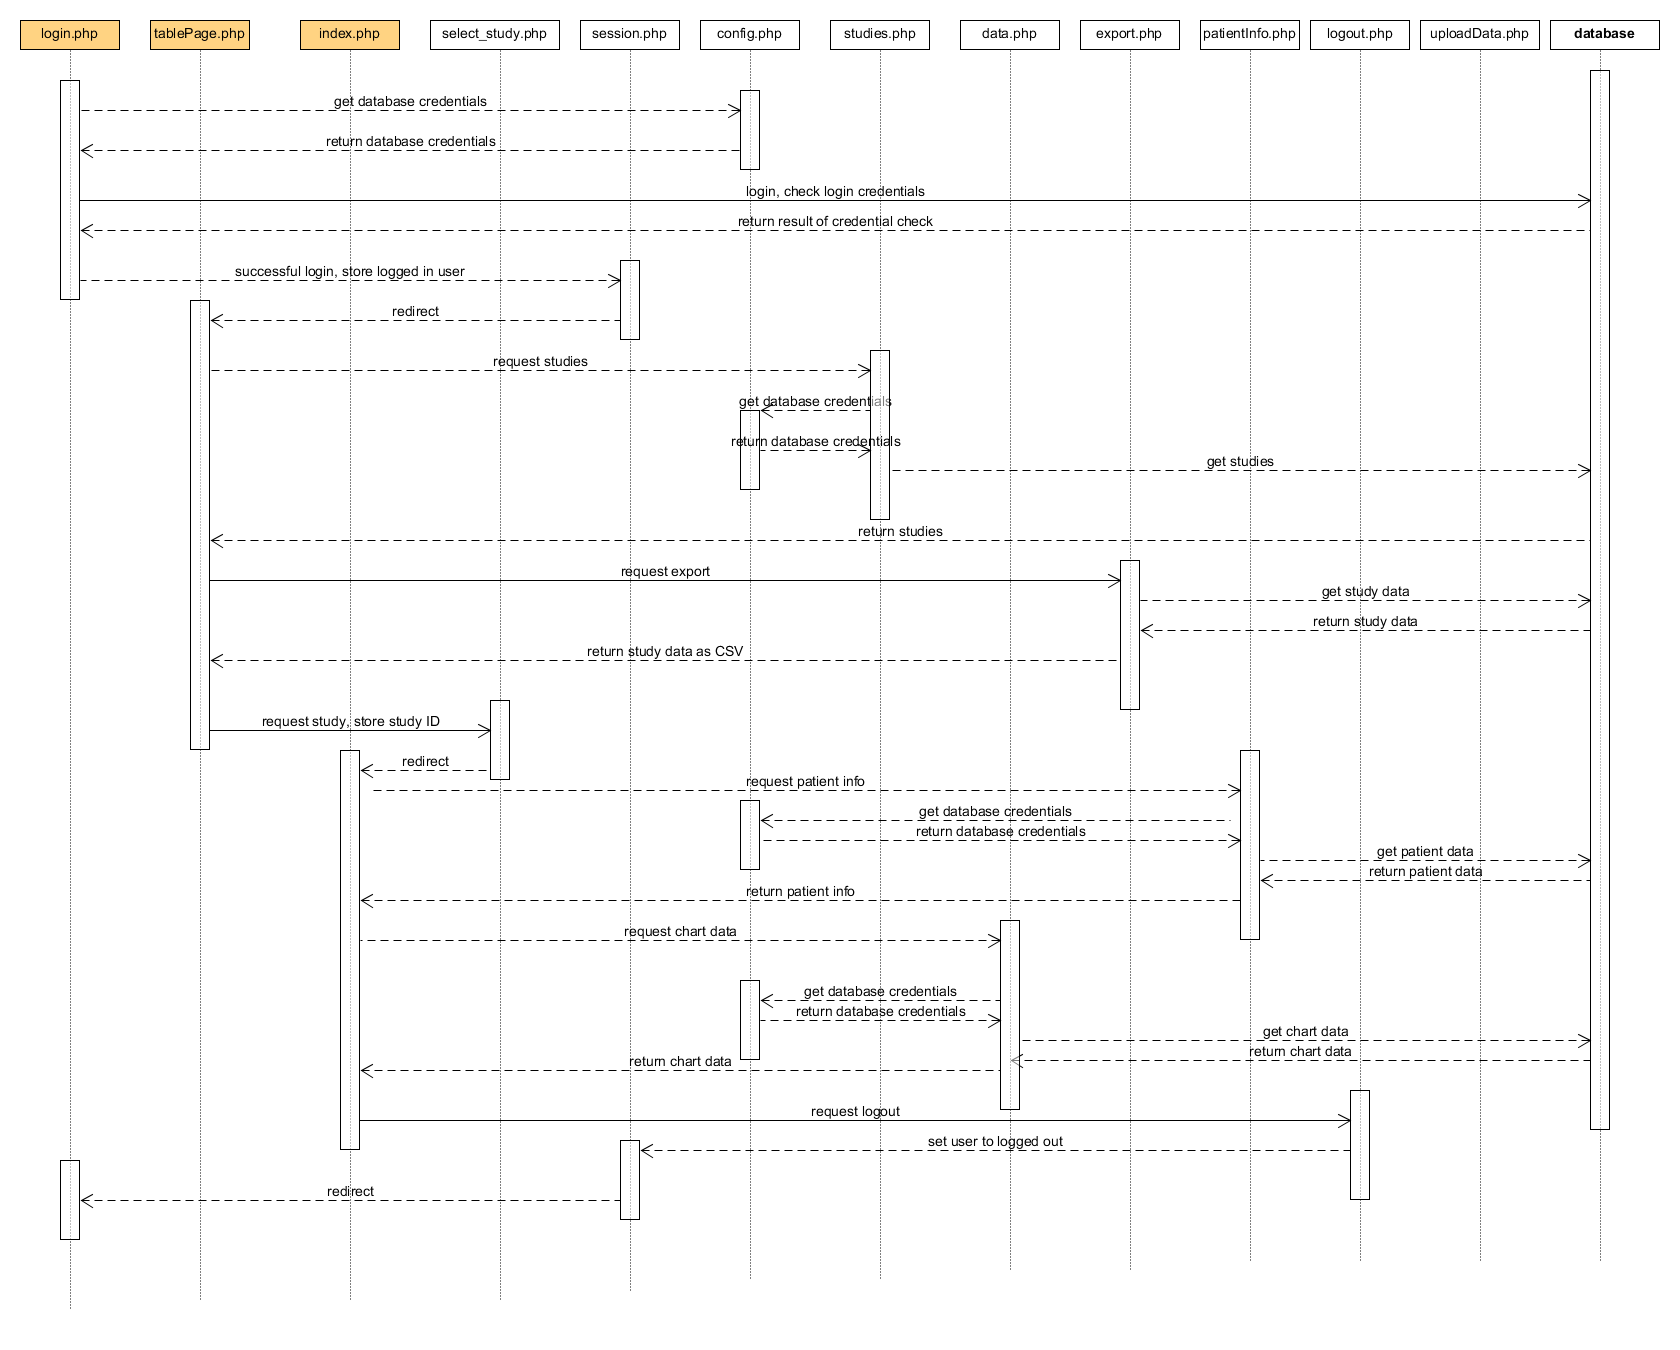
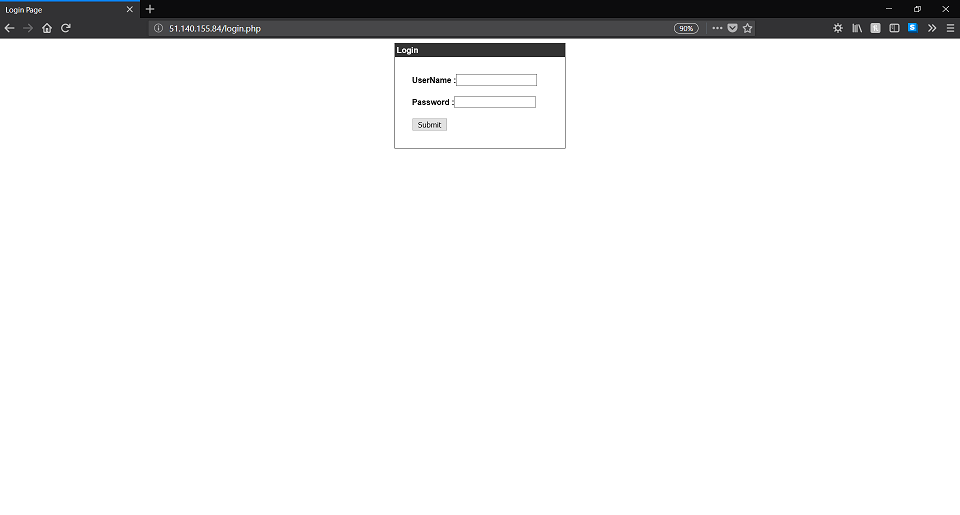
| Use Case | Show Login Page |
|---|---|
| ID | WP1 |
| Brief Description | The system displays the login page |
| Primary Actors | Physician |
| Secondary Actors | System |
| Preconditions | None |
| Main Flow |
1. Physician accesses the web portal via its URL. 2. System displays login page with fields for username and password. 3. Physician enters username and password, then clicks on login. 4. System checks that username and password match with known users. 5. System saves logged in user. 6. System displays table page. |
| Postconditions | Physician is logged in. |
| Alternative Flows |
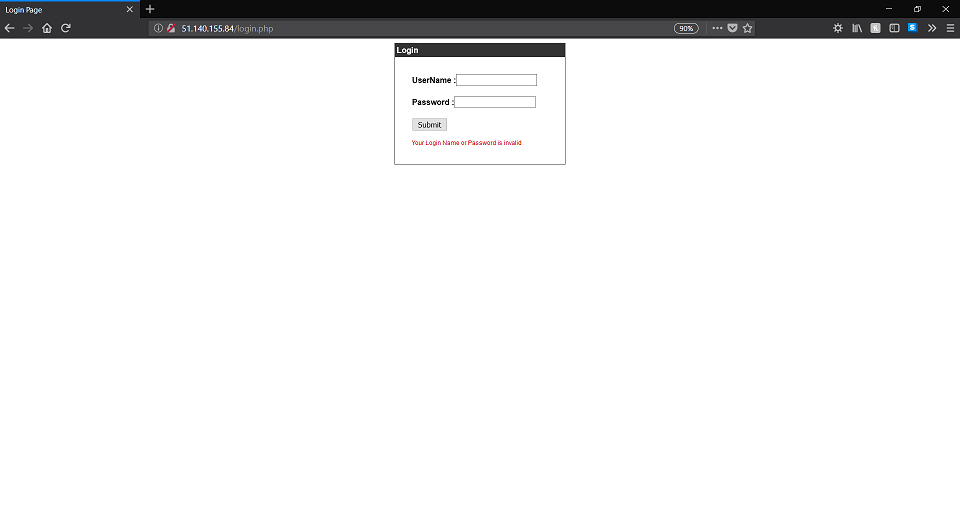
Wrong Credentials Alternative flow starts after step 4 in main flow. 1. System displays error message "Wrong Username or Password" |
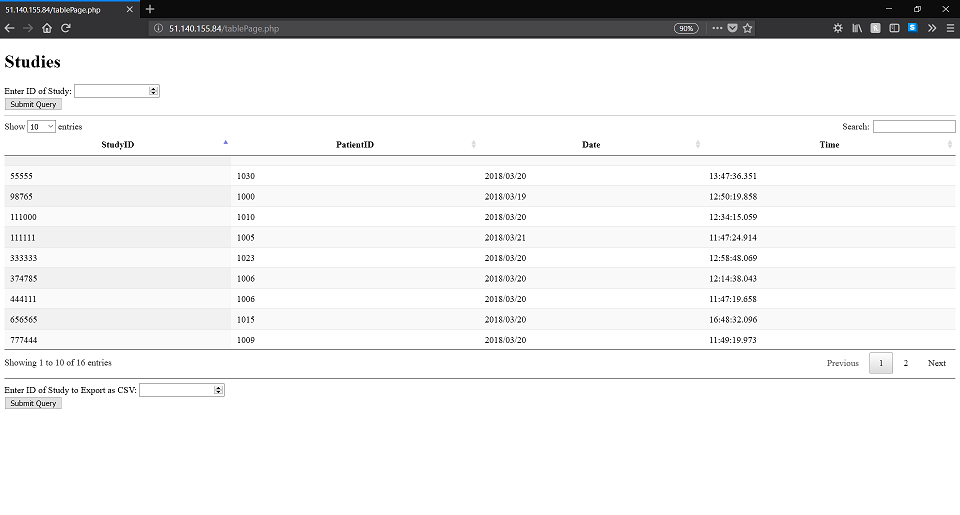
| Use Case | Search studies |
|---|---|
| ID | WP2 |
| Brief Description | System displays Table page where studies can be searched |
| Primary Actors | Physician |
| Secondary Actors | System |
| Preconditions |
1. Physician is logged in (WP1) 2. System is displaying table page. |
| Main Flow |
1. System displays table page with table of all studies. 2. Physician types Study ID, Patient ID, Time, or Date into search box at top right corner of table. 3. System filters table to show studies which match the search field. |
| Postconditions | Table shows filtered table of studies |
| Alternative Flows | None |
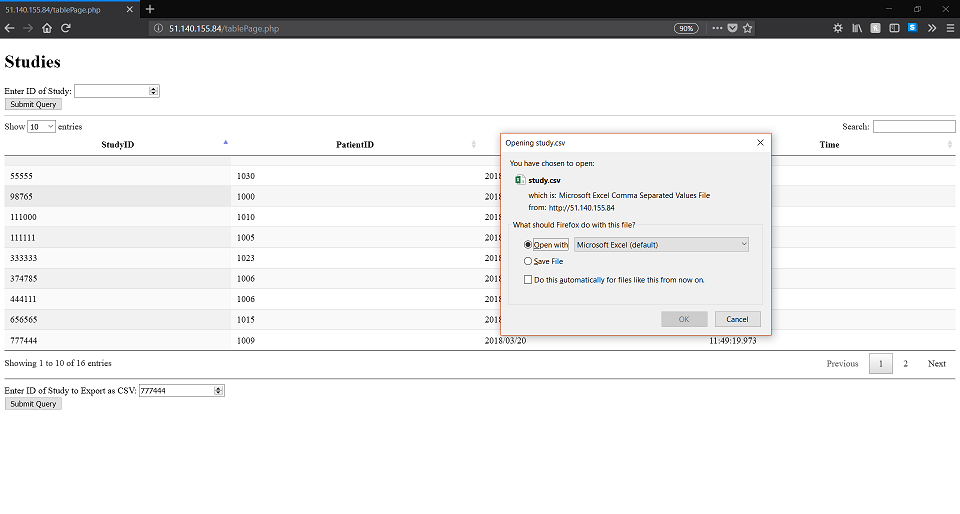
| Use Case | Export Study |
|---|---|
| ID | WP3 |
| Brief Description | Physician selects a study to be exported as CSV file |
| Primary Actors | Physician |
| Secondary Actors | System |
| Preconditions |
1. Physician is logged in (WP1) 2. System is displaying table page. |
| Main Flow |
1. Physician enters the Study ID of the study they want to export into the text field saying "Enter ID of study to export as CSV" and hits enter. 2. System stores the Study ID and queries the database for the table belonging to the study ID. 3. System converts the table into CSV format and displays a download pop-up. 4. Physician clicks save file. |
| Postconditions | Physician has downloaded a CSV of a study. |
| Alternative Flows | None |
| Use Case | Select Study |
|---|---|
| ID | WP 4 |
| Brief Description | Physician selects the study they want to view |
| Primary Actors | Physician |
| Secondary Actors | System |
| Preconditions |
1. Physician is logged in (WP1) 2. System is displaying table page. |
| Main Flow |
1. Physician types in the ID of the study they want to view into the text box "Enter ID of Study" and hits enter. 2. System stores ID of study. 3. System displays dashboard page with the info from the selected study. |
| Postconditions |
1. System has stored Study ID of selected study. 2. System is displaying dashboard page for selected study. |
| Alternative Flows | None |
| Use Case | Logout |
|---|---|
| ID | WP5 |
| Brief Description | Physician logs out from the system |
| Primary Actors | Physician |
| Secondary Actors | System |
| Preconditions |
1. Physician is logged in (WP1) 2. System is displaying dashboard page. |
| Main Flow |
1. Physician clicks on the "Logout" button. 2. System sets the logged in user to none. 3. System displays the login page. |
| Postconditions | 1. Physician is no longer logged in. |
| Alternative Flows | None |
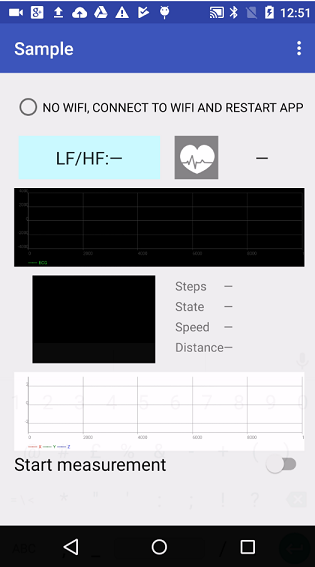
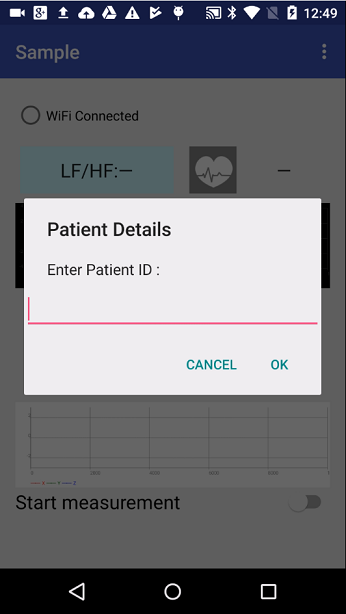
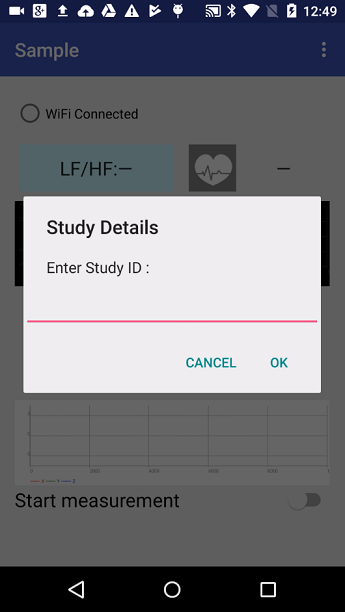
| Use Case | Startup |
|---|---|
| ID | AA1 |
| Brief Description | Mobile User starts up app |
| Primary Actors | Mobile User |
| Secondary Actors | Mobile App |
| Preconditions | Phone is connected to WiFi |
| Main Flow |
1. Mobile User opens app. 2. App asks User to enter a Patient ID. 3. User enters a Patient ID and clicks "OK". 4. App stores the Patient ID. 5. App asks User to enter a Study ID. 6. User enters a Study ID and clicks "OK". 7. App displays main screen. |
| Postconditions |
1. App has stored Patient ID. 2. App has stored Study ID. |
| Alternative Flows |
Alternative Flow starts before step 1 in Main Flow. 1. App displays pop-up telling User to turn on WiFi before starting up the app. 2. User click "OK". 3. App exits. |
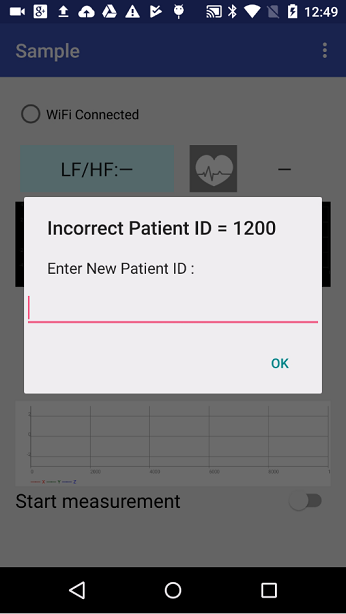
| Use Case | Change Patient ID |
|---|---|
| ID | AA2 |
| Brief Description | Mobile User decides to change the Patient ID previously entered |
| Primary Actors | Mobile User |
| Secondary Actors | App |
| Preconditions |
1. Phone is connected to WiFi. 2. App has stored Patient ID. 3. App has stored Study ID. |
| Main Flow |
1. User clicks on menu button in top right. 2. App displays menu. 3. User clicks on "Change Patient ID". 4. App displays pop-up with current Patient ID and a text field for new Patient ID. 5. User enters new Patient ID and clicks "OK". 6. App displays main page. |
| Postconditions | 1. App stores updated Patient ID. |
| Alternative Flows | None |
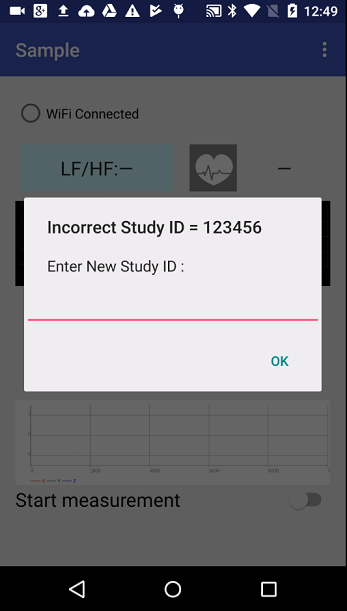
| Use Case | Change Study ID |
|---|---|
| ID | AA3 |
| Brief Description | Mobile User decides to change the Study ID previously entered |
| Primary Actors | Mobile User |
| Secondary Actors | App |
| Preconditions |
1. Phone is connected to WiFi. 2. App has stored Patient ID. 3. App has stored Study ID. |
| Main Flow |
1. User clicks on menu button in top right. 2. App displays menu. 3. User clicks on "Change Study ID". 4. App displays pop-up with current Study ID and a text field for new Study ID. 5. User enters new Study ID and clicks "OK". 6. App displays main page. |
| Postconditions | 1. App stores updated Study ID. |
| Alternative Flows | None |
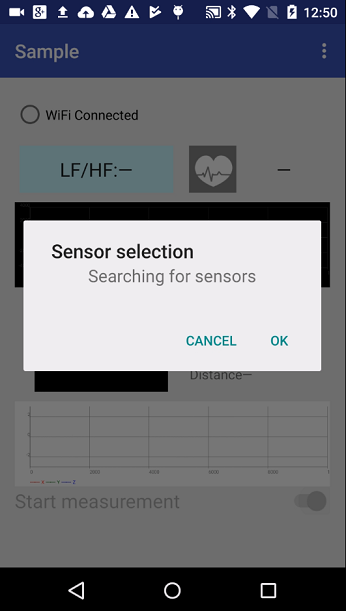
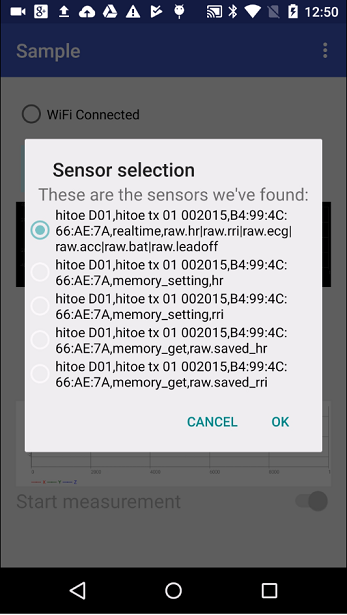
| Use Case | Start Measurement |
|---|---|
| ID | AA4 |
| Brief Description | User decides to start measurement using Hitoe |
| Primary Actors | User |
| Secondary Actors | App, System |
| Preconditions |
1. Phone is connected to WiFi. 2. App has stored Patient ID. 3. App has stored Study ID. 4. Bluetooth is on. |
| Main Flow |
1. User clicks on "Start Measurement". 2. App displays a pop-up saying it is searching for available sensors. 3. After some time, the App displays a list of the sensors it has found. 4. User selects their Hitoe shirt from the list and clicks "OK". 5. The App starts receiving data from the Hitoe. 6. App displays data from Hitoe on main screen. 7. App sends data from Hitoe to Sytem in the background. |
| Postconditions |
1. Hitoe is connected. 2. App is sending data to System. |
| Alternative Flows |
Alternative Flow starts after step 3 in Main Flow 1. If no sensors are found the App displays an empty list of sensors. 2. User clicks on "OK". 3. App displays main screen. |
| Use Case | Stop Measurement |
|---|---|
| ID | AA5 |
| Brief Description | User decides to stop measurement using Hitoe |
| Primary Actors | Mobile User |
| Secondary Actors | App, System |
| Preconditions |
1. Phone is connected to WiFi. 2. App has stored Patient ID. 3. App has stored Study ID. 4. Bluetooth is on. 5. Hitoe is connected. 6. App is sending data to System. |
| Main Flow |
1. User clicks on "Start Measurement" button. 2. App stops receiving data from Hitoe. 3. App stops sending data to System. |
| Postconditions | 1. App has stopped sending data to System. |
| Alternative Flows | None |
Research
Existing Sleep Study Systems
Polysomnography
Polysomnography is a diagnostic tool in sleep medicine used to determine sleep disorders. In its most basic form it requires the use of electrocardiogram sensors to measure heart activity, chest and abdomen excursion sensors to measure respiratory activity, and pulse oximeters to measure blood oxygen level. More in-depth studies may add sensors to measure eye movements or brain activity. [1] The data from these sensors is transmitted to a physician's computer. These studies need to be performed in a sleep clinic and require at minimum four wired sensors. These two factors can lead to discomfort for patients.
Home Sleep Study Kit
Home sleep study kits were designed to overcome the need for sleep studies to be done in a clinic. They have the necessary sensors for a basic polysomogram (electrocardiogram, chest and abdomen excursion, pulse oximeter) but have a memory unit in the sensor hub able to store the data for one to two sleep studies. The patient would attach the sensors to themselves before going to sleep in their own bedroom, after that they have to return the kit to a physician who will download the data from the kit and perform their analysis of the data. [2] These kits allow patients to perform the sleep study at home, however they still use wired sensors which still lead to discomfort. Furthermore, patients may find difficulty attaching the sensors correctly.
Hitoe
The Hitoe provides an electrocardiogram and accelerometer embedded in the shirt. It transmits data via Bluetooth to an Android phone which displays the data. Since the sensors are embedded in the shirt there are no exposed wires. The Hitoe does not currently have the necessary sensors to conduct a sleep study. However the shirt is comfortable and easy to use as the sensors do not need to be individually attached to the body.
Decision
In order for the Hitoe to be a viable replacement for polysomnography it would need to be fitted with additional sensors. It would also need to be modified to transmit the data to a computer or a cloud storage so that the data can be analysed by a physician. Due to the limited timeframe and the team's general lack of experience in product design and electrical engineering, we decided that we would focus on building the data transmission modifications. We would modify the Hitoe Android app to transmit the data to a cloud storage which can then be accessed via a web portal. This would allow the data to be viewed in real time, which would be an improvement over home sleep studies and paves the way for the Hitoe to be used for remote monitoring of sleep studies.
Mobile Application
The Hitoe had both Apple and Android versions of its application. We had to decide on one to modify.Apple (iOS)
It would make sense to have developed an Apple app as the iPhone is the most popular smartphone operating system in the UK [3], this would theoretically make the Hitoe accessible to more people in the UK for home sleep studies. However, the team has not had much experience developing apps for iOS.
Android
Android apps have the benefit of being coded in Java which the team has had prior experience with. Furthermore, the average price of an Android phone is about a third of the average price of an iPhone. [4] This would lead to significant savings for physicians if they had to purchase phones to use the Hitoe.
Decision
We decided to develop in Android as our client GOSH would have to buy smartphones in order to use the Hitoe in their sleep clinic. We concluded that the slight lead in market share of Apple over Android in the UK was not as significant as the potential savings from Android phones.
Data Visualisation Framework
Razorflow
Razorflow is a data visualisation framework that supports industry-standard column, pie, bar, line charts and more. It is cross-browser compatible and even mobile friendly. [5] The most appealing feature of Razorflow for our team was that it supported server-side wrapping which meant that dashboards could be built entirely using PHP without any JavaScript or HTML. This would mean that our team would have needed less research to begin coding.
Chart.js
Chart.js is an open source HTML5 data visualisation framework. [6] Chart.js includes smooth transitions when updating data which is important for our dashboard as data from the t-shirt would be updated in real time. Chart.js also has very comprehensive documentation and a large user base.
Decision
Upon further research into the documentation of Razorflow, we discovered that the PHP only version of Razorflow did not support real-time updating. Thus the main selling point for Razorflow was rendered moot. We decided that Chart.js would be the ideal data visualisation framework.
References
[1] Mayo Clinic, "Polysomnography (Sleep Study) - About - Mayo Clinic," 4 December 2014. [Online]. Available: https://www.mayoclinic.org/tests-procedures/polysomnography/about/pac-20394877.
[2] Sleep.org, "Do at Home Sleep Studies Really Work | Sleep.org," [Online]. Available: https://sleep.org/articles/home-sleep-study-kits/.
[3] Statista, "Mobile OS: Market Share in the United Kingdom 2011-2018 | Statistic," 2018. [Online]. Available: https://www.statista.com/statistics/262179/market-share-held-by-mobile-operating-systems-in-the-united-kingdom/.
[4] M. Rutnik, "Price gap between Samsung and Apple smartphones reaches new record - Android Authority," 5 May 2017. [Online]. Available: https://www.androidauthority.com/price-gap-samsung-apple-smartphones-769772/.
[5] Razorflow Technologies LLP, "Razorflow - HTML5 Dashboard Framework," 2014. [Online]. Available: https://razorflow.com/.
[6] Chart.js, "Chart.js | Open Source HTML5 Charts for your Website," 2017. [Online]. Available: http://www.chartjs.org.
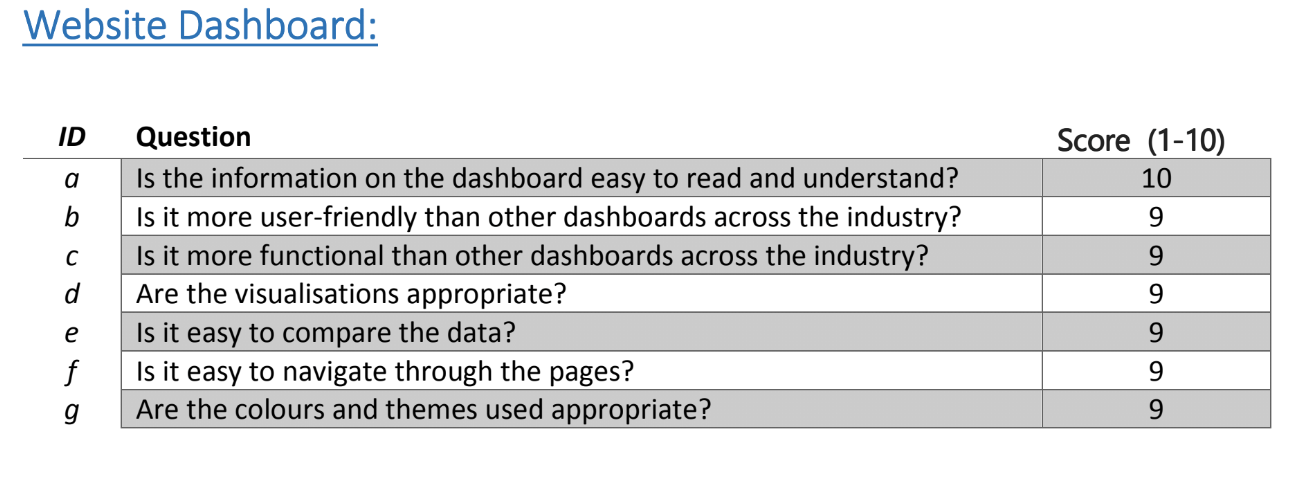
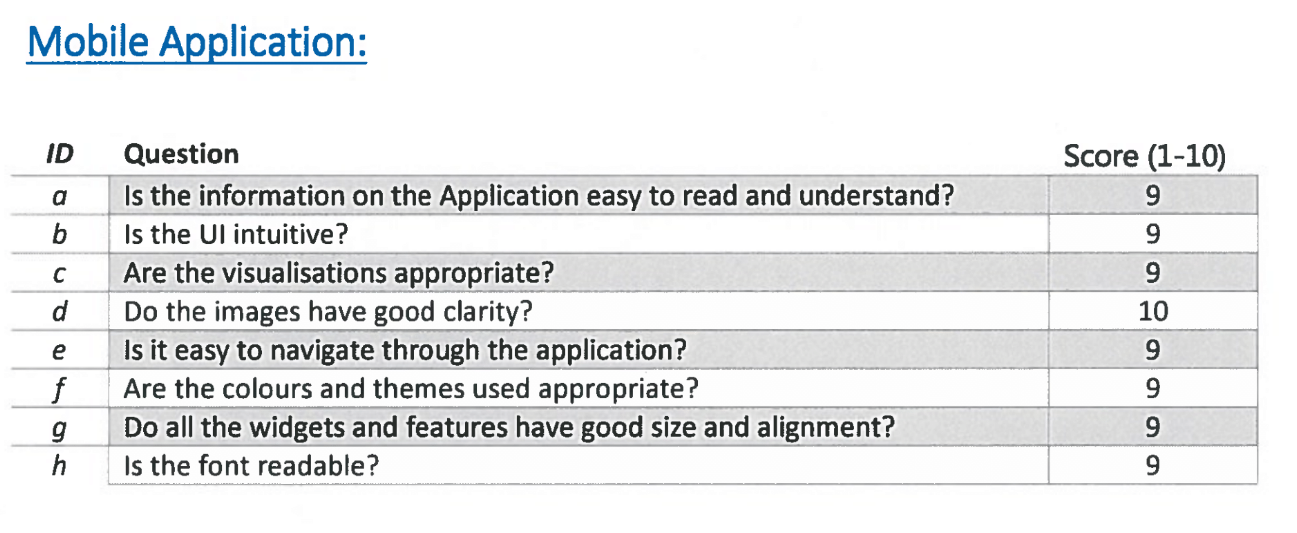
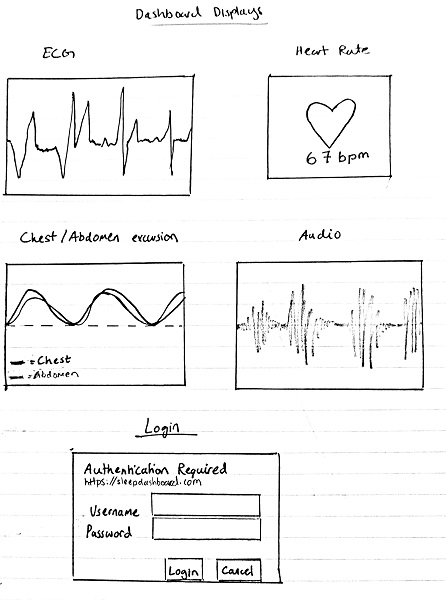
Human Computer Interaction
Interviews
Sketches
Widgets
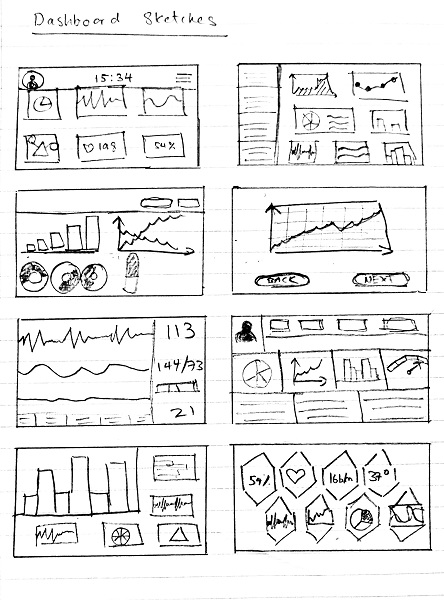
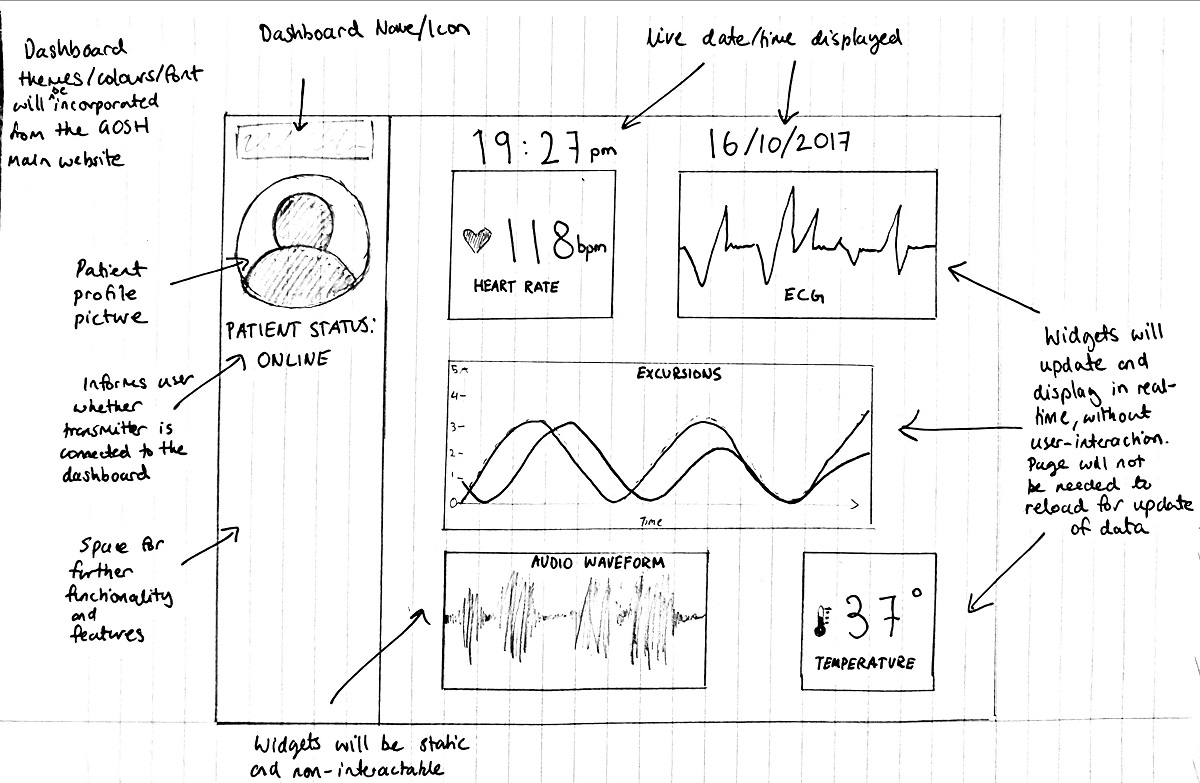
Dashboard Sketches
Final Dashboard Sketch
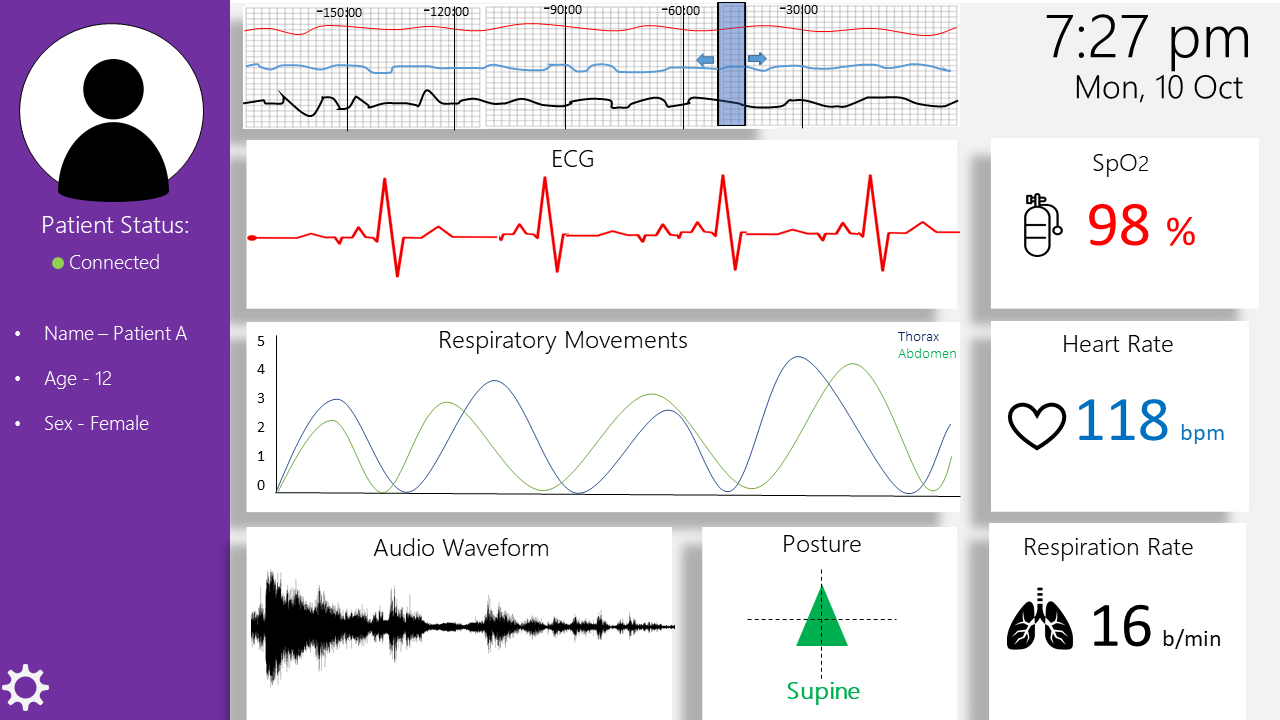
Wireframe
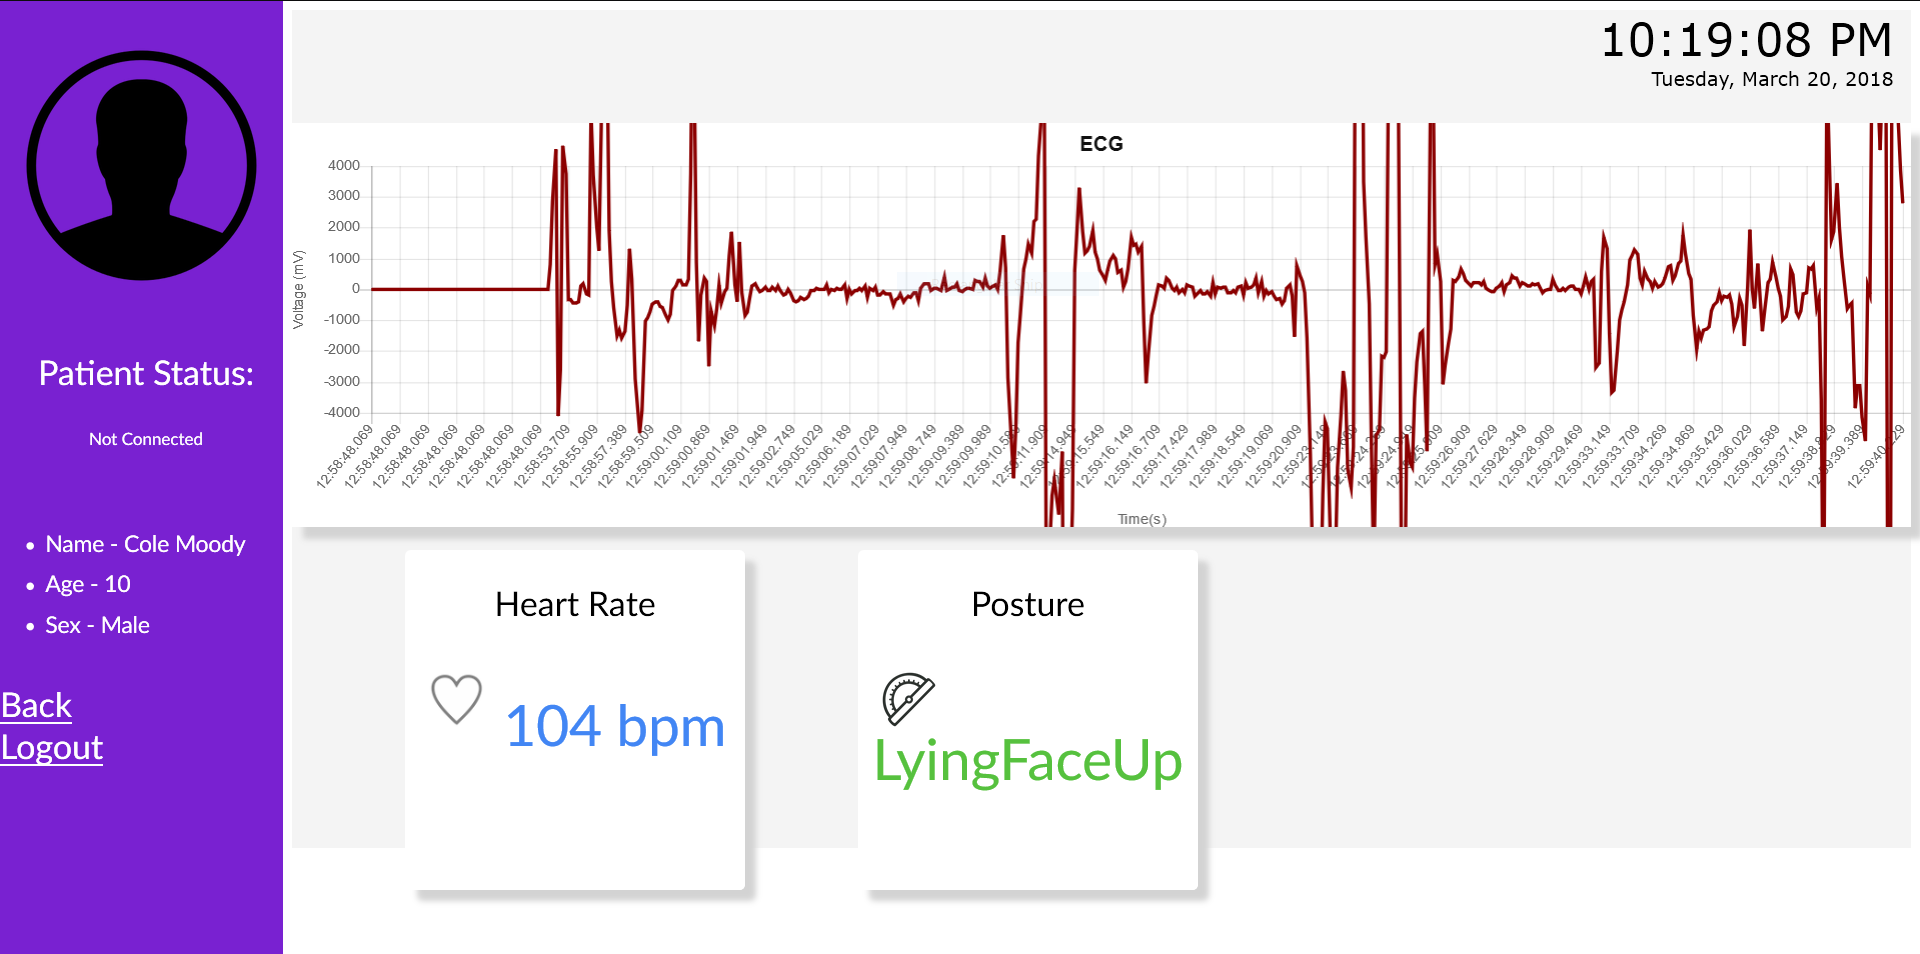
Final Prototype
.png)