Our teaching materials are project-based and cover the basics of data visualisation
using D3(Data-Driven-Documents or d3.js is a javaScript library for visualising data)
The materials are divided into Introduction to D3, Scaling, Selection, Basic shapes
and Colors, Advanced techniques and the final project.
Each lesson consists of explanatory texts and screenshots. We encourage students to test
things out while learning so that they can better understand the techniques covered in the
lessons, and the screenshots can help students check their results. The three lessons gradually
build up the tools students need for the the final project which is in the form of a competition.
In the final competition, students will use the techniques they have learnt to visualise a set of
data they choose. The mark provided only gives a guideline of how final projects should be assessed.
Teachers can adjust the marks and criteria accordingly.
The teaching materials require knowledge of HTML,CSS and JavaScript which are covered in our
previous lessons.
To download d3.js. Go to:http://d3js.org/
Screenshot:
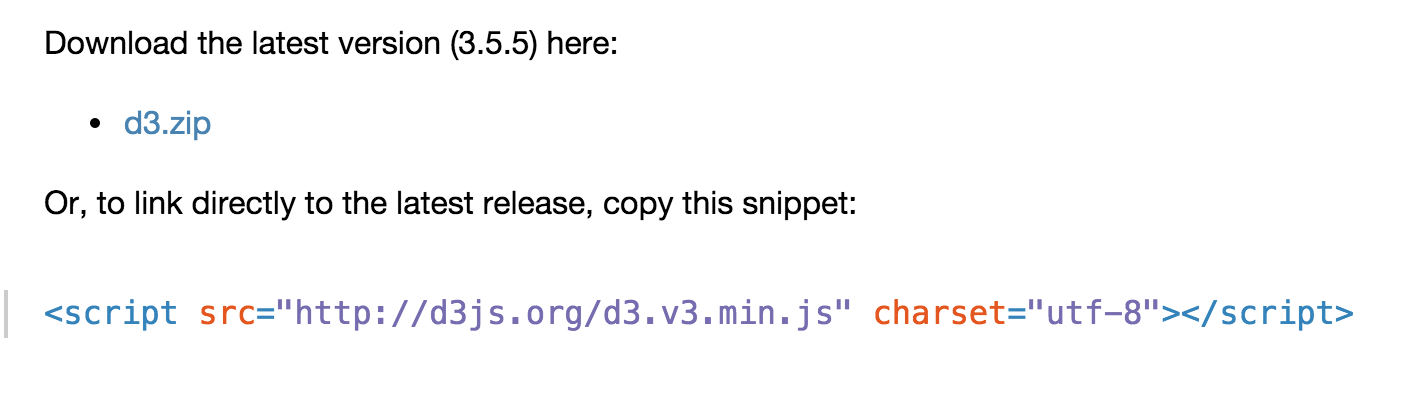
Students may find this website very useful as there are many examples