Our project builds upon the work of performed by Team 20 during the 2020/21 IXN
cycle.This work can be
found hosted at: https://clarionclinical.net/
1,2.
Our first step in our research involved analysing the existing system, taking the following steps:
- User Experience3,4
- Testing the system from the perspective of a user
- Collecting feedback from real users of the system (clinicians, managers and hospital heads) about their experience with the system
- Liasing with the client to understand their vision for the system and how it could be improved
- Technical
- Analysing the project's deployment guide, technologies and implementation
- Reviewing the project's source code (https://github.com/UCLComputerScience/COMP0016_2020_21_Team20)
- Meeting with the client to understand the current technical pain-points
This initial review identified 4 core strengths we could harness and 4 weaknesses which, if addressed, would result in a more usable, useful and efficient system.
Related Project Review: Previous IXN Project
Strengths
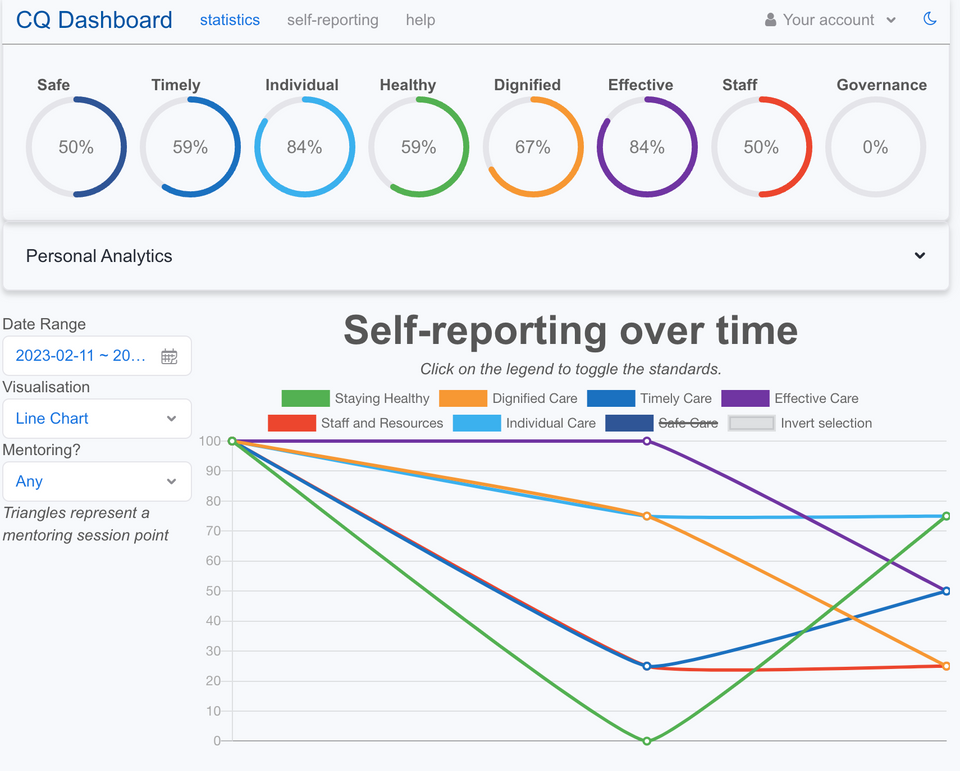
Statistics view
Clinicians and managers appreciate the current statistics view, it provides a clear and immediate picture of the past and present, it also allows for easy filtering of results.
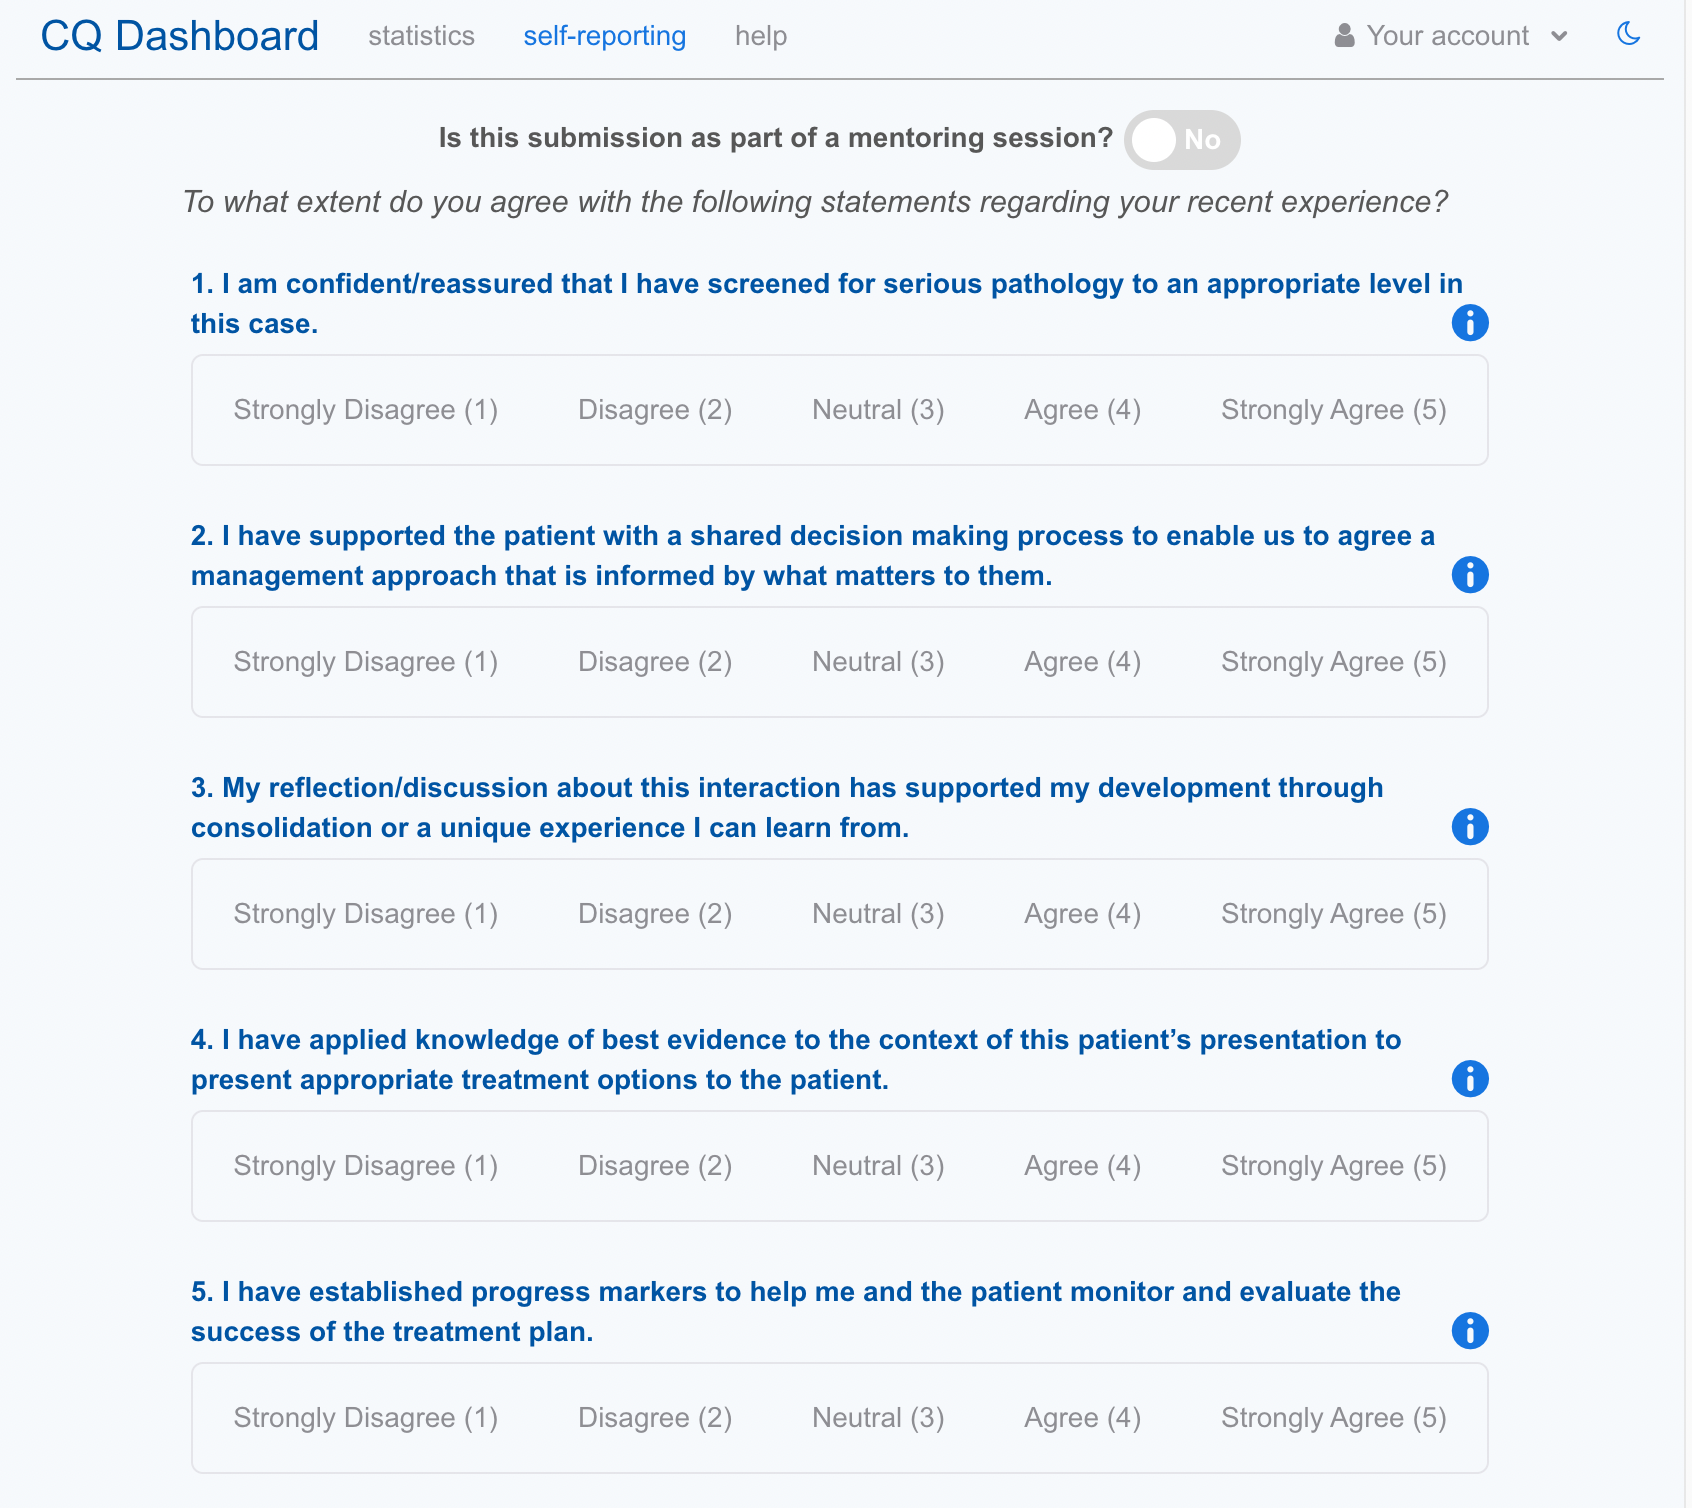
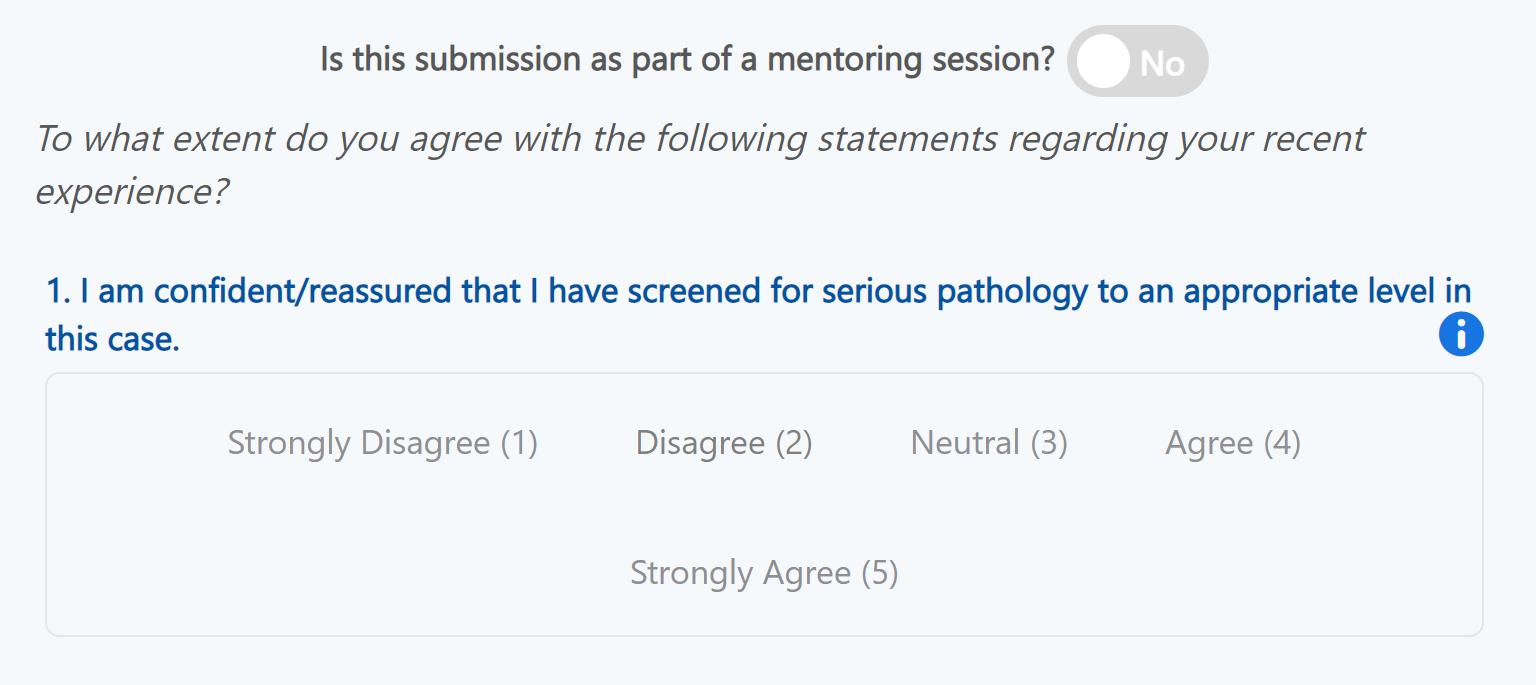
Self reporting
Like the statistics page the self reporting page is clear and effective. It is easy for clinicians to complete their assessment in minutes
Mentorship Sessions
The current system allows user to complete self assessment forms within the context of mentorship sessions
(where users are paired with their managers and can discuss each question).
This is reflected by a checkbox. Mentorship sessions are visualised in the statistics page using a separate
icon.
Wordcloud
The current system possesses a powerful visual tool in the form of a wordcloud. When completing a self-assessment form, clinicians can enter “Enablers” and “Barriers”: words which represent current positive and negative feelings. These can be seen by managers to get a quick picture that reflects the clinicians’ current mood.

Weaknesses
User Onboarding
The biggest pain point in the existing system is the user onboarding. Each user account needs to be
created
individually by the system administrator, this involves assigning a temporary password which needs to be
handed over securely to the user. There is also no prompt upon login to change this password, as a result,
it is thought that many users will keep this password permanently.
Altogether, this results in a complex and time consuming process. Stakeholders suggested registration
could
be deferred to users and approved by the admin, resulting in a more efficient system.
User roles
Another issue is the current lack of an adequate role hierarchy to represent the real-world usage. The system currently has department and hospital managers but is missing team managers: a key role which is the primary supervisor and point of contact for clinicians.
Only one form type
The system has been well received by stakeholders, as a result, users would like to apply this for multiple different form types, in addition to the Care Quality Framework.
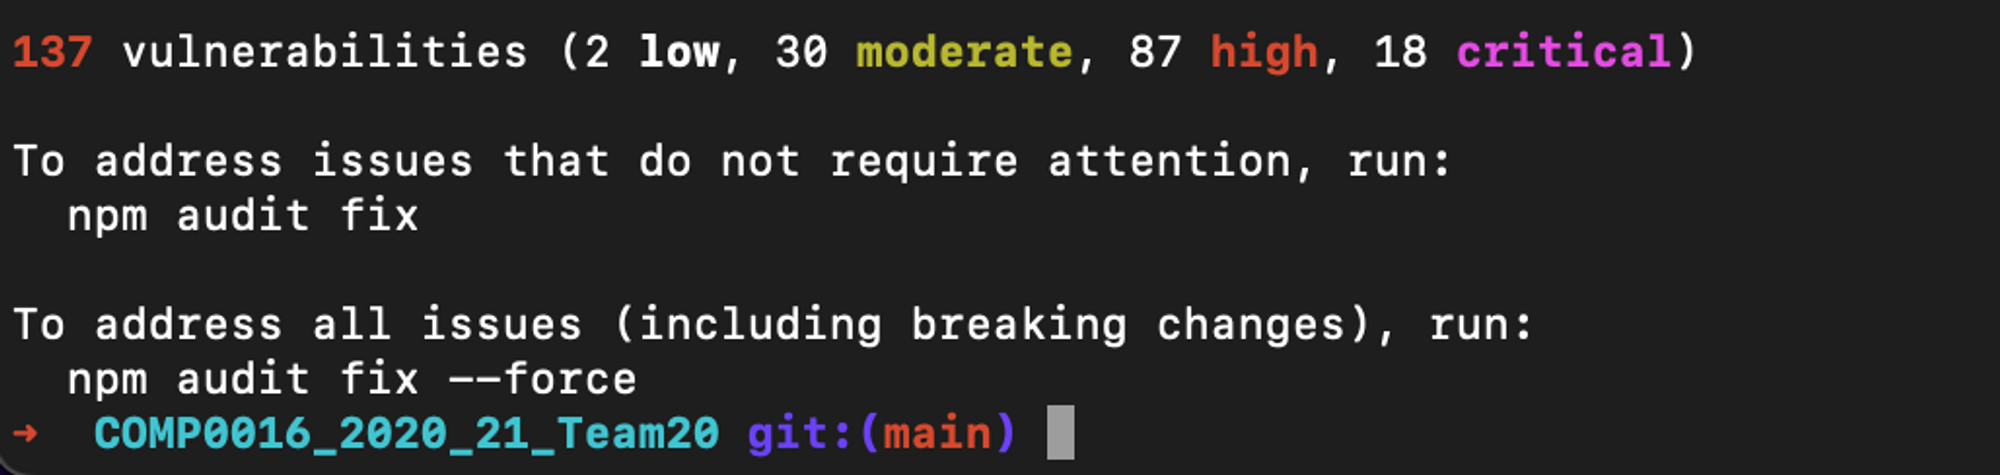
Hosting & Maintenance
Maintaining the system and implementing new features requires a level of technical expertise which can represent a barrier for most users. When running the system we noticed many of the dependency packages used were outdated and presented severe vulnerabilities.
Conclusion
These 8 points represent key takeaways resulting from multiple conversations across the user spectrum. We will now look into applying these findings when designing our extension to the system.
Technology Review
The initial intention was to expend the existing system's functionality. However, after consulting with stakeholders, in particular system administrators, we realised the complexities of deploying the current system within the Welsh NHS environment. Additionally, users were vocal about the possibility of extending the system themselves, creating new pages and views in the future, without the need for much technical knowledge.
After considering this feedback our client proposed an alternative approach using low code tools. This
would allow users to easily maintain the system both at a technical and non-technical level. Providing a
number of advantages, including:
- Ease of Maintenance & Security: Deployment is a one-click operation, platform-side updates reduce the burden on system admins
- Streamlined Authentication & User Management: One of the main challenges with the original application was due to the sel-hosted authentication system
- Increased end-user flexibility: Low-code platforms provide users with the tools to easily add new desired functionality
As a result, the first step in our research involved investigating the suitability of different low-code platforms5.
Low-Code Platforms
Retool
Retool6 is a platform which allows users to build custom internal tools and applications for
their
businesses.
It supports a wide range of data sources and integrations, including databases (such as MySQL, PostgreSQL,
and
MongoDB), APIs (such as Stripe, Twilio, and GitHub), and more. Custom workflows can easily be built by
connecting these data sources and services.
As a tool, it is more suited to create management dashboards and is intended for use within internal
applications. As a result, users must be signed-up by an administrator, this means it is not-ideal to
accomplish our self-registration goal.
Microsoft Power Apps Suite
Microsoft Power Apps7 is a low-code platform that allows users to easily create custom business
applications
without the need for extensive programming knowledge. It platform provides a range of pre-built templates
and
components, which can be extended through custom code blocks.
One of the main disadvantages of the suite is its licensing: a license is required for each user of the
system, this can be a financial and maintenance burden. It also increases vendor lock-in, which could
prove
to
be problematic should the pricing structure change or a better solution come along.
Softr (chosen)
Softr8 is a low-code environment allowing
users with
no programming experience to use
it with ease, making it an ideal choice for the client. Softr is a powerful tool with a vast selection of
built-in “blocks” which are the key elements in building a platform/website.
We will try to replicate and extend the previous system using these blocks however Softr also gives
the option of a “Custom code block” which we will utilise when the builtin blocks are not functional for
the task, for example we will be using the code block for the charts as the graphing block in Softr is
quite limited.
Softr can also be integrated with OpenId which allows
for federated authentication,
allowing users to use third-party applications to authenticate themselves.
Airtable (chosen)
Airtable9 is the industry standard for
building
databases without any prior coding/programming experience. One
of the main advantages is its extensive community support and out of the box Softr integration.
Data from the database can be then visualised using powerful extensions in Airtable such as Vega lite.
Repetitive tasks can also be automated in Airtable using Airtable’s builtin automations which allows users
to
create rules that automatically trigger specific actions.
Overall Airtable provides users with the freedom to view and edit tables autonomously.
Charting Libraries
We investigated various charting libraries to display self-reporting statistics across a variety of user
groups. As part this research we tested and evaluated each library according to the following metrics:
- Supported chart types
- Licence terms (price, open source, limitations)
- Available documentation (website documentation, examples)
- Community support & popularity (measured through the number of Stackoverflow Q&A posts)
- Chart customisation support (e.g. legend, colours, aspect ratio)
- Additional features (e.g. 3rd party plugin support, chart export & sharing features)
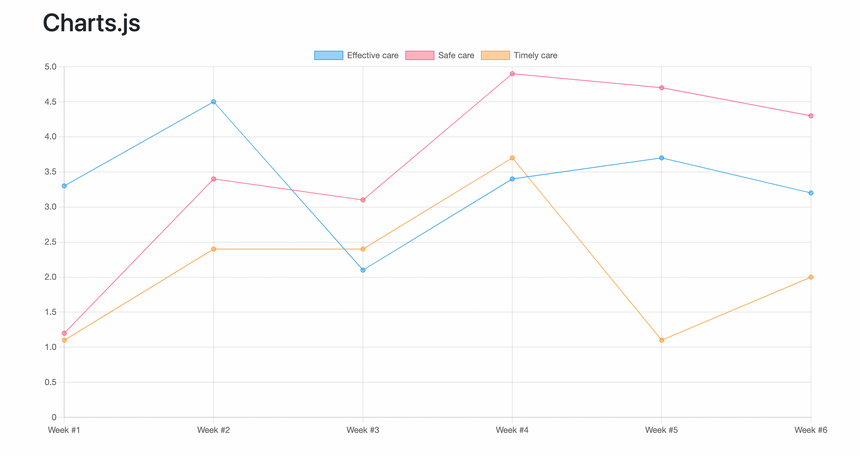
Chart.js (Final Choice)
10- Supported chart types: line, bar, pie, scatter plot
- Licence terms: Free and Open Source (MIT)
- Available documentation: 5/5
- Community support & popularity: 4/5 (29,374 results)
- Chart customisation support: 4/5
- Additional features: 4/5.
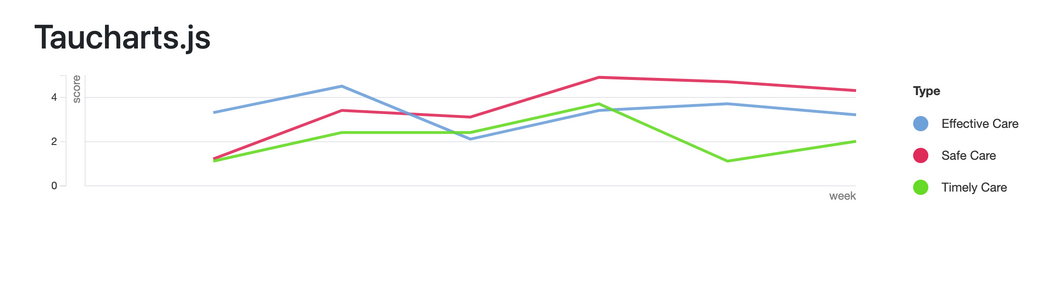
Taucharts (D3.js)
11- Supported chart types: line, bar, pie, scatter plot
- Licence terms: Free and Open Source (Apache 2.0)
- Available documentation: 2/5
- Community support & popularity: 5/5 (82,720 results - D3.js)
- Chart customisation support: 3/5
- Additional features: 4/5
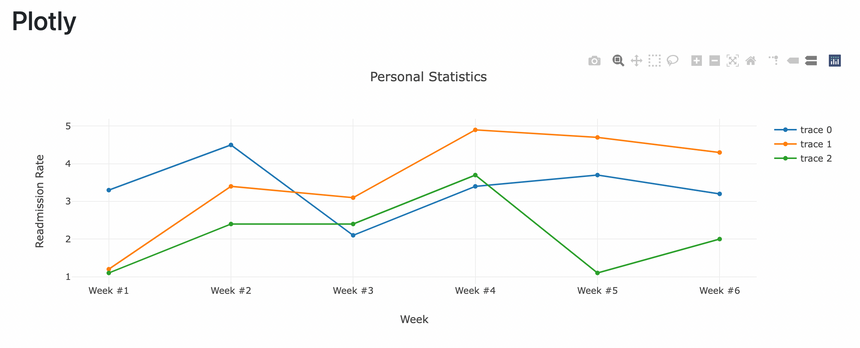
Plotly.js
12- Supported chart types: line, bar, pie, scatter plot, 3D charts
- Licence terms: Free and Open Source (MIT)
- Available documentation: 4/5
- Community support & popularity: 4/5 (18,000 results)
- Chart customisation support: 4/5
- Additional features: 3/5.
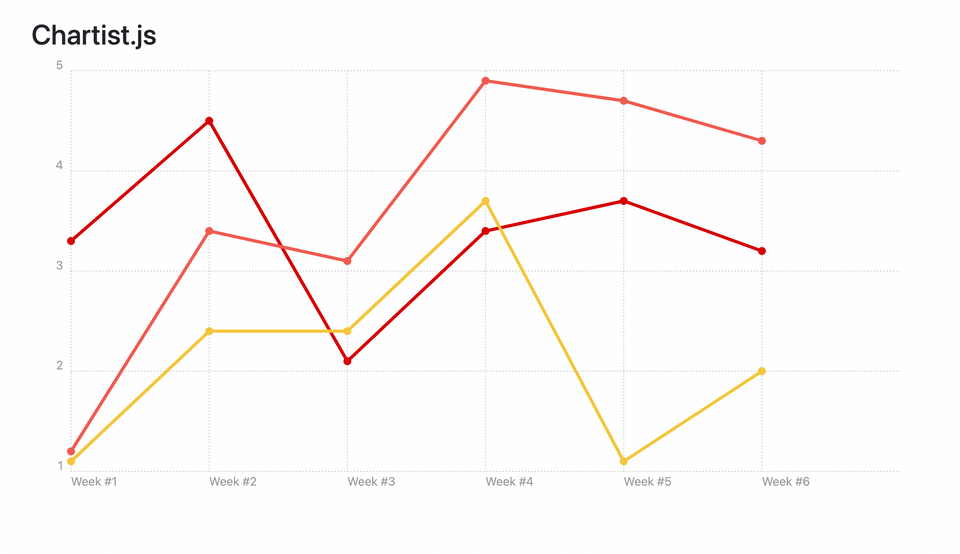
Chartist
13- Supported chart types: line, bar, pie
- Licence terms: Free and Open Source (MIT)
- Available documentation: 2/5
- Community support & popularity: 2/5 (593 results)
- Chart customisation support: 3/5
- Additional features: 2/5
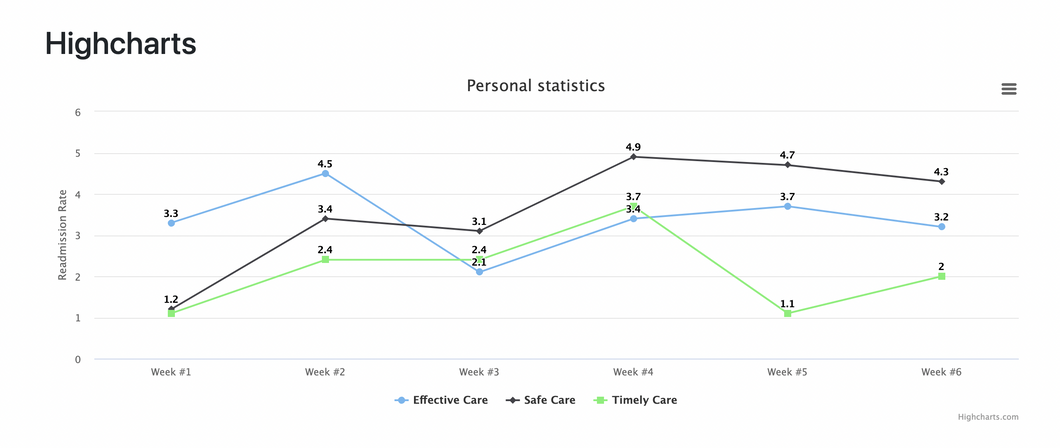
Highcharts
14- Supported chart types: line, bar, pie, scatter plot, 3D charts, maps, heatmap
- Licence terms: Paid commercial license ($300 per annum)
- Available documentation: 4/5
- Community support & popularity: 4/5 (25,041 results)
- Chart customisation support: 4/5
- Additional features: 4/5
Conclusion
Statistics in the original system were visualised using Chart.js, this free and open source library offers a variety of customisable visualisations, plenty of documentation and examples and a solid community support. As a result, we have decided to confirm this choice for the current system.
References
- [1] "Care Quality Dashboard." IXN Group 20, 2020/21, [Online] Available: https://students.cs.ucl.ac.uk/2020/group20/. [Accessed: January 27, 2023]
- [2] "Care Quality Dashboard - Code Repository" Github [Online] Available: https://github.com/UCLComputerScience/COMP0016_2020_21_Team20. [Accessed: January 27, 2023]
- [3] S. Basta, "User-centered design in healthcare: A practical guide" Journal of Healthcare Information Management, vol. 22, no. 2, pp. 8-13, 2008.
- [4] A. Kushniruk, E. Borycki, and S. Brender, "Clinical User-Experience Evaluation (CUE) - A Technique for Assessing the User Experience of Clinical Software" Stud Health Technol Inform, vol. 107, no. Pt 2, pp. 872-876, 2004.
- [5] Bock, Alexander & Frank, Ulrich. "Low-Code Platform. Business & Information Systems Engineering.", 2021.
- [6] Retool.com. [Online]. Available: https://retool.com/. [Accessed: Mar. 19, 2023].
- [7] Microsoft Power Apps [Online]. Available: https://powerapps.microsoft.com/en-gb/. [Accessed: Mar. 19, 2023].
- [8] Softr.io. [Online]. Available: https://www.softr.io/. [Accessed: Mar. 19, 2023].
- [9] Airtable.com. [Online]. Available: https://www.airtable.com/. [Accessed: Mar. 19, 2023].
- [10] "Chart.js: Simple, clean and engaging charts for designers and developers." Chart.js, [Online]. Available: https://www.chartjs.org/. [Accessed: December 18, 2022].
- [11] "TauCharts - D3 based data-focused charting library." Taucharts, [Online]. Available: https://taucharts.com/. [Accessed: December 18, 2022].
- [12] "Chartist - Simple responsive charts." Chartist, [Online]. Available: https://gionkunz.github.io/chartist-js/. [Accessed: December 18, 2022].
- [13] "Plotly.js | Javascript Graphing Library | Plotly" Plotly, [Online]. Available: https://plotly.com/javascript/. [Accessed: December 18, 2022].
- [14] "Highcharts: Interactive JavaScript charts for your web pages" Highcharts, [Online]. Available: https://www.highcharts.com/. [Accessed: December 18, 2022].