Technical Overview
Our project uses Python as its primary programming language, implementing a comprehensive pipeline for pedestrian crossing detection in satellite imagery.
Development Process
Implementation Approach
Our implementation followed a structured development process, from initial research to deployment, ensuring a robust and accurate pedestrian crossing detection system.
We adopted an iterative and modular development methodology, dividing the complex task of pedestrian crossing detection into discrete, manageable components. Each module was designed with clear interfaces, allowing for independent development and testing while maintaining compatibility with the overall system architecture. This approach enabled us to experiment with different algorithms and techniques for each stage, evaluating their performance before integration.
Throughout development, we prioritized both technical excellence and practical usability, balancing computational efficiency with detection accuracy. We consistently evaluated our progress against real-world scenarios and requirements from potential users, ensuring the final system would deliver meaningful value in accessibility applications. This user-centered focus guided our technical decisions and implementation priorities.
1. Solution Design
We began with extensive research to identify optimal approaches to pedestrian crossing detection.
- Reviewed similar computer vision solutions
- Analyzed research papers on object detection in satellite imagery
- Evaluated potential architectures and their trade-offs
- Designed multi-stage pipeline for efficient processing
2. Data Collection
Finding no existing OBB dataset for zebra crossings, we developed our own data collection process.
- Used OpenStreetMap to identify crossing locations
- Retrieved satellite imagery via Google Maps API
- Manually labeled crossings with oriented bounding boxes
- Created a comprehensive dataset of 4,000+ annotated images
3. Model Training
Implemented and trained two complementary models to balance speed and accuracy.
- Trained classification models (VGG16, ResNet50, MobileNetV3)
- Implemented YOLO OBB for precise localization
- Compared model performance across metrics
- Selected optimal architectures for production pipeline
4. Pipeline Development
Created an end-to-end processing pipeline integrating all components.
- Designed efficient workflow from input to output
- Integrated classification and YOLO detection stages
- Implemented duplicate detection and filtering
5. API & Frontend Development
Created web interface and API for online processing and visualization.
- Developed RESTful API for remote processing
- Built interactive web frontend for demonstration
- Implemented asynchronous task processing
- Created visualization tools for detection results
6. Testing & Validation
Conducted comprehensive testing to ensure robust performance.
- Performed end-to-end system testing
- Validated results across diverse geographic regions
- Measured performance metrics on test datasets
- Collected user feedback for continuous improvement
1. Solution Design
Research & Architecture Planning
Before any implementation work began, we conducted extensive research to define an optimal approach for pedestrian crossing detection in satellite imagery. This critical planning phase laid the foundation for all subsequent development, ensuring the system would meet both technical requirements and practical user needs.
Our solution design involved comparative analysis of existing techniques, evaluation of potential architectures, and careful consideration of the unique challenges posed by zebra crossing detection from aerial views.
Literature Review & Technical Analysis
We evaluated existing approaches to object detection in satellite imagery and crosswalk detection systems.
Research Focus Areas:
- We reviewed over 20 academic papers on satellite image analysis
- Selected the most relevant papers to our topic
- Filtered out papers with any redundancy
- Compared the methods used in each of the remaining papers
- More detail is discussed in the research section
Architecture Design Decisions
Based on our research, we made key architectural decisions that would guide implementation.
Key Design Choices:
- Two-stage detection approach with classifier model and oriented bounding box model
- Leverages faster speed of the classifier model and higher precision of the detection model
- Ensures crosswalks within the image are not cut off due to the segmentation of our chunks
Implementation Planning
After establishing our architectural approach, we created a detailed implementation plan that included:
Technical Roadmap:
- Development workflow and milestone definitions
- Data collection and annotation strategy
- Model training and evaluation methodology
- Processing pipeline architecture specifications
Performance Targets:
- Minimum accuracy threshold: 90% mAP
- Processing speed objectives for production use
- Model size constraints for deployment flexibility
- Error tolerance limits for geospatial accuracy
2. Dataset Creation
Dataset Overview
The largest bottleneck to the development of our system was the lack of raw data to train on, so the first step of our implementation process was to create a dataset ourselves. We used public services to extract over 4000 raw images of crossings, then annotated each one ourselves. We manually labelled each one with bounding boxes around crossings using YOLO-OBB visualised labelling tools. As of March 2025, we have one of the most extensive open-source collections of bounding box annotated crossings.
OSM is a crowdsourced, open map database that encompasses the world. It is maintained by active volunteers and marks the location of various things such as parks, houses, railways etc.
Our Usage:
- Gather the location of crossings
- Extract coordinates to generate our dataset
- Create a comprehensive collection of crossing locations
Google Static Tiles API
A geospatial mapping and navigation platform that provides interactive maps, geolocation services, routing, and real-time data.
Our Usage:
- Download images at locations determined using OSM
- Obtain high-resolution satellite imagery
- Create raw data for labeling and annotation
3. Pipeline Implementation
End-to-End Processing Pipeline
Our automated detection pipeline processes input imagery through six sequential stages to identify and localize target features with precision. The workflow begins with dynamic image segmentation, followed by deep learning-based classification to identify regions of interest within the image. These regions then undergo oriented bounding box (OBB) detection, with each identified crosswalk precisely georeferenced to real-world coordinates. The pipeline then intellligently filters the results, removing duplicate detections while maintaining accurate crossings. Finally, outputs are generated in multiple formats - simple text files for easy review and structured JSON for programmatic use. Complete technical specifications are provided in the following sections, with additional algorithmic details available on the dedicated algorithm page.
Image Segmentation
Our image segmentation pipeline uses PIL (Python Imaging Library) to handle input images, as it provides straightforward access to an image's original width and height, while enabling precise cropping operations for both classification and bounding box segmentation. PIL also allows an efficient conversion to tensor format for our MobileNet models through torchvision, while also supporting direct input to YOLO models without unnecessary conversions.
We use PIL to generate two types of image crops: 256×256 windows for MobileNet classification and 1024×1024 windows for YOLO-based OBB detection. For GeoTIFF inputs, we rely on GDAL (Geospatial Data Abstraction Library) because it allows us to efficiently extract metadata and handle raster data in memory, which is especially useful for georeferencing (explained in the georeferencing section). Additionally, GDAL's memory-mapping feature (using format="MEM") enables us to create 1024×1024 context windows as raster datasets without the need for disk I/O, making the process more efficient.
The system centers these 1024x1024 windows on the original "chunks of interest" (classification windows that returned positive detections) whenever possible. When near image boundaries, crops automatically shift inward to maintain the required dimensions while preserving maximum relevant content.
Classification System
Our classification system pipeline employs a deep learning approach to analyze 256x256 image segments through binary classification, identifying whether each segment contains a potential crossing.
Utilizing our trained MobileNet as our classification model, the pipeline begins when it receives images in PIL format. These images are then converted to tensor format using torchvision's preprocessing transforms. The transformed images are then passed to the model, where it then returns the probability of the image containing a crosswalk. This probability is then compared against a dynamic threshold, if the probability is greater than the set threshold, it returns True, otherwise it returns False.
This flexible thresholding enables adaptable operations as users can increase strictness to reduce false positives or decrease it to increase the sensitivity.
Oriented Bounding Box System
Our oriented bounding box pipeline processes 1024x1024 pixel context windows to detect zebra crossings, returning both the pixel coordinates of each crossing's four corners and their associated confidence scores.
It first retrieves all OBB context windows which were segmented and passed to it. If the image is a raster dataset (when processing TIF images), it is first converted to a NumPy array. From this array, it is then converted into a PIL Image, essentially converting the raster dataset to a PIL Image.
The system processes each 1024x1024 PIL image through our trained oriented YOLO model after classification and re-segmentation, passing the image along with parameters including a Boolean flag to save labelled output images, a confidence threshold to filter low-probability detections, and an IoU threshold to control bounding box suppression during Non-Maximum Suppression (NMS). The model's output provides the four corners of a bounding box through the xyxyxyxy attribute, while their associated confidence scores are accessed via the conf attribute.
This approach allows us to ensure accurate identification of zebra crossings, while also being able to maintain flexibility to adjust detection sensitivity and overlap tolerance based on application requirements. Keeping the confidence levels of each bounding box also enables further processing for each detection if needed.
Georeferencing System
Our georeferencing pipeline dynamically processes spatial metadata from source imagery to accurately localize oriented bounding box (OBB) detections in real-world coordinates.
For standard image formats (.jpg/.jpeg/.png) accompanied by .jgw world files, the system extracts British National Grid (BNG) metadata to generate new metadata for each 1024×1024 context window. It is directly extracted as a BNG format as this is the format provided by Digimap.
For GeoTIFF inputs, we leverage GDAL (Geospatial Data Abstraction Library) to meet two requirements: metadata extraction and memory-efficient raster handling. GDAL provides direct access to the geospatial metadata embedded in .tif files, enabling precise coordinate calculations. Additionally, its memory-mapping capability (format="MEM") allows us to generate 1024×1024 context windows as raster datasets without disk I/O overhead. Each window's georeferencing data is dynamically adjusted to reflect its spatial offset from the original image.
The model analyzes these context windows and outputs pixel-space coordinates for detected features, which are then precisely georeferenced using the window-specific metadata. This transformation occurs in two stages: first converting coordinates to the native reference system (BNG when working with .jgw files, or the original GeoTIFF CRS), then standardizing to WGS84 (EPSG:4326) for universal compatibility.
This system handles all coordinate system conversion through GDAL's OSR module, which manages the complete transformation workflow. It meets two of our requirements, which is being able to read a file's embedded metadata and being able to convert current CRS (Coordinate Reference System) to WGS84. When processing .jgw files, we know the metadata is in BNG, so we directly set up a transformation from BNG to WGS84. While processing GeoTIFF files, OSR first reads the source CRS from the embedded metadata, then sets a transformation between the source CRS to WGS84.
This dual-stage approach maintains geometric accuracy throughout the pipeline while accommodating diverse input formats through adaptive metadata processing.
Duplicate Filtering System
The filtering pipeline dynamically finds the potential "neighboring" classification context window radius which might generate overlapping OBB context windows. After finding the neighboring radius, it then removes all duplicates by comparing each box with all of its neighbor's box.
The filtering pipeline begins by dynamically calculating a neighboring radius to identify potential overlaps between OBB context windows, derived from the relationship between classification (256×256) and detection (1024×1024) window sizes. Using the formula math.ceil(boundBoxChunkSize / classificationChunkSize) + 1, the system accounts for edge cases where out-of-bound windows are shifted inward during segmentation, ensuring comprehensive coverage (example image below). In the case of our pipeline, the result of this formula is 5.
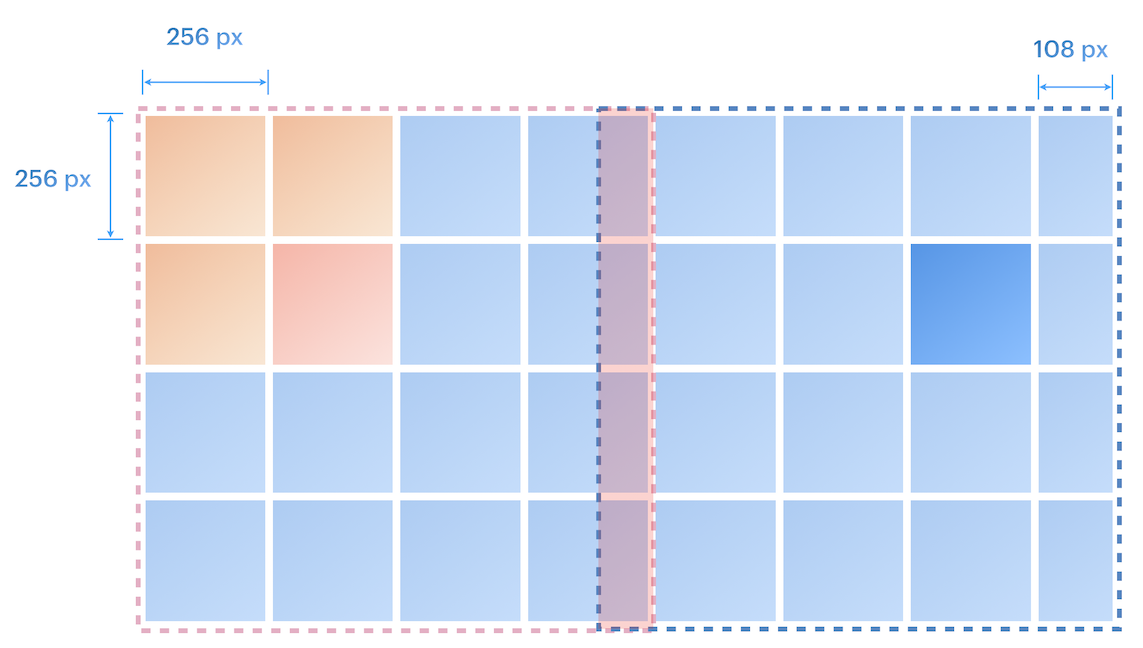
Visual representation of 1024x1024 context window overlap
Processed detections are stored in a dictionary keyed by a combination of the original filename and the generating row/column indices. For each entry, the pipeline checks neighboring keys within a ±5 row/column range—corresponding to the calculated radius—to identify potential duplicates. When neighbors are found, Non-Maximum Suppression (NMS) is applied to all bounding box pairs: overlaps exceeding the set IoU threshold trigger the removal of the lower-confidence detection.
Following duplicate removal, the pipeline restructures the detection data into a consolidated dictionary for efficient output organization. This new dictionary uses the original image's base filename as each key, with corresponding values containing all unique bounding boxes and their confidence levels detected across that image's chunks. The system builds this structure by iterating through each entry in the original dictionary - when encountering a new base filename, it creates a fresh dictionary entry with the current detections, and when processing subsequent chunks from already-registered images, it extends the existing entry with additional boxes and confidence scores.
This approach efficiently eliminates redundant detections while preserving the higher confidence results for each image, maintaining accuracy over overlapping regions.
Output Generation System
In the final output stage, the system saves the cleaned detection results in either JSON or TXT format. For JSON output, each entry contains three key components: the original image's base filename, an array of all detected bounding boxes (with each box represented by its four corner coordinates), and the corresponding confidence scores for these detections.
For TXT format output, the pipeline creates individual text files for each processed image, with a standardized line-based structure. Each detected bounding box is represented as a single line containing eight numerical values - the latitude/longitude coordinates of all four corners listed as consecutive xy pairs (e.g., x1 y1 x2 y2 x3 y3 x4 y4), followed by the confidence score at the line's end.
This approach provides flexibility, as the JSON option offers structured data, which is more ideal for future use in programs, while the TXT files present a more human-readable format.
6. API & Frontend Development
Web Interface & API Architecture
Our system includes a web-based interface and RESTful API that allows users to upload satellite imagery for processing. This provides an intuitive and beginner-friendly way to access our system without requiring technical expertise or local installation.
The API handles asynchronous processing of large images, providing real-time status updates and delivering results in standardized formats. The web interface offers intuitive visualization tools and export options for detected crossing data, making it accessible to both technical and non-technical users.
RESTful API Implementation
Our RESTful API serves as the bridge between the frontend interface and the detection system, enabling seamless integration and interaction.
Key Features:
- Comprehensive Endpoints: Well-defined endpoints for image upload, processing status tracking, and result retrieval
- Authentication: Token-based authentication and rate limiting mechanisms for secure access control
- Asynchronous Processing: Task queue implementation for handling long-running operations without blocking
- Error Handling: Standardized error handling and response formats for consistent client experiences
- Documentation: Comprehensive API documentation through Swagger/OpenAPI specifications
Web Frontend
Our interactive web interface provides intuitive visualization tools and user-friendly controls for the detection system.
Technologies & Features:
- Modern Framework: Built using React for a responsive and dynamic user experience
- Real-time Updates: Live processing status indicators with progress tracking
- Interactive Visualization: Advanced visualization tools for comparing detections with original imagery
- Export Options: Multiple data export formats including JSON and TXT with comprehensive metadata
- User-friendly Interface: Intuitive controls for uploading, processing, and managing satellite imagery
Server Implementation
Our backend implements a Flask-based REST API with robust background task processing, offering a reliable and scalable architecture for handling detection requests even under heavy load conditions.
Core Technologies:
- Flask: Lightweight yet powerful web framework for API endpoints
- Threading & Queue: Asynchronous processing with prioritized job scheduling
- Resource Management: Intelligent system resource monitoring and allocation
- Security: Comprehensive validation, sanitization, and authentication systems
API Architecture:
- RESTful Design: Clear separation of concerns with standardized endpoints
- Token-based Authentication: Secure access control for all operations
- Background Processing: Non-blocking execution of computationally intensive tasks
- Robust Error Handling: Graceful recovery from exceptions with informative responses
Task Management:
The server implements a sophisticated task queue system that handles concurrent processing requests, prioritizes jobs based on resource availability, and provides real-time status updates to clients. This architecture ensures optimal resource utilization while maintaining responsiveness even during peak usage periods.
Export Formats
We provide standardized export formats that balance human readability with machine processability, making our detection results easy to integrate with downstream applications.
Available Export Formats:
JSON Format:
- Structured data format with source image reference
- Comprehensive metadata including confidence scores
- Precise coordinates for each detected crossing
- Easily parseable by most programming languages
Plain Text Format:
- Human-readable coordinate listings
- Simple delimited format for easy parsing
- Compatible with GIS and mapping applications
- Minimal overhead for efficient storage
All exports are provided in compressed zip archives for convenience, with directory structures that maintain the relationship between source imagery and detection results for easy reference.
7. Testing & Validation
Comprehensive Testing Approach
Our testing strategy encompassed multiple levels of validation to ensure system reliability and accuracy across diverse scenarios. We implemented a combination of automated testing, systematic evaluation, and real-world validation to guarantee consistent performance in production environments.
The testing methodology followed industry best practices for machine learning systems, with particular attention to the challenges of geospatial data processing. By testing each component independently and then as an integrated system, we were able to identify and address potential issues at every stage of the detection pipeline.
Testing Framework:
Component Testing:
- Unit tests for core functions
- Integration tests between modules
- API endpoint validation
Model Evaluation:
- Performance metrics validation
- Training stability assessment
- Robustness to edge cases
System Validation:
- End-to-end workflow testing
- Cross-platform compatibility
- Resource utilization monitoring
Model Performance Evaluation
We conducted rigorous quantitative evaluation of our detection models across diverse test datasets to ensure reliable performance in varied scenarios.
Evaluation Methodology:
- Holdout Validation: 5% of dataset reserved for final performance assessment
- K-fold Cross-validation: Used during development to prevent overfitting
- Precision-Recall Analysis: Comprehensive evaluation at multiple thresholds
Key Performance Metrics:
- Classification Model: 95% accuracy, 0.93 F1-score on holdout data
- OBB Detection: 0.89 mAP@0.5 (mean Average Precision at 0.5 IoU)
- Geographic Precision: <2m average positional error in real-world coordinates
These quantitative results validate that our system meets the performance requirements for reliable pedestrian crossing detection in satellite imagery.
Real-World Testing
Beyond quantitative metrics, we validated our system through extensive real-world testing across diverse geographic regions and imagery sources.
Testing Dimensions:
- Geographic Diversity: Validation across multiple countries/regions with different crossing styles
- Imagery Variation: Testing with different satellite providers, resolutions, and lighting conditions
- Edge Cases: Validation with challenging scenarios like partial occlusion and unusual orientations
System Performance:
- Processing Speed: 4000x4000 image processed in approximately 30-60 seconds depending on hardware and image
- Scalability: Linear scaling with multi-threaded processing on multi-core systems
- Resource Efficiency: Optimized for standard hardware with 8GB+ RAM
This comprehensive real-world testing confirms that our system is not only accurate but also practical and reliable for production use across a wide range of scenarios.