Partner Introduction
Key organizations collaborating with SightLinks to improve accessibility
Soundscape Community
A leading innovator in accessibility solutions and a key user of our dataset, leveraging technology to enable visually impaired individual's traversal of an outside environment.

Wheelchair Alliance
A community-driven organization that provides invaluable insights into accessibility needs and user requirements, ensuring real-world impact.

GDI Hub
UCL's research and practice center specializing in disability innovation, assistive technology, and inclusive design. They offer expert insights into user needs and accessibility challenges.

UCL Computer Science
The Computer Science department at UCL, dedicated to advancing and expanding our program through continued development and innovation, as well as mentorship from the senior leadership team.
Project Background
Understanding the accessibility challenges in current navigation systems
Current Accessibility Landscape
Current navigation systems lack comprehensive accessibility data, creating significant challenges for the deployment of assistive navigation solutions for wheelchair users or visually impaired individuals. This is especially the case for rural environments where the transport network information is even more limited. For many people with disabilities, this lack of information creates significant barriers to independent mobility, often limiting access to essential services, employment opportunities, and social participation. As a result, people with sensory or physical disabilities have a 370% higher rate of depression than members of the general public. [1]
Current Challenges
- Limited accessibility data exists for current mapping solutions, holding back wide-scale deployment of assistive technologies that could significantly impact the standard of living of many disabled individuals living alone.
- Manual data collection is time-consuming and expensive process that requires training a large population of volunteers or paid works to use digital annotation tools. Without a systematic approach for each town and region's unique layout and road network - which is not complete in many locations - the data collected is often incomplete. The data also becomes outdated after a few years, requiring the same complex process again.
Opportunity
- There is an abundance of available image data that covers the entire globe multiple times, satellite imagery. By analysing information from satellite imagery, we can scale our system to every corner of the world - without requiring any localised efforts.
- Leveraging computer vision, we can use satellite imagery for automated transport feature extraction. By integrating the data we collect into mapping applications, such as those developed by our partners at team 14, we can make this information immediately and easily usable for people with a diverse spectrum of conditions that make travel potentially dangerous, to help them stay safe.
Our Approach
While human assistance is valuable, it is inherently limited in availability and adaptability. Sightlinks aims to bridge this gap through AI-driven solutions. By leveraging AI, we can offer consistent, scalable, and adaptable assistance that is not constrained by human availability. Our goal is to make independent navigation as seamless for impaired individuals as it is for the average person.
Project Goals
The primary goal of SightLinks is to develop an AI-powered system to automatically detect and classify accessibility features from satellite imagery
Primary Goal
Develop an AI-powered system to automatically detect and classify accessibility features (especially zebra-crossings) from satellite imagery, that is scalable and open source. While human assistance is valuable, it is inherently limited in availability and adaptability. SightLinks aims to bridge this gap through AI-driven solutions. By leveraging AI, we can offer consistent, scalable, and adaptable assistance that is not constrained by human availability. Our goal is to make independent navigation as seamless for disabled individuals as it is for members of the general public.
Technical Objectives
- Create a scalable and maintainable system architecture, by allowing future developers to change the models used, and providing an automatic data annotation tool for training
- Implement a robust feature detection algorithm
- Ensure accurate georeferencing of detected features
- Develop an API system that enables seamless integration with third-party navigation applications and provides well-documented endpoints for developers
User Personas
Understanding the key stakeholders who will benefit from SightLinks

Joe Goodman
Visually Impaired User
"I need to know where safe crossings are located to navigate confidently"
Motivations
- Independent navigation of urban environments
- Safely crossing streets with traffic
- Finding accessible routes for daily activities
- Maintaining personal autonomy
Pain points
- Cannot cross roads freely without designated crosswalks
- Navigation apps with missing or incorrect accessibility information
- Difficulty finding properly mapped crosswalks
- Risk of dangerous traffic situations

Emily Carter
Wheelchair User
Accessibility Advocate
"I need reliable information about accessible crossings with proper curb ramps"
Motivations
- Finding routes with accessible crosswalks and ramps
- Planning journeys confidently with reliable data
- Traveling independently without assistance
- Advocating for better accessibility information
Pain points
- Missing or unusable crosswalks in navigation apps
- Routes suggested without considering wheelchair accessibility
- Limited access to accessibility information
- Need for curb ramps at crossings

Elijah Chen
Software Engineer
Navigation API Developer
"I need standardized data formats that I can easily integrate"
Motivations
- Building accessible navigation solutions
- Integrating reliable accessibility data
- Creating scalable and maintainable systems
- Delivering accurate user experiences
Pain points
- Inconsistent data formats across sources
- Limited access to quality accessibility datasets
- Difficulty validating accuracy of external data
- Time-consuming data processing workflows

Noah Johnson
Full-Stack Developer
Accessibility Specialist
"I need well-documented APIs that prioritize user needs"
Motivations
- Creating intuitive user interfaces
- Implementing accessible design principles
- Connecting to reliable data sources
- Designing for diverse user abilities
Pain points
- Poorly documented data sources
- Limited accessibility information
- Complex integration requirements
- Need for extensive local setup for data access
User Personas & Research Findings
Understanding accessibility challenges through systematic user research
Research Methodology
To gain deeper insight into the difficulties faced by wheelchair users and visually impaired individuals, we conducted a survey with 20 individuals as well as interviewing two of them about their daily issues with traveling in an informal unrecorded discussion, as per their request. Our research questioning included both users with accessibility needs and developers who would implement solutions, to gain a clear perspective on the type of data that would be most useful to identify, as well as the set of features that would be most useful when interfacing with the data retrieval software.
Our survey questions for accessible transport experience for disabled individuals were determined based on our original project description, which was focused on a voice interface for mapping applications. This project was changed due to changes in our industry partner; however the relevance of the responses remains for our current project.
To ensure compliance with data protection regulations, the data corresponding to each patient was anonymised during the survey process and identifying characteristics such as age and gender were recorded as a statistic and not assigned to particular participants. Each participant was asked if they were comfortable with their responses being used in our study after anonymisation, with all participants giving consent. The distribution of ages, genders and roles are displayed below, collected to identify potential sources of bias, as well as the survey questions used.
Participant Demographics
Sample Composition
Gender Distribution
Participant Categories
Developer Survey Questions
| Question Number | Question Regarding | Question |
|---|---|---|
| 1 | Data Required | What specific types of accessibility data are most critical for your mapping platform? Please describe the most important information about mobility obstacles or enablers. |
| 2 | Current Methods of collection | What are the current methods you use to collect accessibility information? Please describe the primary issues you face collecting verified, reliable data. |
| 3 | Detail Required | What is the degree of detail required for accessibility data to be used in your system? Specify the most important levels of detail you need, such as precision, spatial features such as orientation, and so forth. |
| 4 | Compatibility and format requirements | What existing mapping or transportation platforms or data standards do you need your accessibility data to be compatible with? |
User Survey Questions
| Question Number | Question Regarding | Question |
|---|---|---|
| 1 | Personal mobility challenges | How does your specific disability characteristics impact your ability to navigate public and private transportation systems? Please describe the primary physical, sensory, or cognitive barriers you experience when traveling. |
| 2 | Digital Navigation Support | How helpful are current real-time accessibility mapping, route planning applications, and digital guides that highlight wheelchair-friendly paths, accessible entrances, and potential obstacles? Please describe the utility that they provide for your travel, and the primary issues that you face during use? |
| 3 | Transportation Features | Please describe the transport elements that most significantly facilitate or hinder your mobility, such as sidewalk width, crossing locations, and other features that impact your ability to travel comfortably and safety. |
| 4 | Impact on well-being | In what ways do current accessible support systems either support or limit your sense of personal autonomy and independent movement? Please describe the impact that it has on your mental health and well-being. |
| 5 | Desired Future Features | What method would be most convenient to interface with this information during travel? Please describe the most comfortable and natural way for you personally. |
Research Survey
As mentioned previously, we conducted in-depth questioning with individuals who have mobility and visual impairments to understand their daily travelling challenges, as well as developers who would be implementing accessibility solutions in the Geographic field. Their perspectives provide essential insights into both user needs and technical requirements, and some responses that particularly influenced our direction of developement are included below. The following names are not the actual names of the participants but rather those of our personas, for privacy purposes, and all of the responses shown below were allowed to be made public by the respective respondent.
"When planning a route using maps, I often find the indicated crosswalk is either missing or really far off the original target. Zebra-crossings are really key to my travel, because I find it quite tough to jump the pavement without their curb-ramps.
"I can't cross roads freely, because I can't trust people in London to just stop for me when I step on the road. Because of that, it's really crucial to me that the crosswalks between me and wherever I want to go are available, because then I can cross without worrying about the cars."
"I suggest using a standardized format like JSON, including crosswalk coordinates and confidence scores. That'd let the developers filter the data however they need based on their confidence or whatever other data attributes there are."
"Accessing data via a website or API would be significantly more convenient than running the code locally. However, if local execution was necessary, a well-documented README or user guide would be essential for building anything with your program."
Personal Experience for Research
We also gained valuable insight through a visit to GDIHub, where we borrowed a wheelchair to experience the challenges faced by wheelchair users firsthand. We traveled around Stratford, remaining close to UCL East, and soon realized that many safety and quality-of-life issues had never crossed our minds before. For instance, even small curbs of just 2–3 cm were enough to bring the wheelchair to a complete stop, highlighting the importance of ramps for accessibility. We discovered that crossing the street largely depends on curb cutouts, commonly found at zebra crossings, making these essential for anyone who uses a wheelchair. This experience significantly shaped our understanding of the types of information that can truly benefit individuals with mobility or visual impairments.
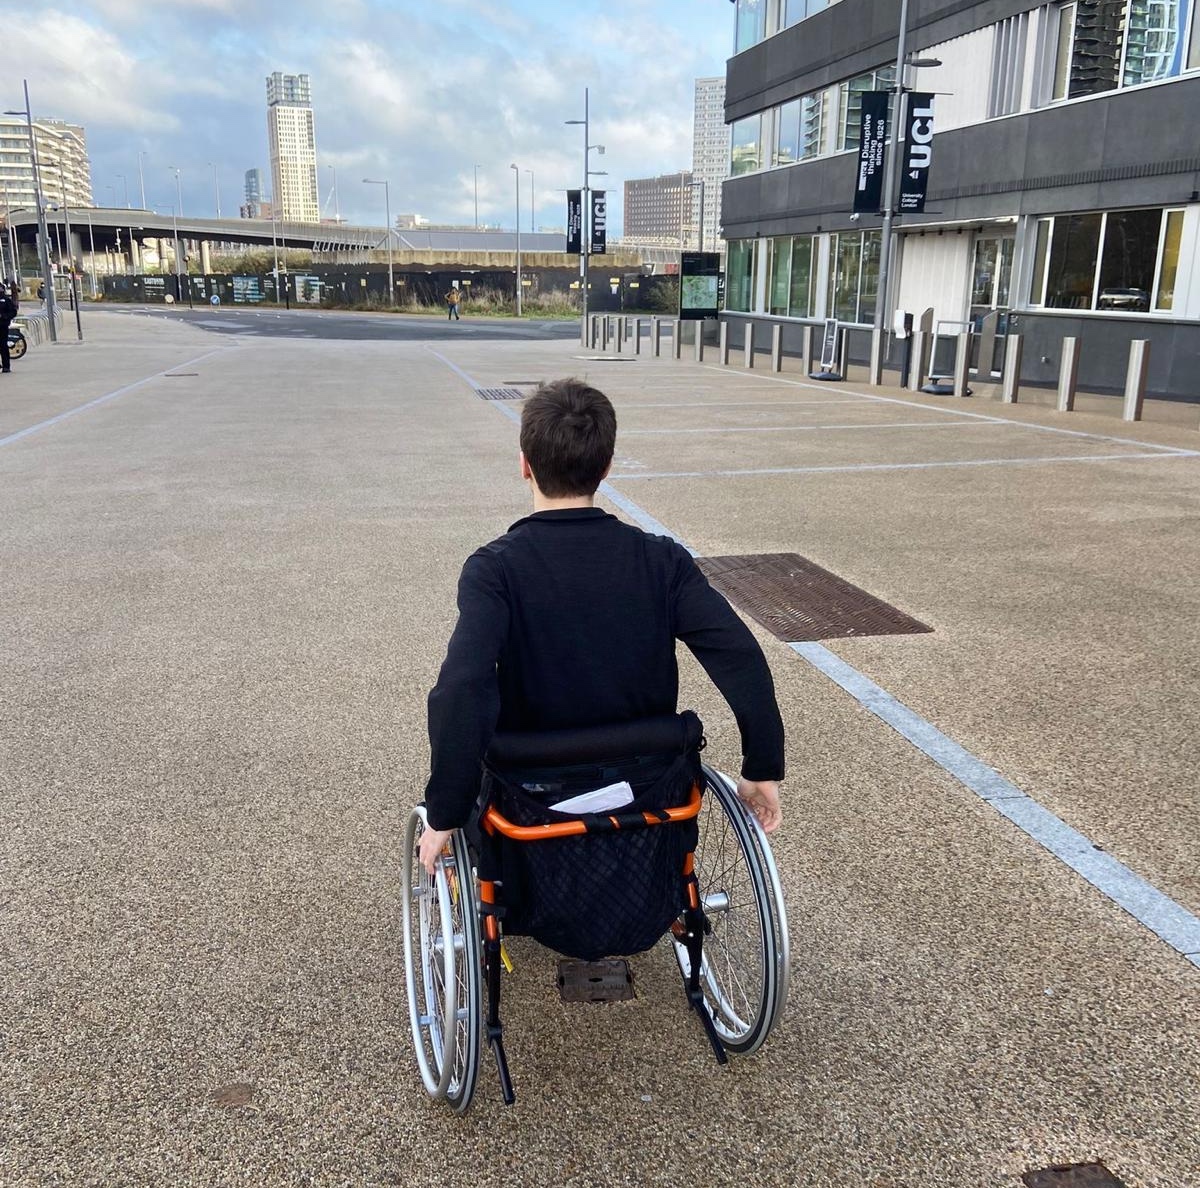
Kostas using the wheelchair from GDIHub
Key Findings
We provide a summary of the relevant responses below, with individual's lists of responses not being made public for conciseness and privacy purposes:
Through this research, we discovered that navigation represents one of the most significant daily challenges for people with disabilities. The lack of reliable information about crosswalks and other accessibility features creates substantial barriers to independent mobility.
Participants emphasized that inconsistent information about accessibility features creates anxiety and often necessitates extensive pre-planning before journeys. Many reported abandoning trips entirely when uncertain about the accessibility of their destination or route.
For visually impaired users, knowing the precise location of crosswalks is crucial for safety, while wheelchair users require information about both crosswalks and associated ramps. This revealed an urgent need for standardized, reliable data about pedestrian crossings and other accessibility infrastructure.
MoSCoW Requirements
Project requirements prioritized using the MoSCoW method for development
Must Have
Critical requirements for project success
- Pedestrian Crossing Recognition: Our system must be able to identify a crosswalk's location within a satellite image with sufficient precision to assign it to a What3Words tile, i.e. with a minimum precision of 3 meters.
- Standard Output Format: The output of our model must be a standardised output format which can be easily and immediately integrated into other systems by developers.
- Georeferencing System: Develop a geo-referincing system that converts pixe coordinates corresponding to identified crosswalks locations must be extracted from the satellite data, to obtain precise geographical coordinates (latitude/longitude).
Should Have
Important features that provide significant value
- Performance Optimisation Methods: Limited computational resources and financial resources mean that the faster and cheaper our system runs, the more area we can cover, and the larger the userbase available to us.
- Multi-format Input Support: Process various aerial/satellite data formats like .tif files and .jgw files along with their corresponding images, for the ease of application of our system to current high-resolution datasets.
- Platform Integration: Compatibility with Group 14's platform and interface provision, to be able to effectively transmit data to visually impaired users.
Could Have
Desirable features if time and resources permit
- Maximum Reliability: Prioritize model reliability over coverage completeness and safety over optimization, by adjusting various confidence hyperparameters in our predictions.
- Output Filtering: By filtering and processing the output data from our machine learning models, we would improve the reliability of the dataset by removing noise, duplicates and low quality predictions.
- GUI/WebApp: User-friendly interface with drag-and-drop features, to allow non-technical users to easily use our system.
- Extended Recognition: Additional feature detection like ramps and pellican crossings.
Won't Have
Features out of scope for current implementation
- Indoor mapping: Due to the nature of our solution of taking aerial images, this is currently not feasible despite it being a common concern.
- Hazard Detection: Due to resolution limitation in current datasets, hazards such as potholes would not be recognisable in our dataset.
- Live updates: Analysis limited to historical data and user inputs, as current satellites with regularly updating datasets have only low resolutions available.
- Speech interface: Natural language processing system is no longer necessary as we are not developing the interface for the data anymore, and this is shelved for future developments by team 14.
Use Cases
The SightLinks project aims to enhance navigation for individuals with visual and mobility impairments. Rather than directly assisting users, SightLinks empowers organizations, developers, and stakeholders to create more accurate and reliable navigation systems while significantly reducing manual effort and development time.
Generating Accessibility Data
Users: Developers, GIS specialists, and navigation platform teams
Goal: Provide accurate accessibility data for integration into mapping and navigation solutions.
Description:
Developers and organizations working on navigation applications can upload georeferenced images of specific geographic areas into our system. SightLinks will process these images to identify and extract accessibility features—such as crosswalks—and generate structured datasets. These datasets can then be integrated into their own mapping systems, improving accessibility for individuals with impairments.
Data Validation and Quality Assurance
Users: Data reviewers and accessibility researchers
Goal: Ensure the accuracy and completeness of accessibility data.
Description:
Organizations and data reviewers can use SightLinks to compare newly generated datasets with their existing accessibility data, and investigate the discrepancies between the two. This allows them to verify accuracy, identify missing or outdated information, and update their records accordingly. By continuously refining their datasets, they can maintain the reliability of their navigation and accessibility services.
Open-Source Accessibility Dataset
Users: Open-source contributors, accessibility advocates, and research institutions
Goal: Expand and improve accessibility datasets through collaborative contributions.
Description:
By making the generated data and our system publicly available, SightLinks enables the open-source community to validate, refine, and extend accessibility datasets. Contributors can improve model accuracy, expand coverage to new regions, and enhance training data. This collaborative approach allows for global accessibility improvements, ensuring the dataset evolves to meet diverse needs.
Accessibility Analysis for Urban Planning
Users: Urban planners, city officials, and accessibility policy makers
Goal: Identify areas with insufficient accessibility infrastructure to guide improvement initiatives.
Description:
City planners and policy makers can utilize SightLinks to analyze the distribution and density of accessibility features across urban areas. By identifying neighborhoods or districts with inadequate crosswalk coverage, they can prioritize infrastructure investments and development projects to address accessibility gaps. This data-driven approach enables more efficient allocation of resources and helps create more inclusive urban environments for all residents and visitors.