
Requirements and Goals
A Brief Introduction
For our final proof of concept in term two, identifying the key, finalised requirements involved a series of steps. Just before the start of the second term, the team gathered in order to pool together ideas and research carried out in term one. From this, we produced two documents which were subsequently sent to our client(s) at Orange Labs. A meeting at their office to go over these and our prototype from term one involving the use of Bluetooth to connect sensor hardware to computer, a MySQL Azure database and Analytics in JAVA was then scheduled for 20th January.
The two aforementioned draft documents can be downloaded below:
From these two documents and the feedback received from our client(s) during the meeting on 20th January which can be downloaded here, final requirements and project goals were derived.
General requirements and goals we aim to meet for this project include:
Note: A more detailed list can be found under Specification below.
| ID | Requirement |
|---|---|
| 1 | The system must have a plug & play architecture in order to enable swift and flexible adding of new sensor hardware to the network |
| 2 | The system must have a scalable infrastructure given the vast and growing amount of data it will be required to support long-term |
| 3 | The system, through its platform, must enable the meshing of sensor data and support a variety of different types of sensor data |
| 4 | There must be a set of APIs through which the database(s) can be accessed |
| 5 | Sensor data from the system should be made publicly available and be easy-to-aggregate together |
| 6 | All sensor data should also be presented in a uniform, standardised and clear format |
| 7 | There must be two different Web-based applications 'GUIs', the first being a sensor management portal and the second being an smart parking app |
| 8 | Basic analytics must be carried out for the smart parking application |
| 9 | Accuracy of hardware in vehicle detection should be prioritised over low costs |
| 10 | The hardware must include a central module "zone controller" and sensor unit(s) |
| 11 | The system must have a degree of authentication present in order to prevent abuse |
Specification and Design
Functional Specification
Provided below is a more in-depth look into the scope of our project divided by category:
| ID | Category | Requirement |
|---|---|---|
| 1 | System Website | Users should be able to indicate sensor position on an interactive Google map |
| 2 | System Website | Users must be able to add new sensors to the network via this platform easily |
| 3 | System Website | The adding of new sensors should be a swift and easy-to-complete process |
| 4 | System Website | Some degree of authentication must be required for security purposes when adding new sensor hardware to the network |
| 5 | System Website | The platform should be responsive designed, owing to users on the move in the environment to set up sensors |
| 6 | System Website | The platform should notify users when their sensors have potentially broken down i.e. via the lack of an update over a set interval of time |
| 7 | System Website | The platform should be easy to navigate, there must be clarity in content present |
| 8 | System Website | Users should be able to easily manage their own set of sensors on the portal page |
| 9 | System Website | The design of the websites' pages must not affect its overall usability negatively |
| 10 | System Website | Users must be able to sign up to the platform |
| 11 | Usecase Hardware | Must be able to transmit data wirelessly via UDP. |
| 12 | Usecase Hardware | For the use case of illegal parking, must be able to accurately tell if a bay is occupied or not |
| 13 | Usecase Hardware | While accuracy should be prioritised, hardware should ideally be low-powered |
| 14 | Usecase Hardware | Hardware should be low fixed cost and low maintenance cost |
| 15 | Usecase Hardware | Code should allow for easy modification of sensor identifier. |
| 16 | Usecase Hardware | Hardware should allow for easy reconfiguration as sensors are moved around. |
| 17 | Usecase Hardware | Hardware should be robust so that physical maintenance is kept at a minimum. |
| 18 | Parking Application | Must have a graphical overlay in order to communicate information like bay occupancy visually to users |
| 19 | Parking Application | Should be able to tell whether a bay has been illegally occupied |
| 20 | Parking Application | Should include additional parking data for instance time restrictions placed upon bays |
| 21 | Parking Application | Should automatically update a bay's occupancy along with its associated information |
| 22 | Parking Application | All and any features should be easily noticeable |
| 23 | Analytics | Basic analytics must calculate bay occupancy |
| 24 | Analytics | Whether a bay is legally or illegally occupied must also be calculated |
High-level System Design
As an overview, this graphic illustrates the high-level interpretation of our system design. The sensors in the environment will send their data as UDP packets to the main server. The main server has a web front-end, and handles processing and storing the data. Two APIs can then be used to access the data, allowing developers to apply it to external applications.
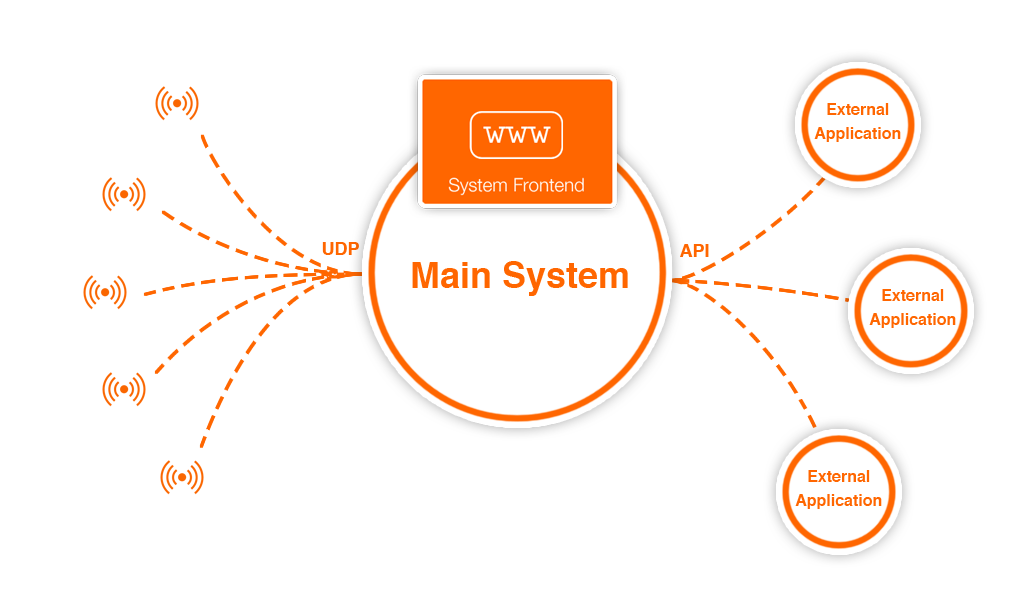
A high-level overview of the system design as a whole.
Implementation
Implementing the System
The 'system' comprises everything to do with receiving and storing data from sensors on the network. Through the system, users can register sensors by giving information like their exact coordinates and what they measure. On a website end, they can manage their sensors and download the APIs. In the background, we have Java software running, listening to a specific port and waiting to receive packets. Each packet is validated, then inserted into the main readings database, ready to be accessed via one of our APIs.
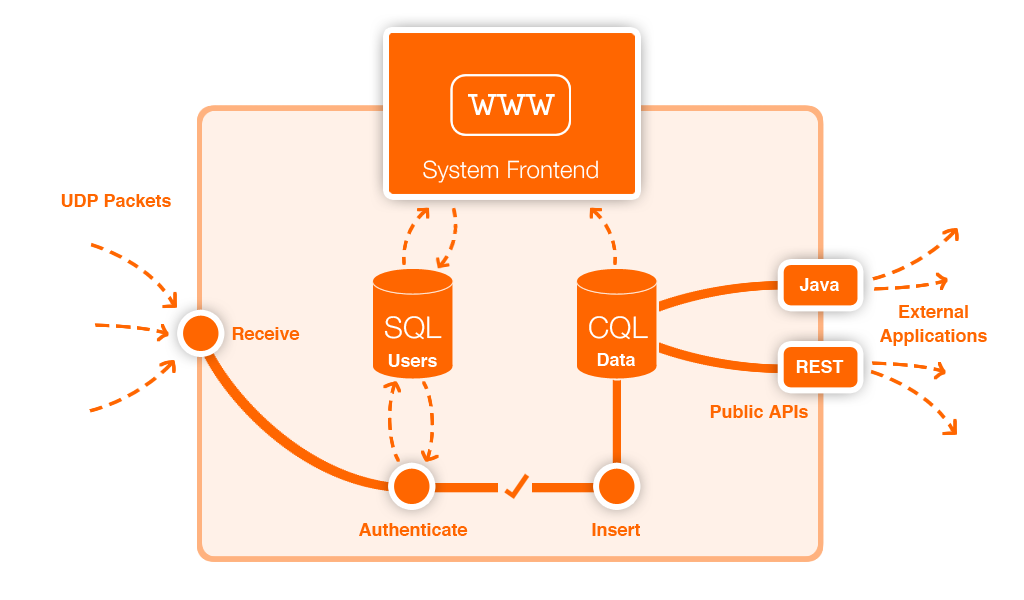
An overview of the inner workings of the system.
The source code for the system is, of course, included in our GitHub repository, under the folder 'orange-sensors-system'.
Data Storage
As seen in the above overview, the system contains two distinct databases; an SQL databse containing sensitive data relating to the users, and a NoSQL database running on Apache Cassandra for storing all public sensor data. The tables and their basic relationships can be seen here, along with the access permissions according to the legend below.
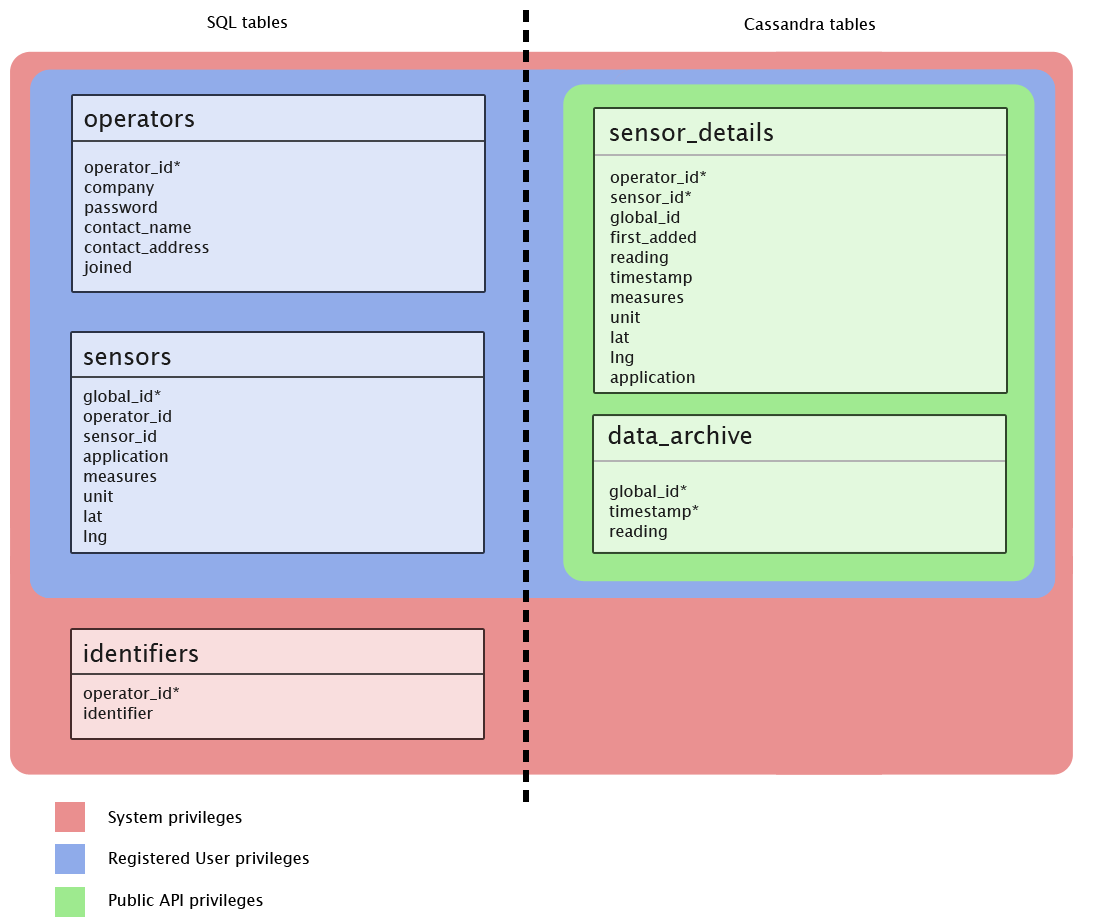
An overview of the databases and tables used in the system backend.
Let's first have a look at the SQL database, designed for storing sensitive data about users, along with metadata about all sensors. We've chosen MySQL to implement this table, due to it being widely supported and documented, as well as convenient to use in conjunction with a web-based front-end. Its schema can be found here.
Operators table
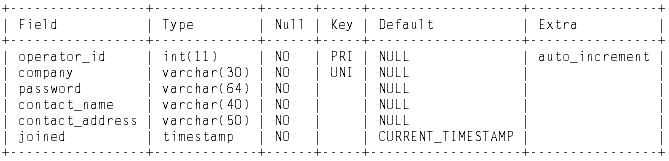
The column description for the operators table.
| Column Name | Description |
|---|---|
| operator_id | An auto-incrementing integer acting as a unique ID for each user. Only the system will see this. |
| company | Essentially a username, though we recommend users to enter their company name as their username, and share a corporate account. No user will be able to see any other usernames on the system; these are private. |
| password | The user's password, to be encrypted. |
| contact_name | The name that will be used in any correspondence with this user. |
| contact_address | The email address to which correspondence will be sent |
| joined | The date the user joined the system (auto-generated) |
Sensors table
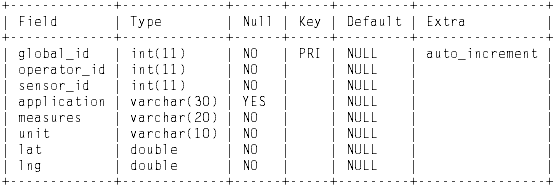
The column description for the operators table.
| Column Name | Description |
|---|---|
| global_id | The unique, system-wide integer ID for the sensor |
| operator_id | The ID of the operator who set this sensor up. |
| sensor_id | The ID of the sensor relative to the order of creation for this user - every user's first sensor will have a sensor_id of 1, for instance, but their global IDs are entirely unrelated. This is for the convenience of the users, allowing them to more coherently manage their sensors and initialise their data strings. |
| application | An optional label for the sensor. Users can query by this label to find their data more quickly. |
| measures | The physical property that the sensor measures, for instance Distance or Temperature |
| unit | The standard unit that this sensor's readings are sent in |
| lat | The sensor's latitude, as a 6-decimal-point float |
| lng | The sensor's longitude, as a 6-decimal-point float |
Identifiers table
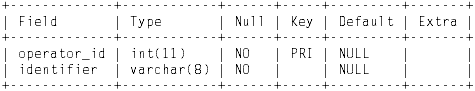
The column description for the operators table.
| Column Name | Description |
|---|---|
| operator_id | The operator ID of a user. This is a foreign key referencing the Operators table. |
| identifier | A unique, 8-character, randomly generated alpha-numerical identifier, for e.g. a4bsc9swm. This is generated in PHP at time of user registration, and is used for anonymous identification of incoming data. Users must prepend their sensor's data string with this identifier, where the system software (see a later section) will check it to ensure it matches for a valid user, and from this find its global_id. |
Again, the schema for this database can be downloaded here.
The Cassandra database we've used has a slightly more complex structure, owing to its NoSQL concepts. Cassandra is well-documented, in terms of its data model and installation, so we won't labour the basics here. In fact, Cassandra was chosen partly due to its relatively wide level of documentation, along with its support for additional software like Hadoop and Druid, to be used for later analytics. Cassandra also provides flexible scalability, greatly simplifying the process of server expansion by automated data sharing across server nodes.
Here's a closer look at the columnfamily designs. Note that the sensor_details columnfamily shares many columns with the Sensors table in the SQL database - for this reason, shared columns will be omitted.
Sensor_details table
| Column Name | Description |
|---|---|
| first_added | The date and time that the sensor was first initialised. |
| reading | The most recently received reading for this sensor, as a float value. Initialised null. |
| timestamp | The timestamp for the most recently received reading. |
Data_archive table
| Column Name | Description |
|---|---|
| global_id | The sensor's global_id acts as a partition key in the data archive. |
| timestamp | Each reading is stored with its timestamp (the time it was received) as a cluster key. This allows users to later query the archive by giving it a specific time range, for example retrieving distinct 24 hour periods and analysing them as blocks. |
| reading | The reading from this sensor that was received at the specified timestamp, stored as a float. |
The schema for this database can be found here.
With these databases implemented, we can now develop the server-side software which handles data input.
Server Software
The software has a few things it needs to take care of. Specifically:
- Listening to a UDP port for Datagram packet receipt
- Processing the packets to ensure they contain valid data
- Checking how to organise the data and inserting it correctly
We've written the server-side software in Java, in order to make use of its concurrency support and access to connectivity libraries for easy networking. In our software we've implemented a dedicated thread to handle each one of the three points given above; a single Receive thread will listen and wait for input, and store the packets in a DataManager object, using concurrency implementations to ensure a safe transfer of data. Once there is data held within the manager, a Handle thread will be notified, and will take from the list using a first-in, first-out approach. The Handler thread takes care of checking the identifier sent at the beginning of the string against the Users database, to ensure it matches a valid user. If a user exists for the given identifier, an Input thread will be created to insert the readings contained within that packet. This involves first using the identifier to look up the global sensor ID for each reading. The 'sensor_details' table will then be updated with the latest reading, and the 'data_archive' table will receive a new row for the data.
Here's a more descriptive sequence diagram of the software approach.
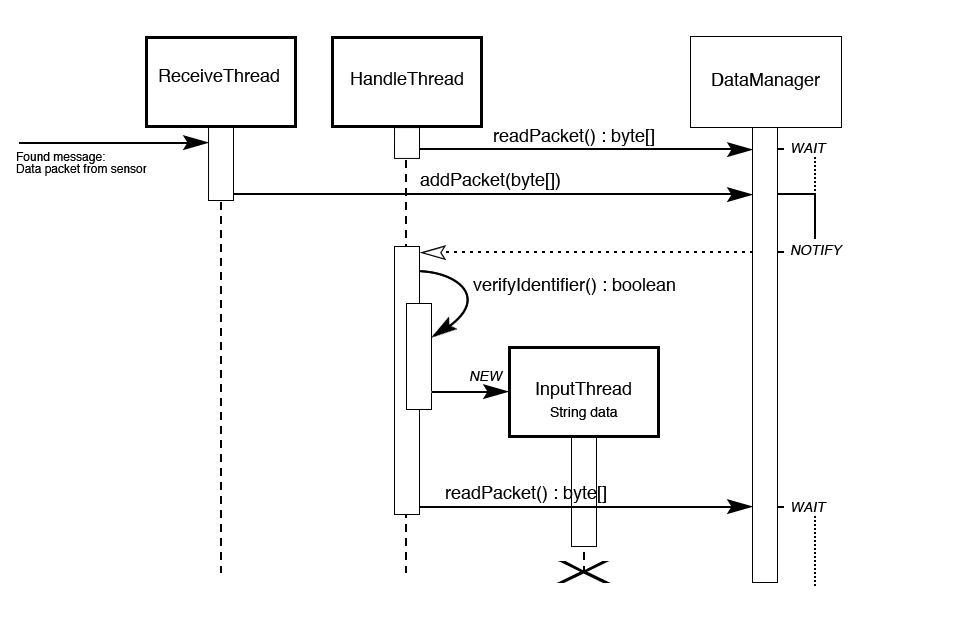
A sequence diagram for the system software, showing the relationships between threads.
These threads make use of both a DataManager class, for concurrent data transfer between the ReceiveThread and HandleThread, and a CassandraCon class, designed as an interface to the CQL database, described by these class diagrams:
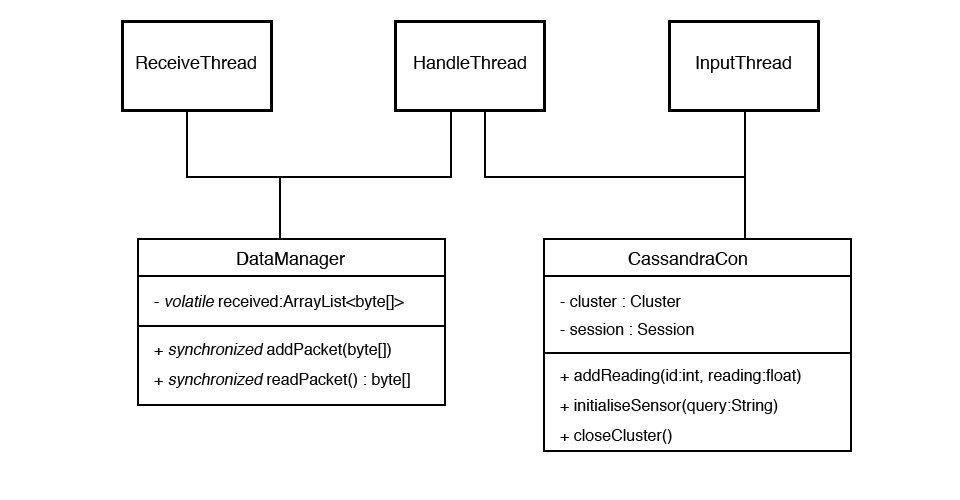
A UML diagram detailing the structure of the objects involved in the system and how they're shared.
Secondary to the data handler, we must also consider that new sensors being registered through the website need to be initialised in the Cassandra database. We handle this in the server software too, through a separate system. To do this, we rely on communication between the PHP of the website and the Java code, opening a ServerSocket on a dedicated port. Whenever the PHP running the website receives a new sensor registration, it will notify the waiting Initialisation Manager, which will perform a basic 'INSERT' query using the metadata handed over by the PHP code. It will also initialise the "first_added" bay with the current timestamp.
Rather than complicating the design of this class with a UML diagram, we provide the code directly. Notice that this class makes use of the CassandraCon class, allowing a simplified interface to the Cassandra Java driver provided by DataStax.
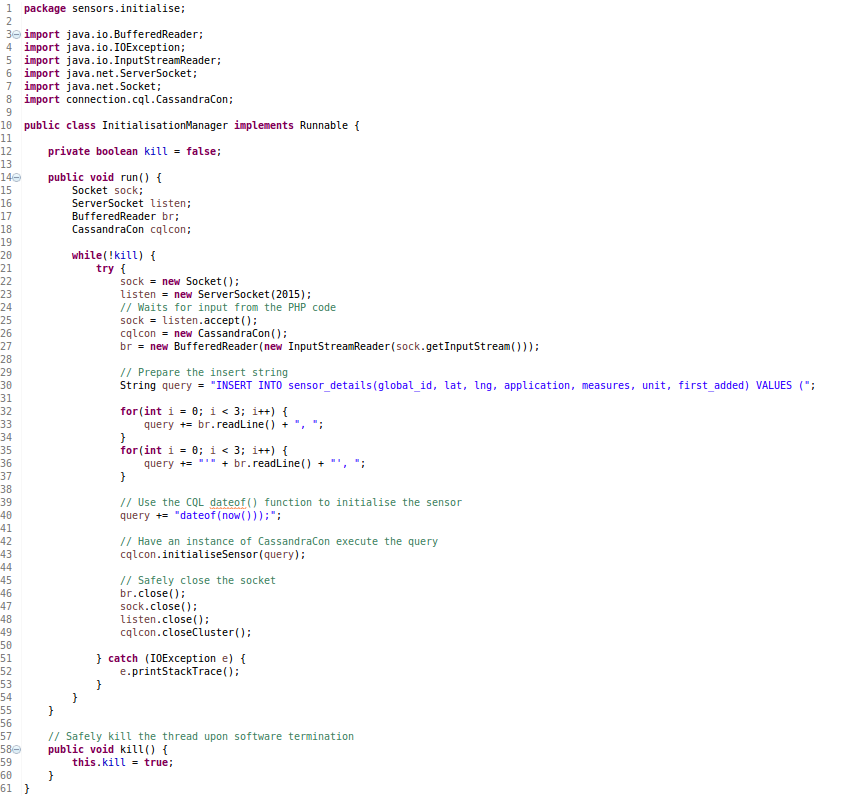
The Initialisation Manager listens for a PHP connection and creates new rows in the Cassandra sensor_details table.
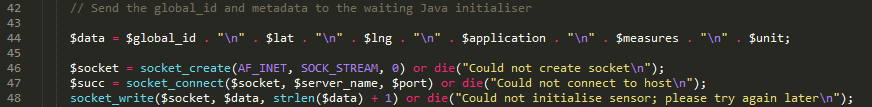
The accompanying PHP code, seen in 'sensor_manager.php', which sends each element of data for a sensor on a new line..
Finally, for convenience, we can initialise all required threads through a main class as follows:
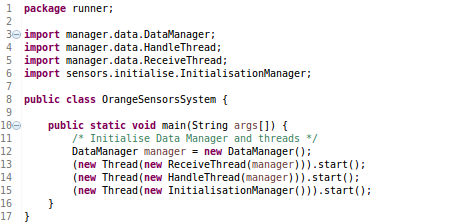
The main class for initialising the server system software.
The Front-end
The system requirements, as specified by our clients, did not include a front-end interface; in a way, this part of the project is exceeding the scope. However, we identified a particular need for such a service as integral to the demonstration of the capabilities of the system. The website for the system is designed solely for the users, and has the following baseline requirements:
- Users must be able to sign up securely
- Users must be able to register new sensors quickly and easily
- Users should be provided with a way to manage their sensors
- Users should have easy access to information and download links for the APIs
- Users should be able to browse public data with a search function
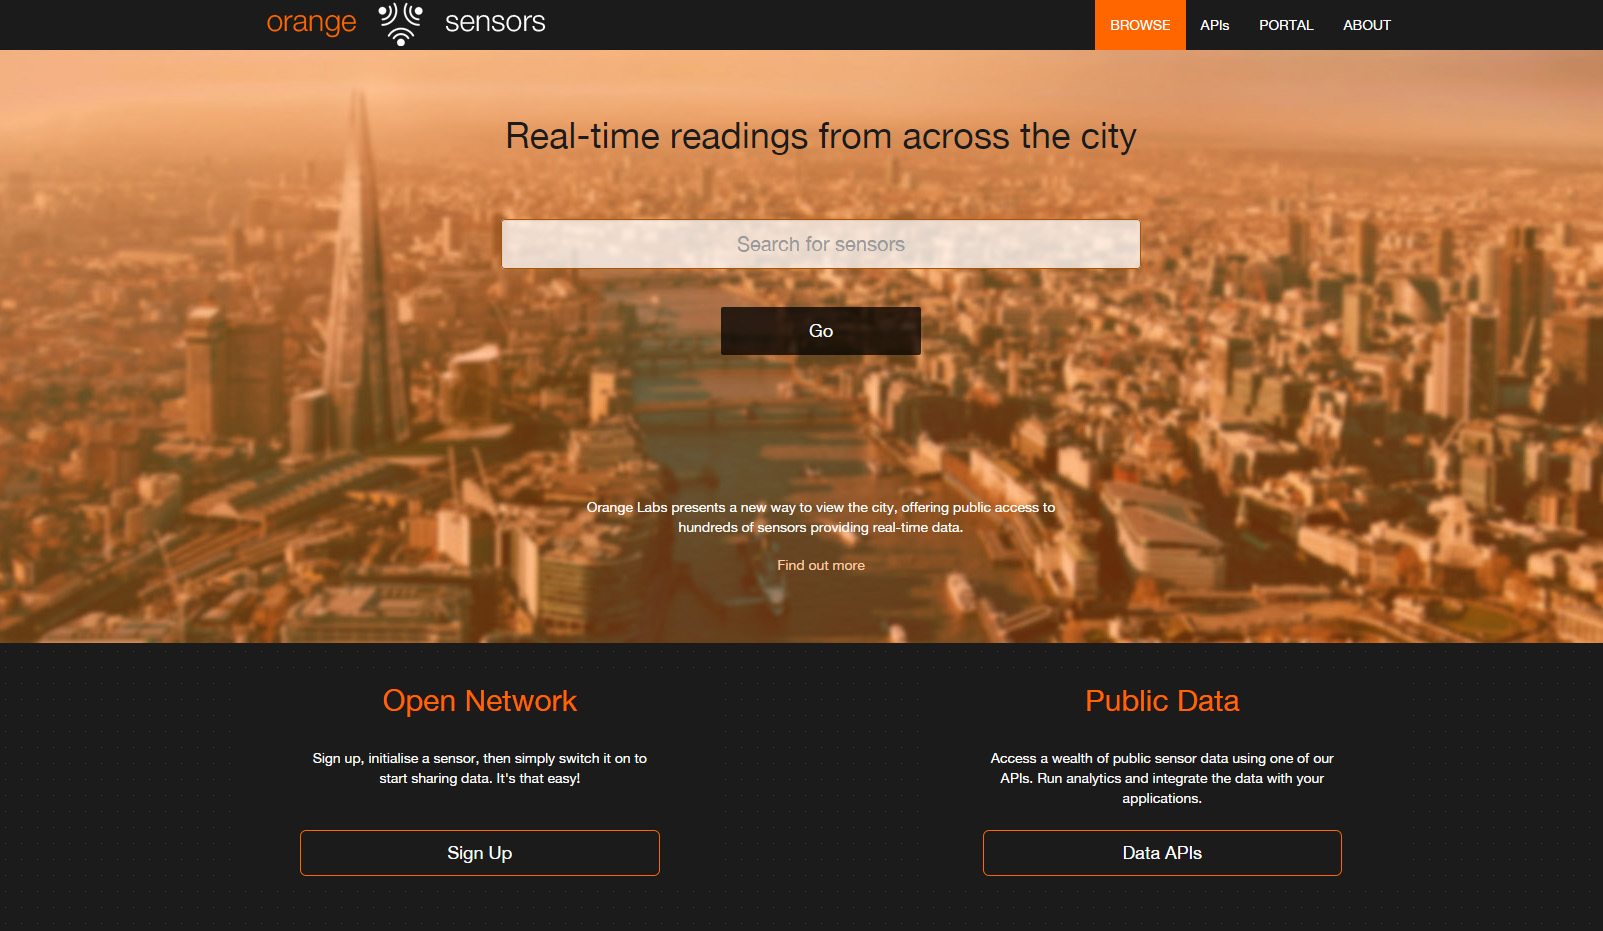
The main page for the System website.
The resulting website is currently live, and can be viewed here, with the source code available on GitHub. The user-friendly interface offers easy navigation between all pages, with a responsive design built using Bootstrap libraries for mobile convenience. The website's backend is almost entirely run from the Users SQL database, detailed above, with a PHP backend. Our PHP code handles user registration, log-in sessions, sensor initialisation, and a basic search function. However, we have also made use of our RESTful API in order to retrieve real-time data from the Cassandra tables and display it on the Management portal.
Signing up requires just four fields - a username, contact name, password, and email address - and immediately takes users to the Management Portal
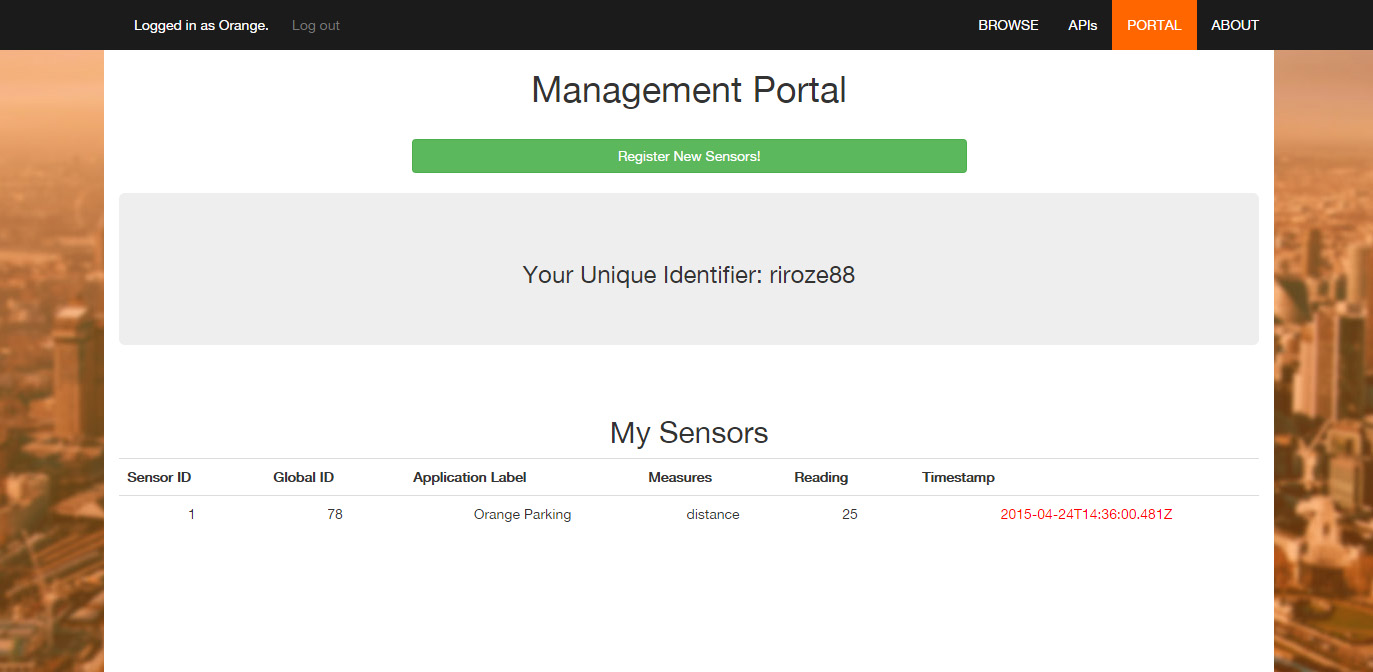
The management portal; the main page from which users can manage the sensors they own on the network.
There are three main features of the management portal:
- The 'My Sensors' table, displaying information about sensors this user owns on the network
- This table will display basic metadata for sensor identification, along with the latest reading and timestamp, as read from the Cassandra database. The timestamp will be coloured red in the event that it is over 24 hours old, as an alert of inactivity. Data retrieval from the Cassandra database is handled through JavaScript (specifically the getJSON method from the JQuery library), making use of our RESTful API. We're also running an AJAX system, to ensure the data is auto-updated in realtime.
- The 'Unique Identifier'
- This is the unique, randomly generated alpha-numerical code that users must send at the beginning of any data strings sent by their sensors to our system. We use this code to ensure that the data we receive is in fact intended for us, and also to gather further data on how to store it. The code is generated through a basic PHP function found in 'signup.php'.
- The 'Register New Sensors' button
- This button simply takes the user to a form where they can initialise a sensor's metadata. The form is shown below, and comprises of an optional application label, a limited list of what the sensor measures (e.g. temperature, distance, acceleration...), the standard unit the measurement is recorded in (e.g. kelvin, metres, metres per second squared...) and its precise location. Using the Google Maps Javascript API, we have added a drag-and-drop marker to greatly simplify the process of indicating a sensor's location, as the coordinates must have 6 decimal points of accuracy.
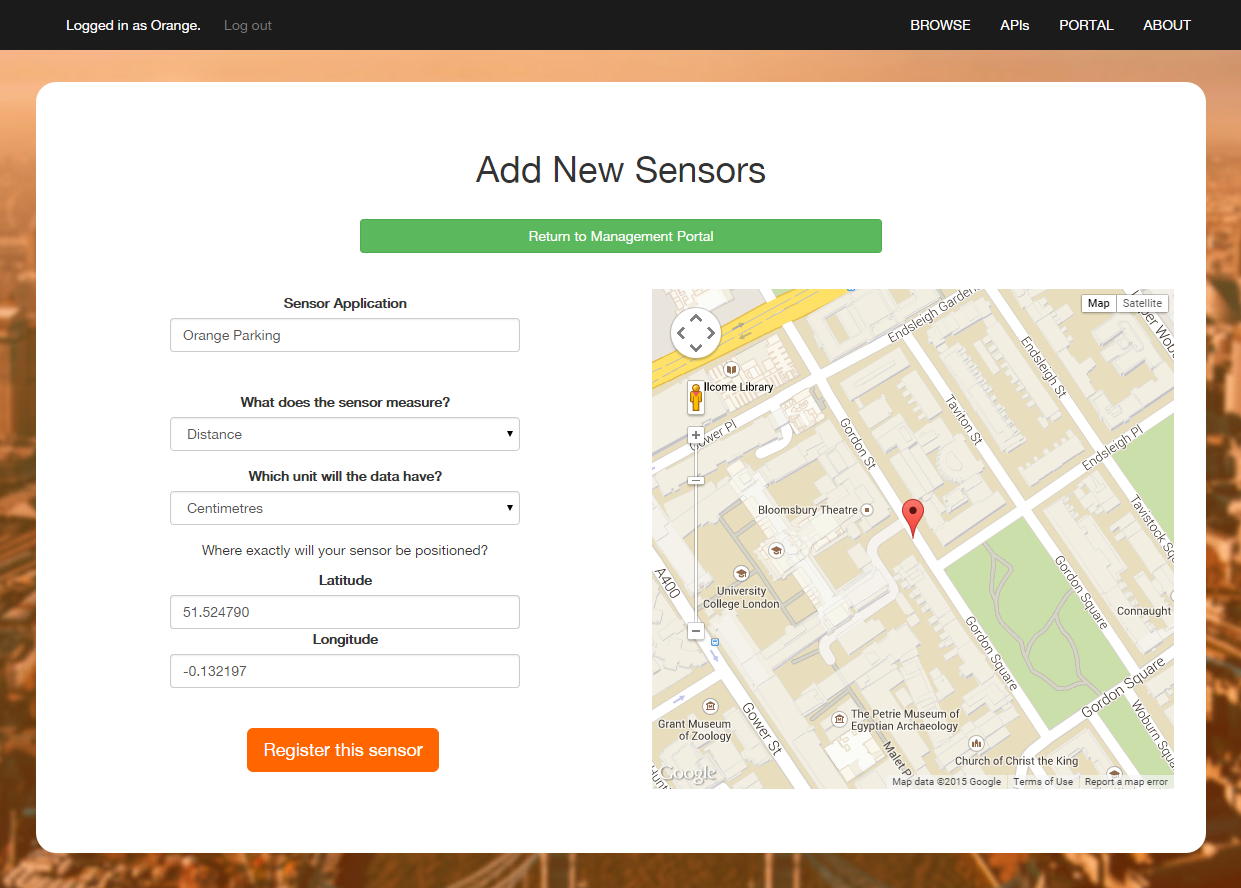
The form for registering new sensors. The application label "Orange Parking" was used for our demonstration application
Overall, the website fully meets our self-identified requirements, though there are many improvements to be made in future, as detailed in the 'Future Goals' section. As with all other aspects of this design, the source files can be found in our GitHub repo.
The Java API
The APIs are critical to the requirements of the system. Easy public access to the data held within the database is indeed the keystone for the entire project, and the specific issue that our clients are looking to solve.
We produced a Java API to allow for resource-intensive analytics or processes on a medium-scale. With a library of almost 30 methods, we offer both public and authenticated access to data, meaning that unregistered developers can access data to use in their projects, and registered users can enjoy the additional features such as limiting their queries to only sensors they own.
The key design points are as follows
- Methods to retrieve a list of global_ids belonging to sensors as filtered by:
- Application label
- Measure type
- Unit
- Timestamp, as a defined date range
- Methods taking a list of global_ids as a parameter and returning a matching list of each sensor's latest reading
- Methods taking a single global_id as a parameter and returning any element of metadata, such as its unit
- Methods taking a single global_id as a parameter and returning any amount of archive data, as specified by a timestamp range
A guide for best practice when using the Java API, along with full and detailed documentation, can be found on the documentation page.
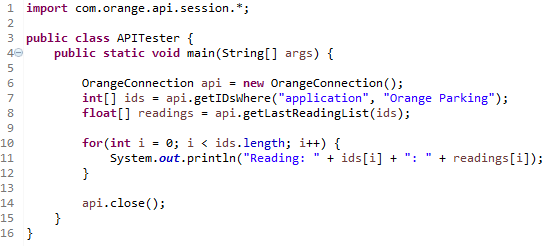
With only 3 lines (6 - 8) the Java API can be used to retrieve a filtered list of sensor IDs and their latest readings for any number of sensors.
The above code demonstrates how simple the Java API is to use, taking only a few lines to retrieve a filtered list of sensor IDs and their matching latest readings. These are only two methods from a library of over 20, using the public class alone.
RESTful API
A REST API was also produced as one of the primary requirements of the system. This was done in order to provide easy and wider public access to sensor data held within the Cassandra database via the well known HTTP protocol. To note, many languages also include JSON libraries for encoding, decoding and manipulating such data.
As a purely 'public' approach to the REST API has been taken - developers do not have to be registered to .get this data. Information on sensors can be retrieved in terms of their global id relative to the system.
Key design points to note:
Originally, multiple methods were brainstormed for inclusion within this API. To keep it straight forward to use, this was cut down to 8 key methods.
These methods include:
- ../all endpoints - to retrieve an entire list of json objects of either the most recent sensor readings or the entire backlog for each individual sensor stored in the archive
- ~/find/.. endpoints - to retrieve json objects filtered by one of the following:
- Individual sensor global id
- Range of sensor global ids
- Application type
- Measurement type
- ../from endpoints - to retrieve json objects filtered by timestamp from the archive
- For the purposes of our system prototype, this API has been hosted on Heroku.
Further information on usage of this REST API can be found on the documentation page.
A general example on usage to retrieve JSON objects can be seen below, making use of the Postman REST client for clarity purposes.
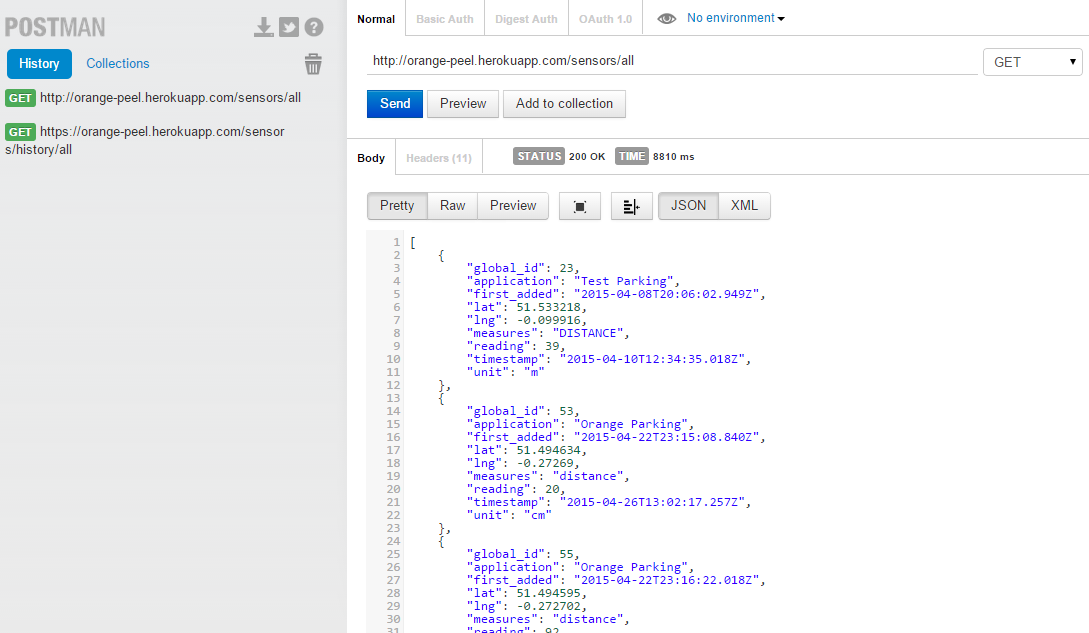
Data retrieved by making a simple .get call
Implementing Hardware
Whilst specific pieces of sensor hardware are certainly likely to be different - by reading different types of data and being designed to be used in different ways - there are some key elements to our system design that must be obeyed in order to work with the system. We developed sensor hardware as parking bay monitors, to be used in conjunction with our Smart-Parking application, and have detailed the important design aspects here. Anyone wishing to build hardware to use with this system must follow the same basic principles in order to ensure compatability.
Sending your data
To send your data, for now you must send it as a UDP string. It is recommended that you use anywhere from 1-10 sensors per zone controller. This means you have 1 device handling global upload of 10 devices. Using only 1 is of course less efficient to using 10, but using more than that will slow down the rate at which data will be send, as there is a small delay between each device. Technically there is no restriction as to how many you can connect, but add more at your own risk.
Here is the format you must follow for your UDP strings:
identifier;sensorID:sensorReading;
Specific Hardware
When it comes to selecting the hardware for your system, your possible choices are very broad. The only real restriction is the kind of data you are reading. For the parking application, you must send your data as a distance. This means if you are determining the state of your parking bay using a binary case or other more complicated methods, then the system will not work. You are free to use other distance measurers than infra-red, just be advised that measuring with ultrasound can be unreliably against rough surfaces.
As long as you are able to send data via UDP, you can use any microcontroller/sensor combination of your liking. The tutorials we provide and recommend require you to use very specific Hardware however.
Technical Achievements
In developing this system, we've broken ground on a lot of significant technical developments. Through our open system, developers can take control over the environments they live in with new-found power and intelligence, truly transforming the digital urban landscape.
A fully flexible, crowd-sourced sensor network
The sensor network we've developed is unlike any other, offering unlimited growth and wide hardware support. We've strived to design a simplified system making it easy for developers with any level of experience to get their hardware up and running, sharing data with the world in a matter of minutes. Data aggregation on this scale has never been done before.
Scalability first
With our network design, the system accesses potentially unlimited reach. Wherever there is an internet connection, there can be sensors. Apache Cassandra allows us to easily expand the server network, with unparalleled reliability and convenience.
Standardised environmental data
Though a complex, rich bank of environmental data is often provided by governments worldwide, it is typically sequestered away or split amongst multiple providers. Our system standardises the process, delivering data in a the same format from the same location, greatly simplifying the process of writing analytics as a developer.
Truly public access, anywhere, any time
The two APIs we've provided with this proof-of-concept are just the beginning. The datasets we're storing are remarkably large, and will offer innovative aspects of big data research through analytics - never before have developers been able to explore how daily pollution levels can unexpectedly affect traffic flow across a city in so few lines of code.
Encouraging humanitarian attitudes
A more sociological development, the ease with which private companies can now contribute to the positive improvement of our urban environments simply by using our system to store their data publicly could certainly inspire a greater acceptance by the wider community.
Testing
Testing is a hugely important factor in any piece of software. In our case, ensuring optimum efficiency along with secure, reliable code execution is critical; though our proof-of-concept may be small-scale, the design is intended to work at a scale comprising potentially millions of sensors.
Software Testing
Visual Testing
Our most frequent form of testing, visual testing concepts simplified the learning process for us in areas where we initially had low experience, and also exposed myriad issues throughout development. One such example was the extensive use of visual testing in the development of the server-side software - careful analysis of code operation led to interesting findings and optimisations of concurrency. Indeed, we owe a lot of our robustness to the benefits of visual testing, and have been able to deliver a product of high quality as a consequence of its careful, critical application.
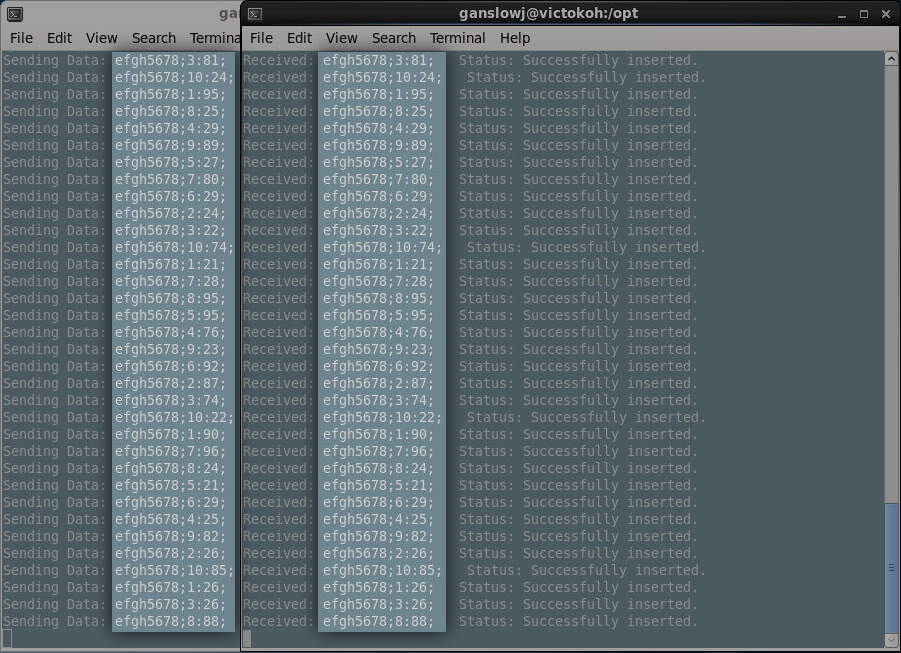
The console output of both the system software (receiving packets) and sensor simulator software (10 threads each sending packets every ~10 minutes).
Load-testing the server
Our server is to be designed to hold up to high levels of traffic, given that it's the backbone of a network potentially comprising hundreds of thousands of sensors. As such, it's important to test the structure we have in place in order to assess how any issues can be rectified in future versions. We've chosen to load-test our server by sending 1000 packets of data simultaneously, from 10 threads running concurrently. Each thread will be updating a single sensor, and will loop 100 times whilst sending an incremented reading with each iteration. In an ideal case, we should be able to see in the data_archive table readings showing 1 - 100 for each tested sensor, with the overall count in the data_archive table for those sensors being 1000, indicating a 100% receipt rate.
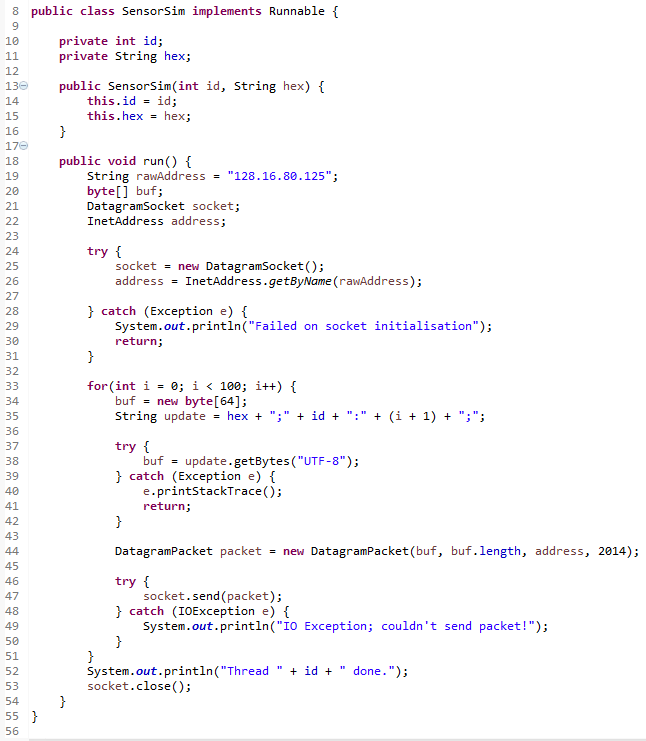
Our load-testing program creates 10 of these threads, each of which sends 100 distinct readings to the database.
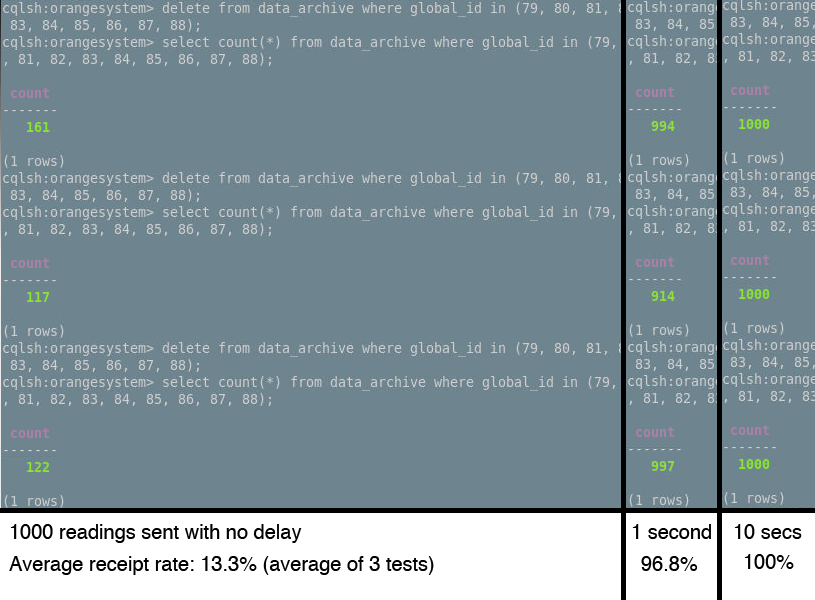
Three tests were performed each with three repeats - sending 1000 readings with no delay, over the course of a second, and over the course of 10 seconds.
The results were in line with our expectations; UDP as a protocol is by its very nature prone to packet loss. We can see, however, that we have a drop rate of less than 5% when receiving at a rate of 1000 updates per second (86 million per day) - which, one could argue, is within a reasonable tolerance. That said, for data where the update is critical, even a drop rate of 1% could be severely problematic.
As a consequence of load testing, we have come to the conclusion that support for TCP connections is a must for future versions of the system. UDP is likely to be perfectly practical for regularly updating sensors - e.g. a temperature sensor which updates every 30 seconds or so - because in these situations, losing 5% of packets isn't likely to negatively affect results. Conversely, if a sensor calculates its updates more intelligently (for instance, a parking monitor sending an update only when it's sure it notices a vehicle), delivery of that packet is critical to operation.
Finally, it's worth noting that the system has been designed with large packets in mind - that is, sending a single data packet containing multiple readings. If users were to have their data sent more economically (for example, ten readings per packet) the maximum data transfer would increase by a factor of the average reading per packet (in this example, x10).
Unit Testing
JUnit testing
Methods in Java software are very easily tested through JUnit, and we made sure to perform multiple JUnit operations as insurance of reliability. The Java API, example, has a high priority for being bug-free, as it is intended to be distributed publicly for developers. Bugs in our singular system program can be fairly easily tackled without a problem, but to issue updates to a library used in potentially tens of thousands of externally developed applications is a far more damaging process.
In order to formally test the Java API, the majority of methods were planned ahead. These were the methods whose inclusion was compulsory - for example, retrieving sensors by application label - getIDsWhere(String col, String value) - and then retrieving their readings - getLastReading(int id). JUnit tests were then written in advance using a set of mock readings created in the system database, which included 6 sensors each with 5 readings in the archive. This can be seen below.
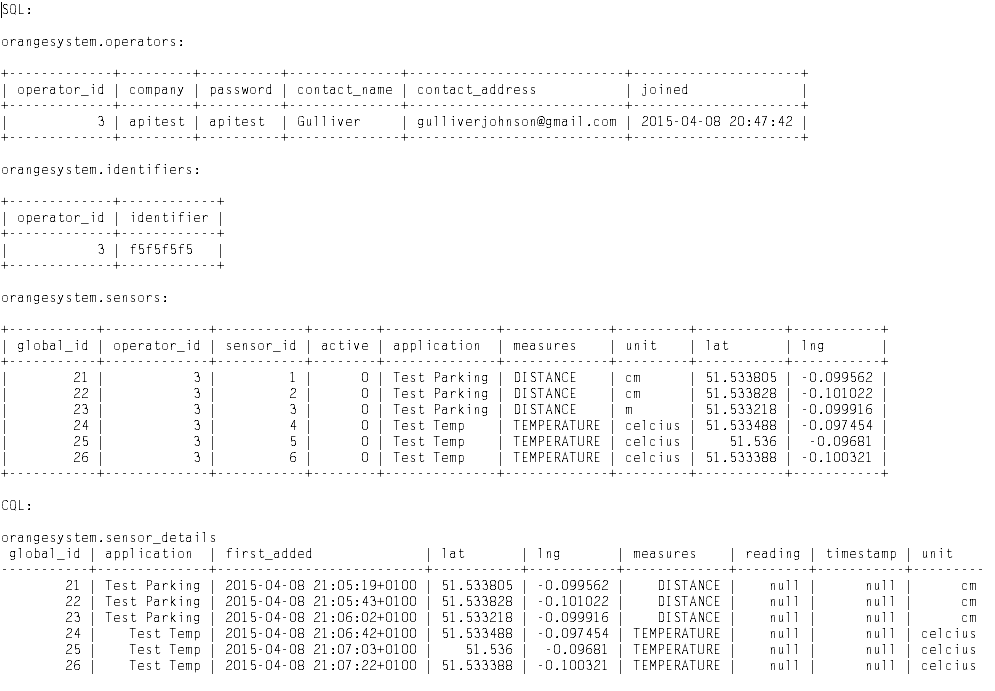
The mock entries into the database tables, created for the purposes of extensive API testing. The full details can be found here.
With these in place, the JUnit tests could be written. Below are four such tests, with the set up and tear down methods included. Compare these with the expected values as seen in the test set, above.
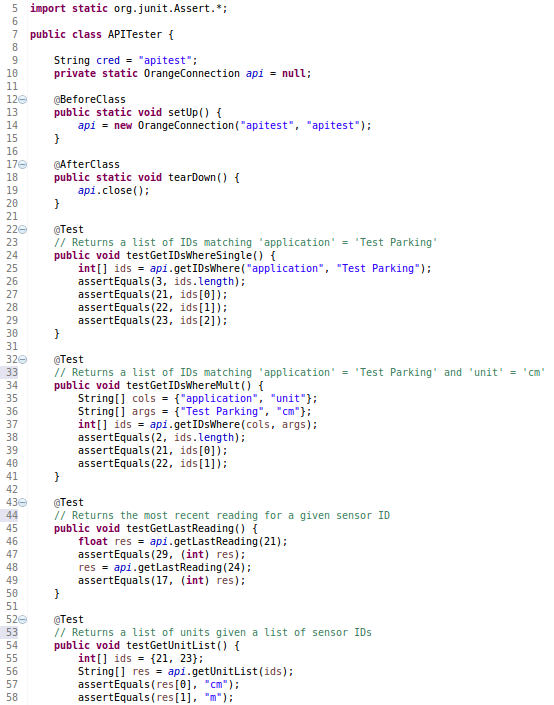
A sample of a few test methods written for testing the Java API.
28 tests in total were run on the Java API, and they highlighted a number of important issues. These included:
- ID lists returned from a query to the Cassandra database were unsorted due to the structure of CQL; this meant that the index of a given reading in the resulting list could not be guaranteed to match the ID at the same index in the IDs list. This was rectified by implementing Java's Arrays.sort method.
- Attempting to filter via timestamp took time to achieve reliably and successfully, and required further work on the API in order to allow full compatability with Java Date objects.
Once each test and accompanying API method had been written, it took only 3 runs before tests were successful.
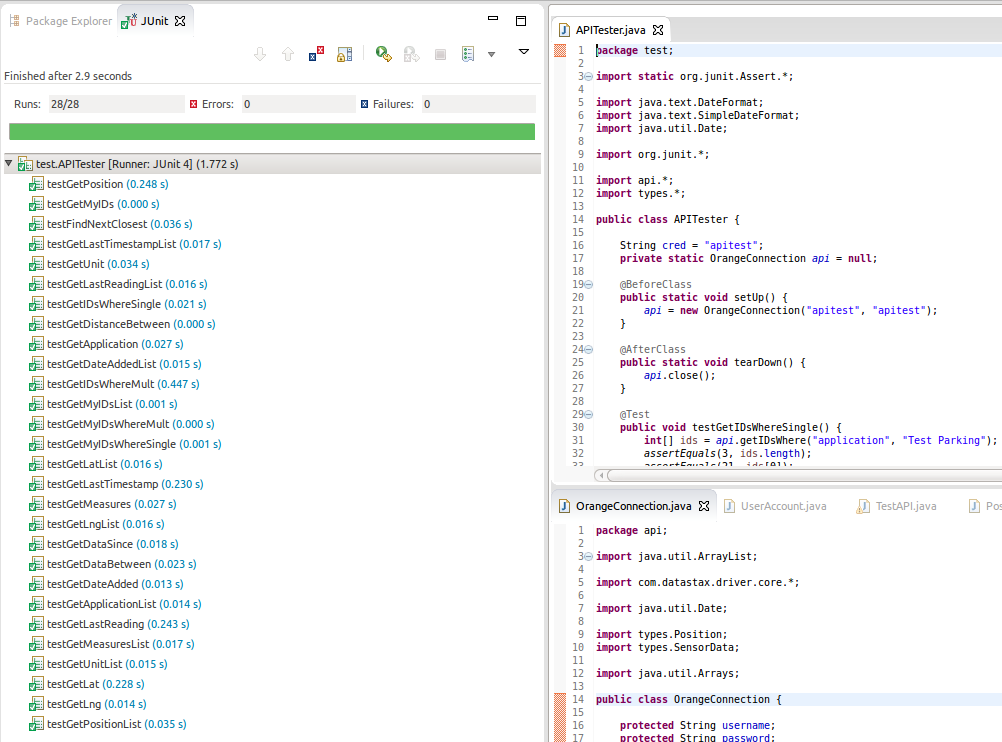
The successful run of the test methods.
Long-term testing through our use-case
As a way to demonstrate our Smart Parking application in action, we produced sensor simulator code to simulate the types of input a parking bay monitor might receive. Over a normal distribution of mean 10 minutes, and a standard deviation of 2 minutes, 10 separate threads would change state and send a reading alternating between above and below 40cm. This therefore averaged one insert a minute, and the software was left running for around 8 days before it was first interrupted for important updates. During this time, visual inspection revealed 100% packet transfer, with no exceptions being thrown at any point.
Frisby.js Testing
In order to automate testing for our Web API, Frisby.js, a REST API testing framework built on node.js and Jasmine was used. This has enabled rapid testing of individual routes and endpoints during and after the development phase.
To note, the scope of information which can be retrieved from the REST API is slightly less compared to our other API due to security and authentication constraints of our system.
The JAVA API enables access to both an SQL database (relevant to the front end of this system, the sensor management portal) and the CQL database where all sensor data is stored and as such tests for both. In contrast, the REST API provides access to all sensor data from the CQL database singularly and, in the interests of both security and providing wider public availability is partially the reason user details have been completely separated from the CQL database and placed in an SQL one in order to hide sensitive information from unauthorised read/write via query.
Below, a few of the automated tests written in Frisby are provided. In order to carry this out, mock readings were generated in java simulator code for 10 different sensor ids to populate the CQL database. This was done to provide an accurate diagnosis on access and correct retrieval of the data_archive where historical data on sensor readings is recorded.
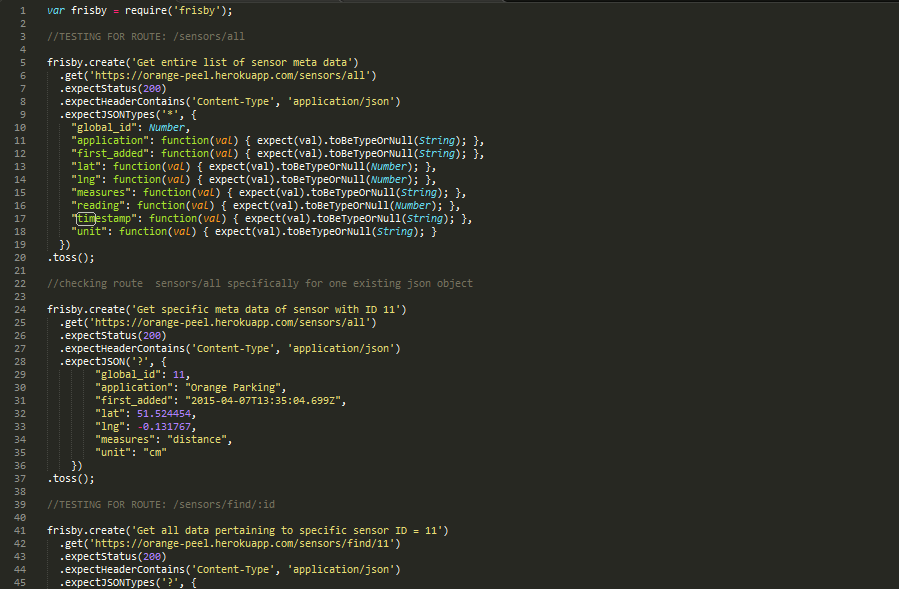
A sample of a few of the test methods written using frisby.js.
-
10 different tests were run on the REST API. These were for the most part split into two categories to include:
- -> General testing methods - ensuring the correct format of json objects was being retrieved.
- -> Specific testing methods - a subset of the general testing methods, testing specifically for existing json objects and values returned meeting expected json output.
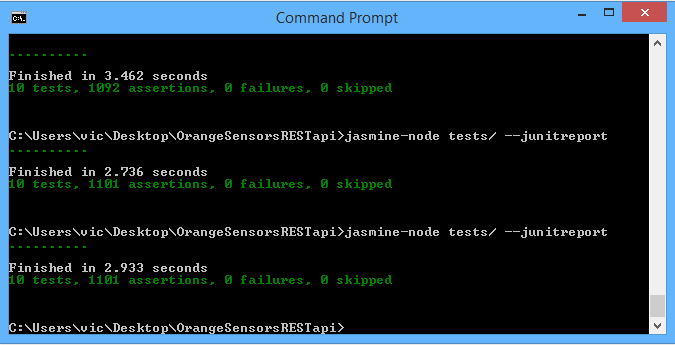
The command line where tests were executed using Jasmine-node
The testing of this API highlighted a few key issues with the database design/ structure and also unique specifics of the CQL language - a subset of SQL.
These include:
- It was not safe to include any user details such as operator_id within the Cassandra database if kept within the same table as meta data on individual sensors.
More generally, given the code is open source and the potential to add onto the current REST API code exists, including said data would not be secure at all. - Complex boolean operations and also the AND operator is not always applicable for querying. As a substitute, the IN keyword has been used instead.
- Due to the way strings are handled as byte arrays, querying with CQL is case sensitive.
- Due to the way the database has been restructured using widerows, it would not allow querying by an attribute that was not a primary key. To solve this issue, some restructuring of unique and primary keys occurred along with the inclusion of indexing each row so that this data could be found.
Hardware Testing
Load Testing
Some of the tests we did for the hardware were load tests. These served the purpose of testing just how much we can push the system and allow us to set boundaries in terms of what we allow the system to do.
ZigBee load test
One of the load tests we did was on the ZigBee network. The testing involved sending data at different rates to see how many went through successfully. What we found was that we were able to send data at an incredible rate, far exceeding what we would ever need to send.
In a test, we send 100 readings in 1 second. Already, this would be far more than we would ever need. At most, 1 zone controller would not have more than 10 sensors anyways. Since we put a delay of around 15 seconds on how often data can be send from each node, the zone controller would at most only ever receive 1 reading from each node a second.
Serial ports load test
For our hardware, we used serial ports in 2 instances:
- To send data from our stamp to our Arduino.
- To send data from our Arduino to our Computer
In both instances, we were able to send at a baud rate of 115200. This is again far higher than we would ever need, meaning we were able to send data reliably.
One thing we did find was that when communicating between our computer and the Arduino, the data would sometimes duplicate itself in the first or second reading. To get around this, we simply ignore those initial readings, as this only occurs on startup.
Sensor Accuracy
Range
The first thing we tested was the range. The recommended range for the Sharp 2Y0A02 Distance Sensor is 20-150cm. What we found was that if the reading went below that, it would start reading false high values:
| Expected reading (cm) | Actual reading (cm) |
|---|---|
| 0 | 60 |
| 10 | 40 |
| 20 | 20 |
| 50 | 50 |
| 100 | 100 |
| 150 | 150 |
| 200 | 150 |
| 300 | 150 |
As seen, this could become a problem, as the sensor being covered could be misunderstood for being occupied. The reading is luckily above what we accept as occupied, so if a cars wheel is covering it, it would be read as occupied still. Another thing to note is that the only way it could be covered with our current configuration would be if a wheel of the car was in the center of a parking bay, which would be an illegal way to park either way.
Surfaces
What we found was that the sensor was surprisingly accurate despite different types of surfaces. Below are examples of tests returning correct values:
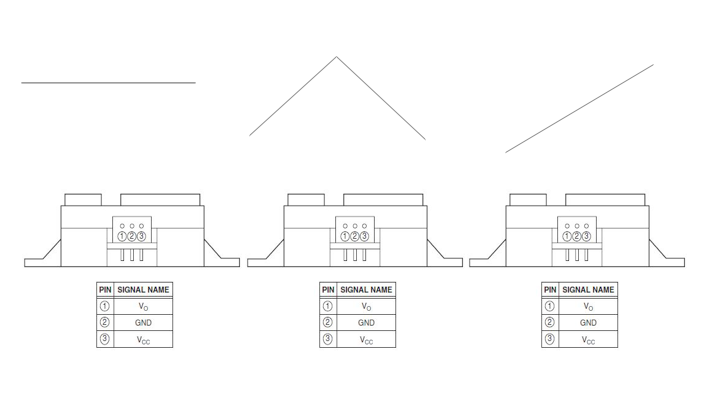
As you can see, it pretty much covers all types of surfaces. The only thing that seems to matter when it comes to reflecting off surfaces is the distance. This is because infra-red sends a scatter of beams and as long as one of them returns, it is able to read that.
We also tested difference materials of surfaces. Surprisingly, it worked on most surfaces. The only one it had trouble with was see through material like glass, but as long as people wont be parking invisible cars, we should be fine.
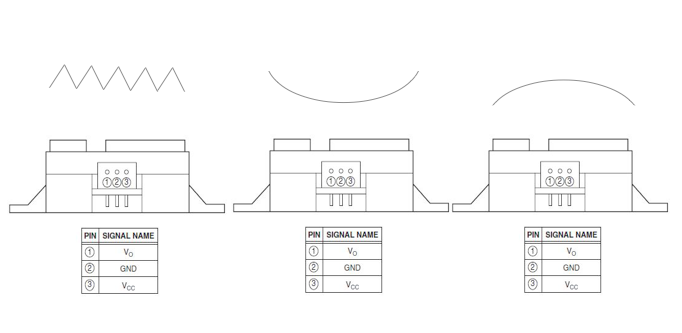
Sensor set up configurations
The next thing we tested was the different setups possible with ZigBee. Below are a few of the configurations we tested:
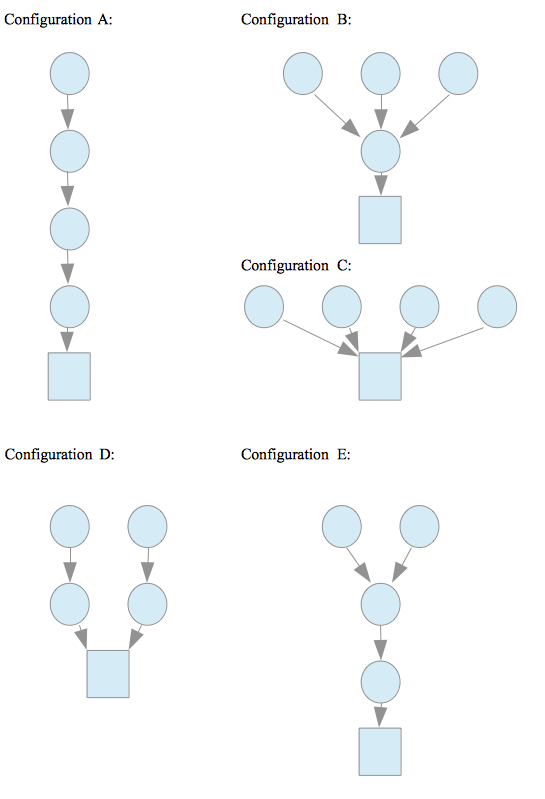
As you can see, the possibilities are endless. As we have already proven, each node can handle far more data than is ever required here. Even if we had 10 nodes all pointing to one node, it would still easily be handleable.
The configuration we choose comes down to the kind of parking lot we are dealing with. Its just a matter of changing the code a little for each setup.
Evaluation
Successes
Throughout this project, we've overcome many challenges and provided a working, feasible proof of concept design for our clients. Performing a requirements review highlights how we have been able to target the specific issues identified in the brief.
A Plug and Play Architecture
We've achieved this through the culmination of multiple design features. First of all, by providing a web service for user sign-up and a remarkably simple sensor registration system. As well as providing a standardised set of metadata, this means that sensors can begin sharing their data in as few as three steps. The second step, of course, is to modify the firmware such that it sends a string in a particular format - with its own ID and the user's identifier. This process of course requires a certain level of technical ability, but there are certainly abstraction layers that can be built, for example in the form of a GUI, to streamline the process. After that, all that's left is to turn it on. In our demonstrations we are able to register as a user, initialise a sensor, set the firmware, and have data being sent all within a few tens of seconds. All of this comes with added benefits of the data being automatically validated, sorted, and standardised for public use.
Scalability
This has been achieved in multiple ways.
One of the ways we ensured that our system would be scalable was to switch from a SQL to a noSQL database. An SQL database would have worked just fine for our proof of concept, but if we wanted to ensure that large scale analytics would be possible, we had to use a noSQL database.
Another way we ensured that our project is scalable is by adding the ability to add sensors of different types. The system itself can store any kinds of data, although the parking app will only use data that is read as a distance and in centimeters. This allows future applications for things like weather apps to use our system to store and access their data.
A mesh of data
We have multiple databases, which together form our mesh of data. Our SQL database stores all the user data such as location,sensor id, measurement type, etc. This database along with our noSQL database provide a large and descriptive set of data. Our APIs allow for easy access to this data.
Full public accessibility
We have made this system as easy to use as possible. If the public wishes to add data to our database they simply have to register online and we will do the back end for them. If they wish to use the data in our database they can also use our APIs which have large libraries of functions for accessing the data. The project was designed to be open source and is therefore purposely made as easy to use as possible. This does mean all the data has been made public, however if Orange Labs were to launch this, they have told us that they would release it as an open platform.
Areas for Improvement
As with any time-limited project, we'll never feel satisfied that we've explored all of the corners and ironed the creases. As we went along the project, many new and interesting ideas sprang forth. Sadly, we had to place the line somewhere. Here are some areas we feel deserve more attention.
System software administration
Currently, the system software has no interface. It's simply a piece of code that is set running and left to loop for eternity. Even as we were building it, we were implementing the tools for developing a command-line interface at the very least. Expanding this, and providing stronger administrator control, is certainly at the top of our priorities list for additions.
Usability improvements for the website's Management Portal
The management portal has great potential to be a one-stop-shop for all of a user's needs when it comes to interacting with the system. Right now, its functionality is limited to basic sensor monitoring and registration. We'd like to add a filtering or search feature for checking up on specific sensors, the option to activate/deactivate sensors, and controls over system notifications. Users could, for instance, set an automated alert to be emailed to them if a sensor they own hasn't sent an update for the past two hours. Small upgrades like this would really help to transform the attraction of the greater system.
Support for TCP connections as well as UDP
As seen in our load testing section above, it became apparent that a more secure connection option would be desired by a number of developers using the system. The protocols required for allowing TCP connections would add an extra layer of complexity to the plug-and-play nature, but if reliability is key, the sacrifices fade into insignificance. With a more secure connection, we can also offer a greater capacity for protection against malicious or spam data contributions.
That's all from the showcase - we hope it's been informative and engaging. Be sure to look at our demonstration application to see everything in action and explore for yourself!