Development Plan
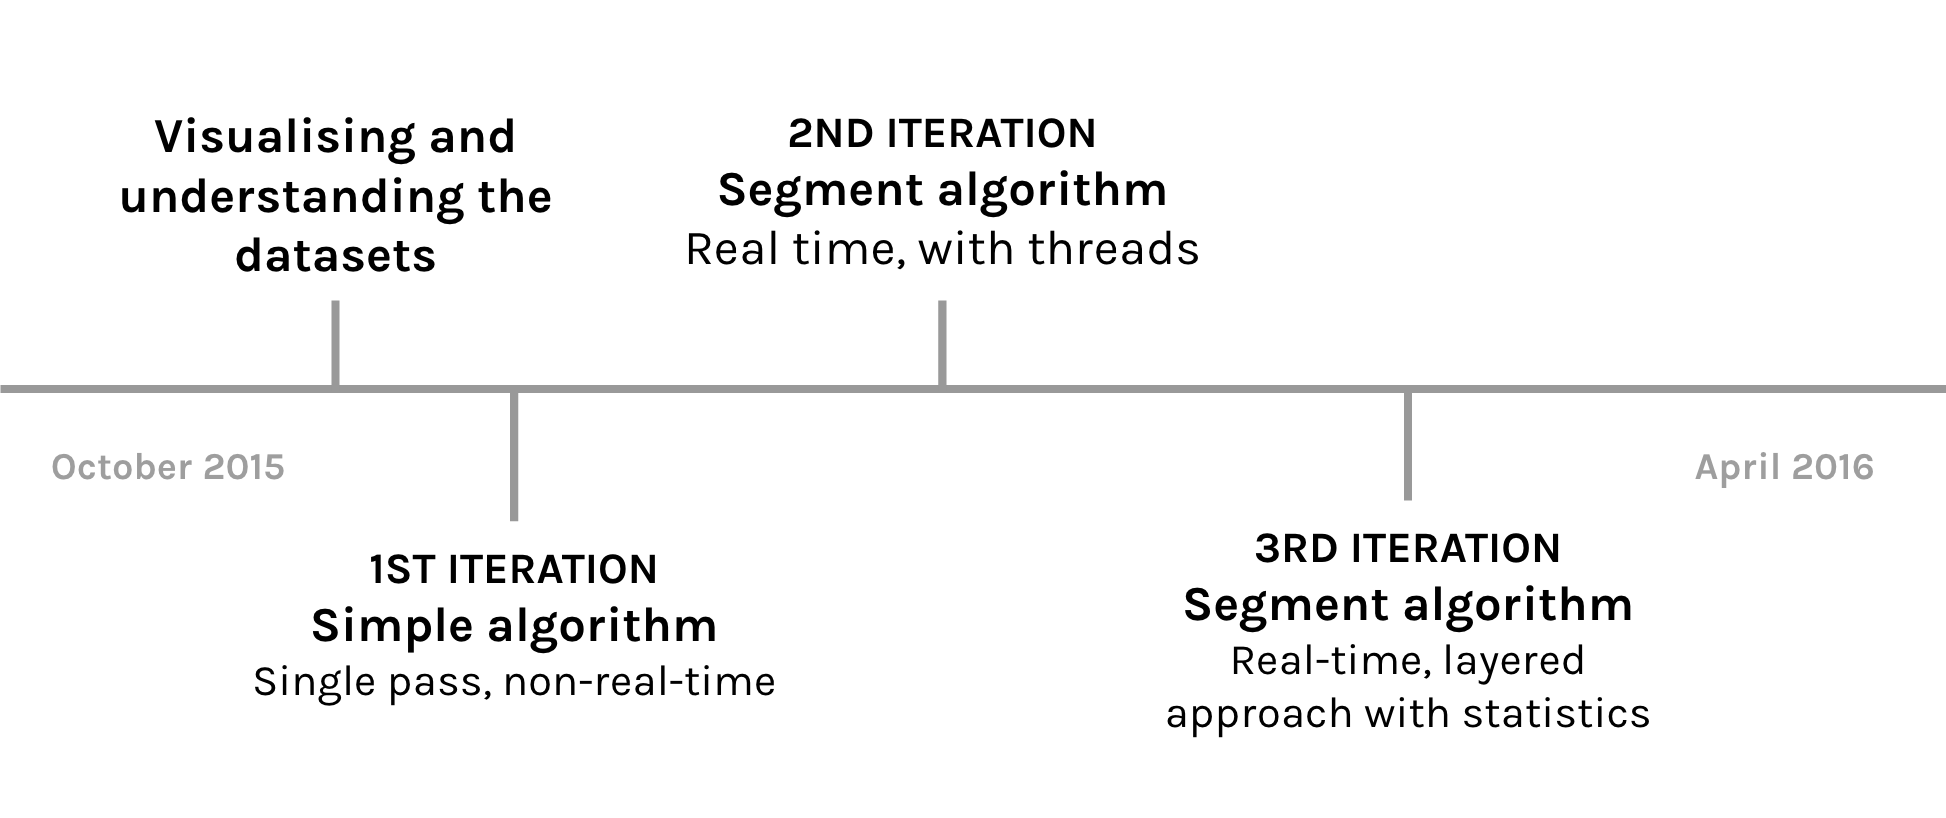
Throughout this project, we have worked on 3 different iterations of the algorithm.
- Single pass statistical algorithm
- Real-time with segments
- Real-time with statistics
Single pass algorithm
The first iteration was based upon an algorithm from last year’s group. This was not a real-time algorithm but instead it would get all of the trust report and do post-processing at the end of the day. Essentially, it matched the trust Reports to the GPS Reports by comparing the TIPLOC codes within a certain time limit. Next, the algorithm checked if the unit was supposed to run that service and gave a preference to those units. Finally, we calculated how the percentage of how likely a given Rolling Stock ran the services.
Together with this algorithm, we also developed a new visualisation. The UI allowed you for a specific gps_car_id to see all of the matching headcodes. Additionally, it also visualised all of the reports that the algorithm analyzed by sorting them by time and displaying matched reports next to each other.
More information can be found here.
Problems
After carefully analysing the outputs of this algorithm, we identified several problems:
- If a service only has a low amount of stops (<5), the algorithm had trouble finding the appropriate unit
- Does not take in consideration other factors such as a unit cannot run 2 services at the same time
- Results were not reliable enough in general
Initially, we tried solving some of these problems by improving this iteration of the algorithm. However we realised after a while that it would be better to find a more natural way to represent the solution.
Real-time algorithm with segments
The idea for this algorithm came from the fact that we could represent the output of the algorithm very naturally as “segments”. These would consist of reports from one specific unit and one specific service. Some more specific information can be found here.
Together with this algorithm, we also decided to improve upon the visualisation. First of all, instead of displaying the reports linearly, we display them using a non-linear time scale. On top of that, all of the reports were displayed on a map to allow a user to quickly see if two reports actually matched.
Real-time algorithm with statistics
Since the segment-generating exploded in complexity, we wanted to design a simpler algorithm, with the same performance. But to avoid any concurrency issues, we designed it in several layers, which could all run individually by separate workers. More information can be found here.