Project Requirements
Below are the requirements in a MoSCoW format:
Must Have:
- Train Service Real Time Pattern Matching Algorithm
- Use data from GPS, real time train service data (TRUST), train schedule data and train diagrams
- Operate in real-time
- Return a list of units which have been identified as not matching their planned services
- Support only basic scenarios
- Prototype Application that uses the algorithm to match Rolling Stock to Services in real time
- Display the output of the algorithm
Should Have:
- The prototype application simulates a real-time environment
- You can select any Rolling Stock, to get more accurate information
- Track all Rolling Stock on a long-term to improve accuracy
- Use additional information in the headcode of the Service to make predictions
- Deploy system on Heroku
Could Have:
- Predict a more accurate mileage record
- Support more complex scenarios, discussed in under discoveries
- Visualise the output data
- Use additional data streams (from Network Rail data feeds) to generate more accurate results
- Test system using real data instead of test data
Would Like:
- Return the data in the same form as the diagrams and highlights where changes have happened
- Compare the mileage record obtained from the algorithm to the milage record calculated from all GPS events
- Handle situations where Rolling Stock go to the maintenance depot after running the Services
Currently, our Proof of Concept covers all of the Must Have requirements except for supporting a real-time environment and output a list of the units which have been identified as not matching their planned services. Instead, it returns the probability of a Rolling Stock running a Service. Therefore in the current state it still needs human assistance.
However we believe that we are on track to cover all the requirements. We are already working on improving the algorithm and si,ulating a real-time environment.
Use Cases
To describe the system and its requirements to a further extend, we will use some use cases.
| Use Case: ReceiveReport |
|---|
| ID: 1 |
| Brief description:
The System received a real-time Report (Trust or GPS) from a Data Source. |
| Primary actor(s):
Data Source |
| Secondary actor(s):
None |
| Precondition(s):
System is connected to Data Source using correct protocol (STOMP) |
Main flow:
|
| Postcondition(s):
Values updated |
| Alternative flows:
None |
| Use Case: DownloadSchedule |
|---|
| ID: 2 |
| Brief description:
Every morning, the System downloads a new Schedule. |
| Primary actor(s):
Time |
| Secondary actor(s):
Network Rail Data Feed |
| Precondition(s):
System is connected to Network Rail Data Feeds using the STOMP Protocol. |
Main flow:
|
| Postcondition(s):
New Schedule in Database |
| Alternative flows:
None |
| Use Case: LoadHomePage |
|---|
| ID: 3 |
| Brief description:
Whenever a User visits the home page, the System displays all of the Units that have been identified as not matching their planned service. |
| Primary actor(s):
User |
| Secondary actor(s):
Browser |
| Precondition(s):
None |
Main flow:
|
| Postcondition(s):
User can see current output of algorithm. |
| Alternative flows:
None |
| Use Case: UserSelectsUnit |
|---|
| ID: 4 |
| Brief description:
The GUI allows the User to get more information on a Unit |
| Primary actor(s):
User |
| Secondary actor(s):
Browser |
| Precondition(s):
None |
Main flow:
|
| Postcondition(s):
User can see information on a particular Rolling Stock. |
| Alternative flows:
None |
Prototype
The first iteration of our prototype, implemented the statistical algorithm. Essentially, it matched the Trust Reports to the GPS Reports by comparing the Tiploc codes and Event Types within a certain time limit. Next, the algorithm checked if the Unit was supposed to run that service and gave a preference to those Units. Finally, we calculated how the percentage of how likely a given Rolling Stock ran the services.
Algorithms
The first algorithm we used was a simple statistical one, and it was used in last year’s project. It calculated how likely a Service was run by a particular Rolling Stock by calculating how many Trust Reports match with a GPS Report. Next, we combined that algorithm with our visualization to see how accurate it was. After careful evaluation, we concluded that it was not accurate enough and therefore we had to move on to a more complex version.
Statistical Algorithm (see demo)
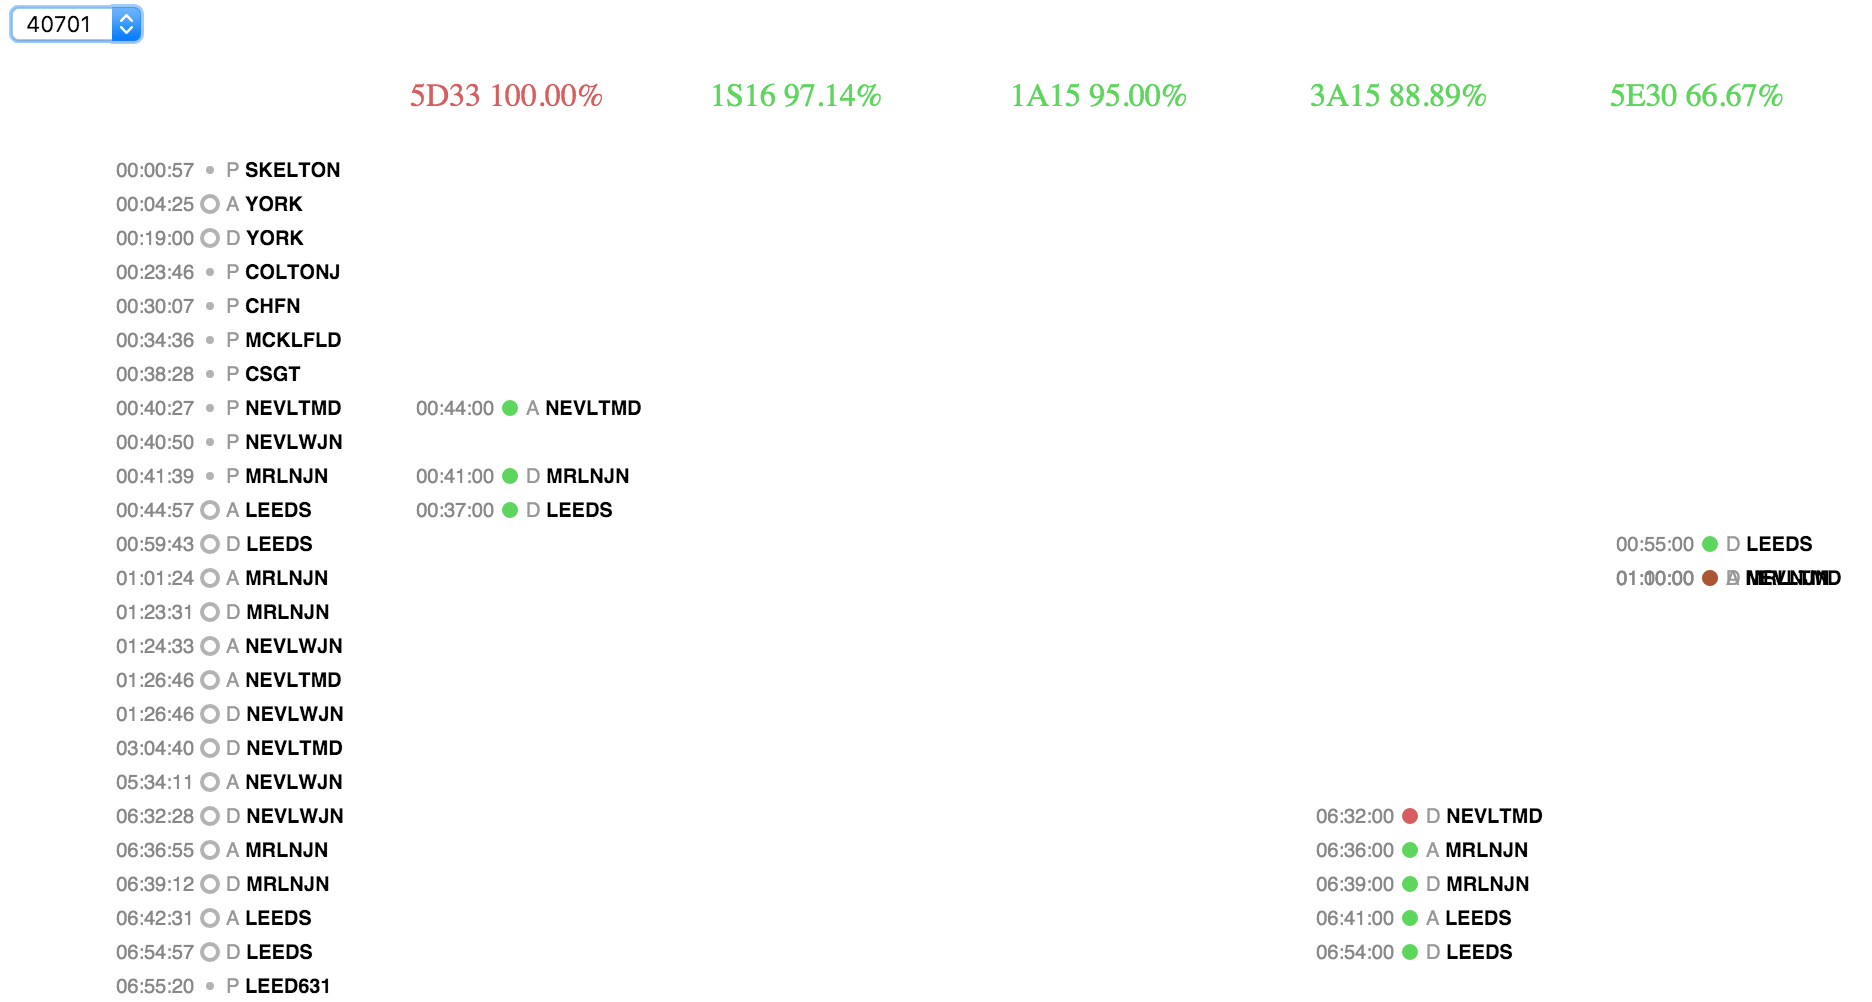
Like the first visualization, the statistical algorithm uses D3.js in order to display the results. The interface looks similar as well. In the top left corner, you can select the gps_car_id of the Rolling Stock you want to analyze. Then the algorithm lists all of the GPS Reports in the first column.
Next, for all services, we compare all of the Trust Reports to the GPS Reports. Using that data, we can calculate how many Trust Reports match with a GPS Report and calculate the probability of a Rolling Stock running the service.
Finally, we display all of the Services with a high enough probability. Every column, which represents a service, lists all of the Trust events and again, a green circle is shown if the Reports match and a red circle if no match is found.
API Endpoints
Our prototype uses two main API endpoints to serve data, one for GPS and the other for TRUST data. These are used to fuel the data visualisations. They are located at /events/gps.json and /events/trust.json
UML
Database Model
Application Model
User Interface
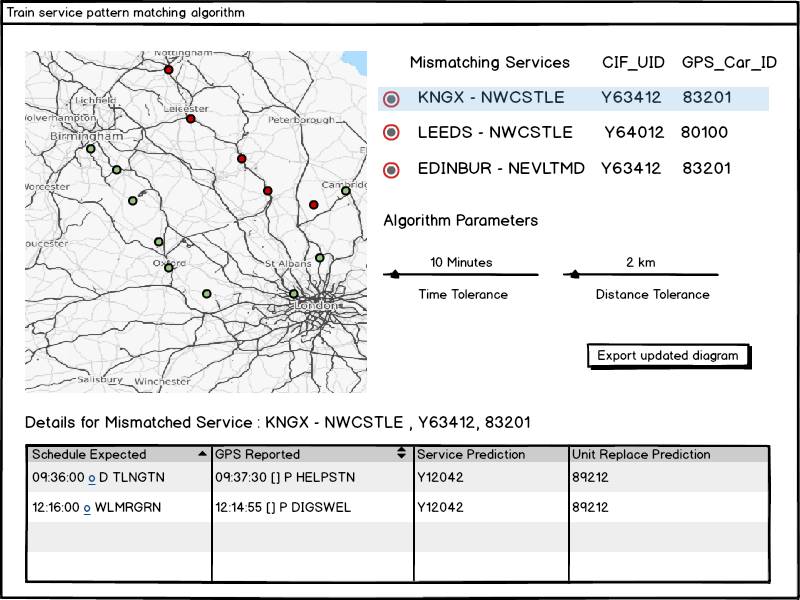
The user interface of our application contains a map that visualises all of the reported data points and colours indicate whether the algorithm has found a match. The section to the right would list all of the units (of rolling stock) that have been identified as not matching their services. The algorithm parameter option allows the user to change the matching algorithms parameters like time and distance tolerance between Tiplocs. The user can select a particular mismatched service and the system will display details of the mismatched reports and it’s predictions.
A rough UI wireframe is shown below:
HCI Considerations
As the client did not have any explicit usability requirements (as the project itself is an algorithm rather than an application), we explored a few UI styles that may help make interpreting the output of the algorithm easier.
The map is a solution to a common problem that we have been experiencing with train services data. It helps the user see the whole picture, as to where the GPS or TRUST reports happened, and what the algorithm has decided. In odd situations where trains loop around the user is also able to see it graphically as opposed to a string of text that doesn’t tell you much.
The right section displays the most important information that the client needs in this project, which is which services aren’t being run by the planned rolling stock. The details pane below will initially be hidden, but once the user selects a particular mismatched service, the details of what the algorithm has found is displayed.
The button that is used to export the corrected diagrams is also easily accessible and the only button on the page to help emphasise the most important feature.
User Testing
We will provide a group of users with background and context and ask them to perform common tasks on the test application and then observe their behaviour. After this we will have a brief interview with them to gather feedback on specific points of the application.
Some open questions we would ask:
- How easy was it trying to find the new corrected diagrams?
- Do you feel like you could easily find mismatched services?
- What do you feel about the representation of data points on the map?
- Are you able to tell what is happening to the services as a whole at a particular time?
As our main target audience for this algorithm are people working in the train industry, our focus would be to test on people in this audience, the most important one being our client.
Testing Strategies
We have researched techniques and tools for testing which we plan to use once we start developing and experimenting with more complex algorithms. Our plan is to automate testing as much as possible, by connecting it to our version control system and testing on every change, so we detect errors early.
We plan to use Travis, which is popular, free and has easy integration with Github for continuous integration.
Below are some of our test plans for Term 2:
Unit Tests
We will have a test suite written for the main algorithm itself which includes:
- The matching of station names and the geographical locations
- The matching of the time within x minutes
- Matching of event type
- Matching headcodes with specific train types and rough destinations
- Matching services to rolling stock with Genius Allocations
Functional Tests
Aside from the algorithm itself, we plan on using Selenium to automatically test the web application.
Once we do get the dataset that outlines what actually happened,that was generated manually by the TOC’s, for the sample data that we were given, we can also write tests that can take multiple data streams and results from historic data to test the accuracy of the algorithm.