System Design
System Architecture
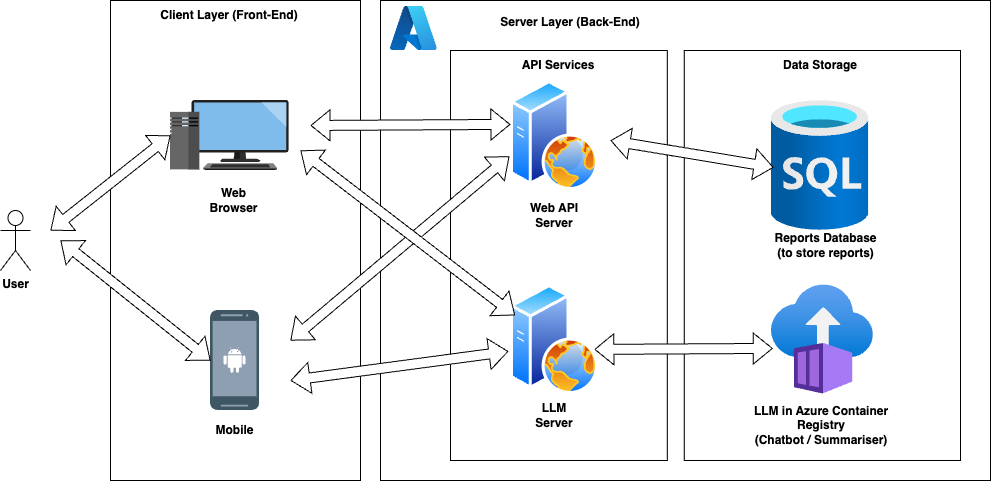
The diagram below represents a simplified system architecture diagram of this project.
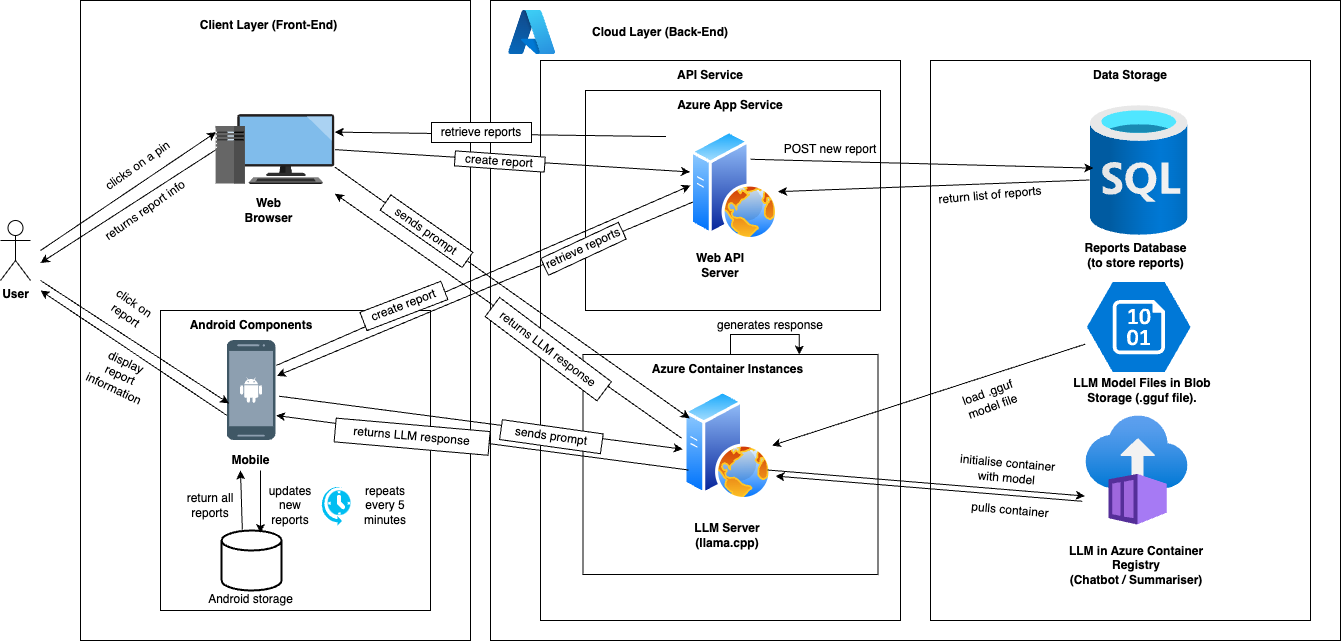
The diagram above is derived from the following system architecture diagram below.
Client Layer (Front-End)
- Web Browser: The user interface for interacting with the application through a web browser
- Android Components: Native Android components for interacting with the application on Android devices
API Service
- Azure App Services: The cloud service hosting the Web API layer
- Web API Service: Receives requests from the client, retrieves reports from Azure Container Instances, generates responses, and returns them to the client
LLM Server (llama.cpp)
- An application running in an Azure Container Instance that uses the llama.cpp library to interface with the language model stored in blob storage
- Receives prompts from the Web API Server, initializes the language model, generates outputs using the model, and returns the outputs to the Web API Server
Data Storage
- MySQL Reports Database: Stores the generated reports from the LLM Server
- Blob Storage: Stores the language model files (.gguf file) used by the LLM Server running in the Azure Container Instance
Site Map
This is the sitemap for the website application for the project.
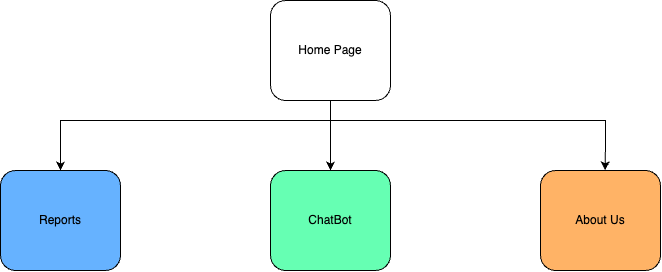
When a user goes to the website, the user is redirected to the main page (Home Page) which contains the map with report pins and a form to add new reports. The user can also go to the Reports page to see the full list of reports. The user also can go to the ChatBot page where the user can communicate with our in-built chatbot, which takes in the user's location, provided the user provides permission through its web browser.
Sequence Diagrams
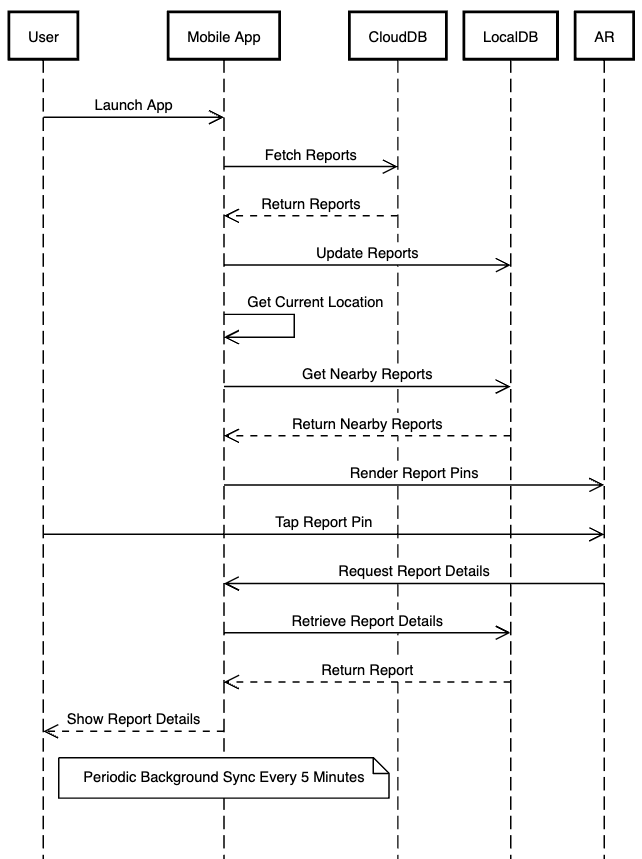
Most of the functionalities of our appliaction can be represented using sequence diagrams.
Android
Retrieving Reports / AR Overlay
Using the Map Screen to View Reports
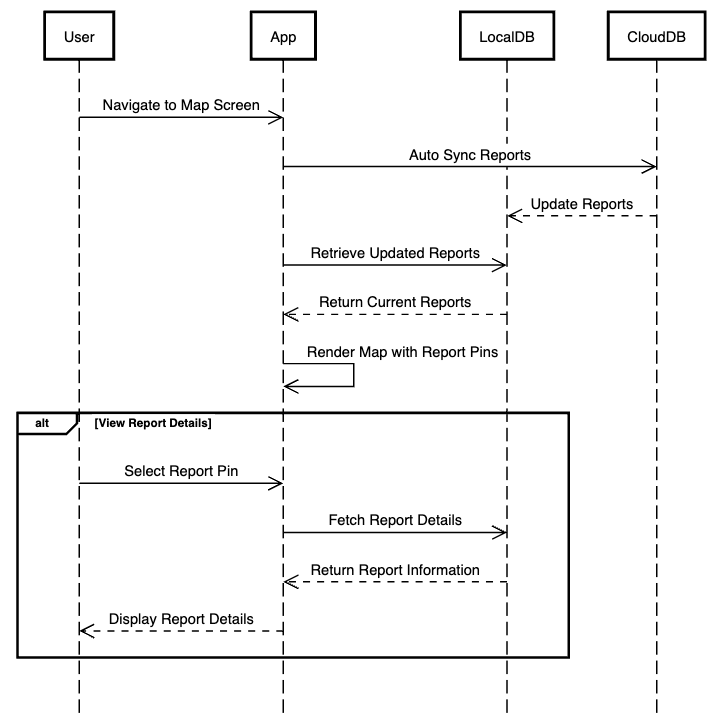
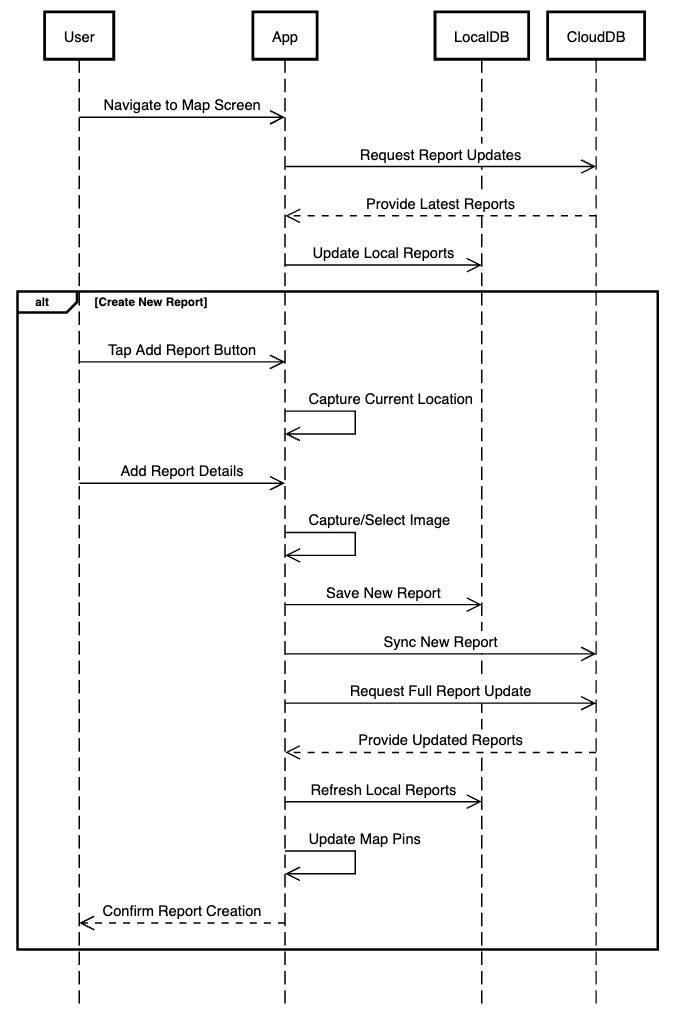
Creating New Reports
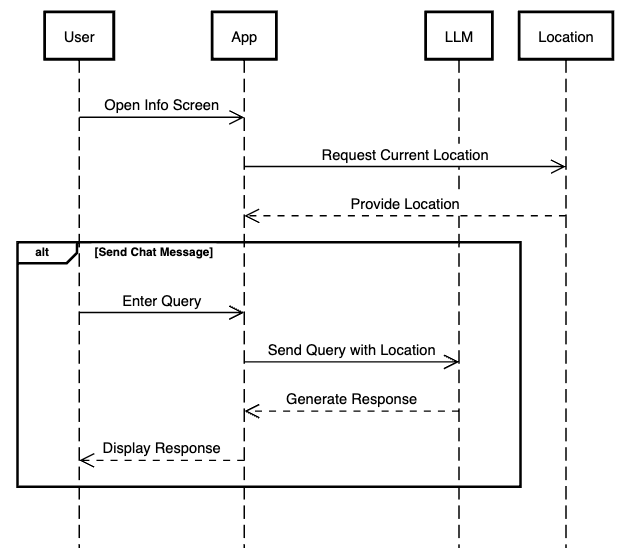
Interacting with ChatBot
Website
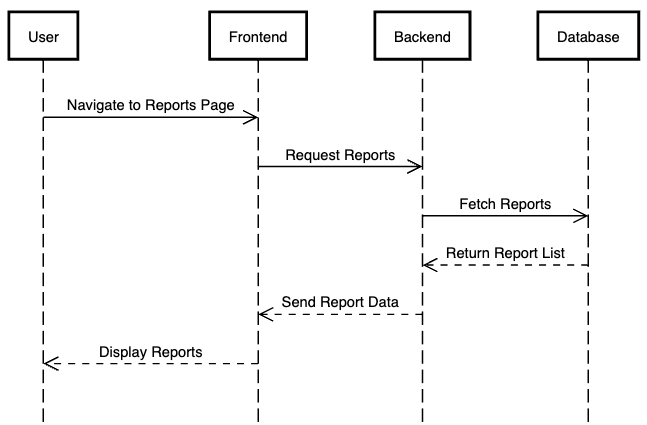
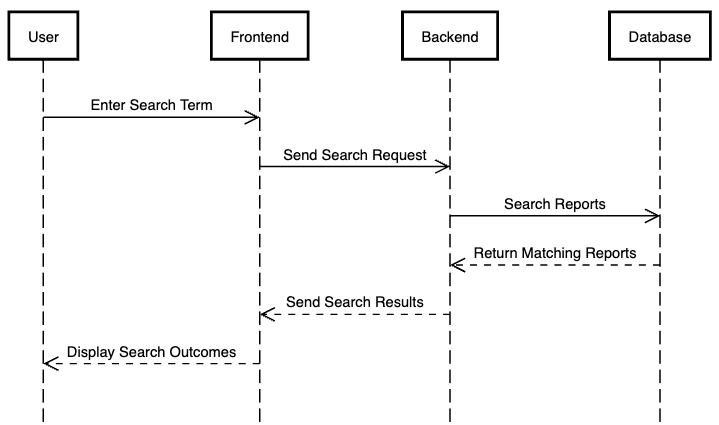
Retrieving Reports
Using the Map Screen to View Reports
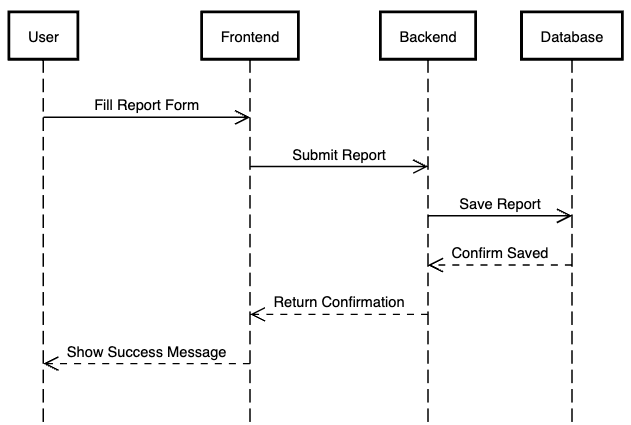
Creating New Reports
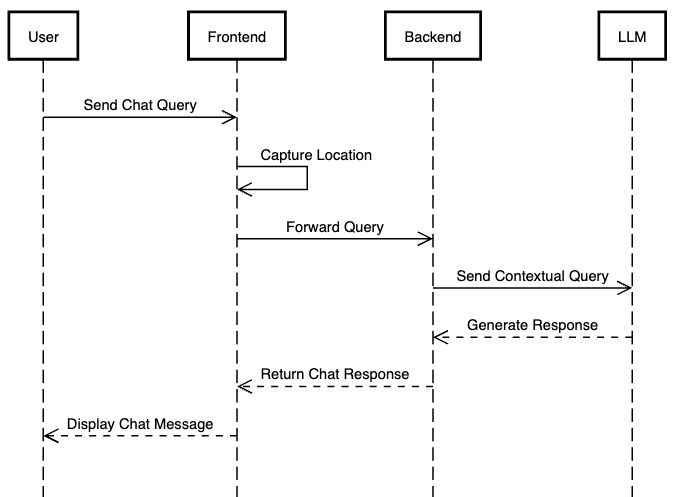
Interacting with ChatBot
Design Patterns
The website uses the Model-View-Controller (MVC) design pattern, a traditional architectural approach common in web development. In this pattern, the Model represents the data and business logic, managing how information is stored, retrieved, and processed. The View is responsible for presenting the user interface, displaying data to the users in a readable format. The Controller acts as an intermediary, handling user interactions, processing input, and coordinating communication between the Model and the View.
The application uses the Model-View-ViewModel (MVVM) design pattern, which is more sophisticated and better suited to complex mobile interfaces. In this approach, the Model still manages the core data and business logic, similar to MVC. However, the ViewModel replaces the traditional Controller, providing a more flexible layer that transforms data and prepares it for presentation. The View binds directly to the ViewModel, allowing for more reactive and dynamic user interfaces. This pattern is particularly advantageous in mobile applications, as it supports more complex user interactions, enables easier testing, and facilitates more responsive and interactive design.
Data Storage
As we store our reports into Microsoft Azure through a MySQL Database. This ER diagram represents the data schema needed for a report to be uploaded to the database.
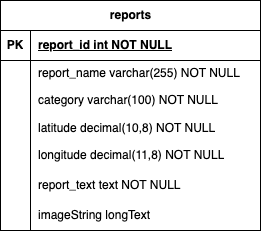
A report will contain its title (report_name), description (report_text), category (category), latitude (latitude), longitude (longitude) and the image (encoded as a data URI with base64-encoding and stored as `imageString`)