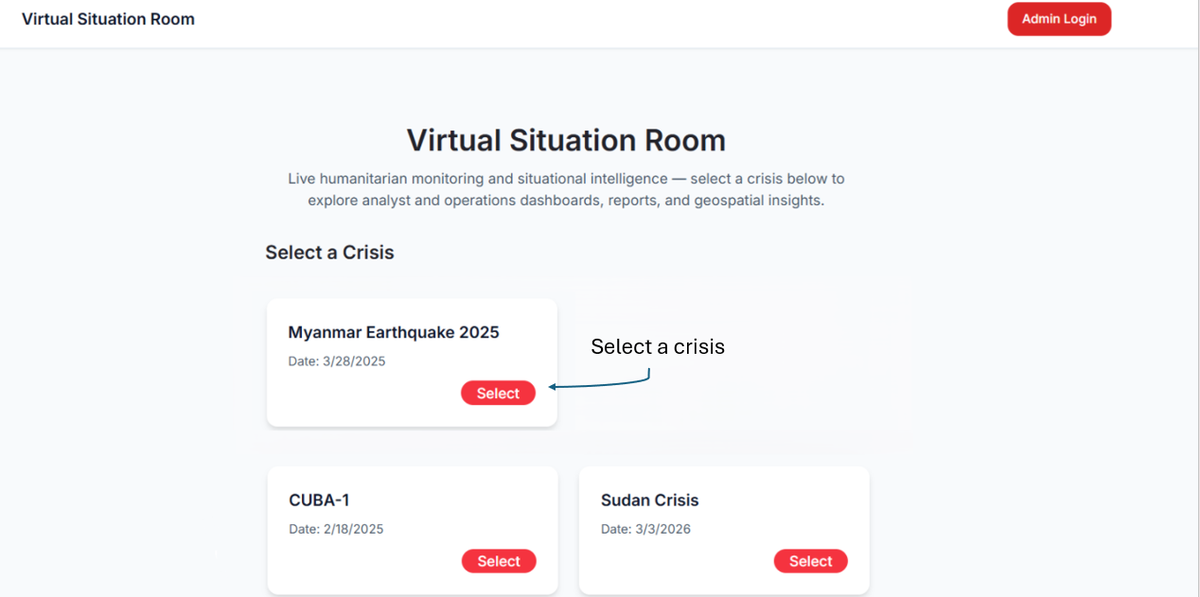
Handles crisis selection, landing, analyst, operations, map, login, and admin pages.
System Design and Technical Structure
This page summarises the underlying system design behind the implemented web application: React, Django and FastAPI services, LangGraph-based report generation, Azure persistence, and the humanitarian data feeds that supply the platform.
Page Map
Jump directly to the main design views.
High-Level Architecture
Django serves the main web API, while FastAPI provides the chatbot interface.
Ingestion, LangGraph orchestration, and language verification turn evidence into report outputs.
Azure PostgreSQL, JSON snapshots, Azure AI Foundry, and external humanitarian feeds support delivery.
1. User-facing layer: React app for crisis selection, landing, analyst, operations, map, login, and admin workflows.
2. Delivery layer: Django REST API (
vsrApp) and the FastAPI chatbot service.3. Processing layer: LangGraph orchestration, data ingestion, and language verification.
4. Data and model layer: Azure PostgreSQL, JSON snapshots, Azure AI Foundry, and humanitarian source feeds.
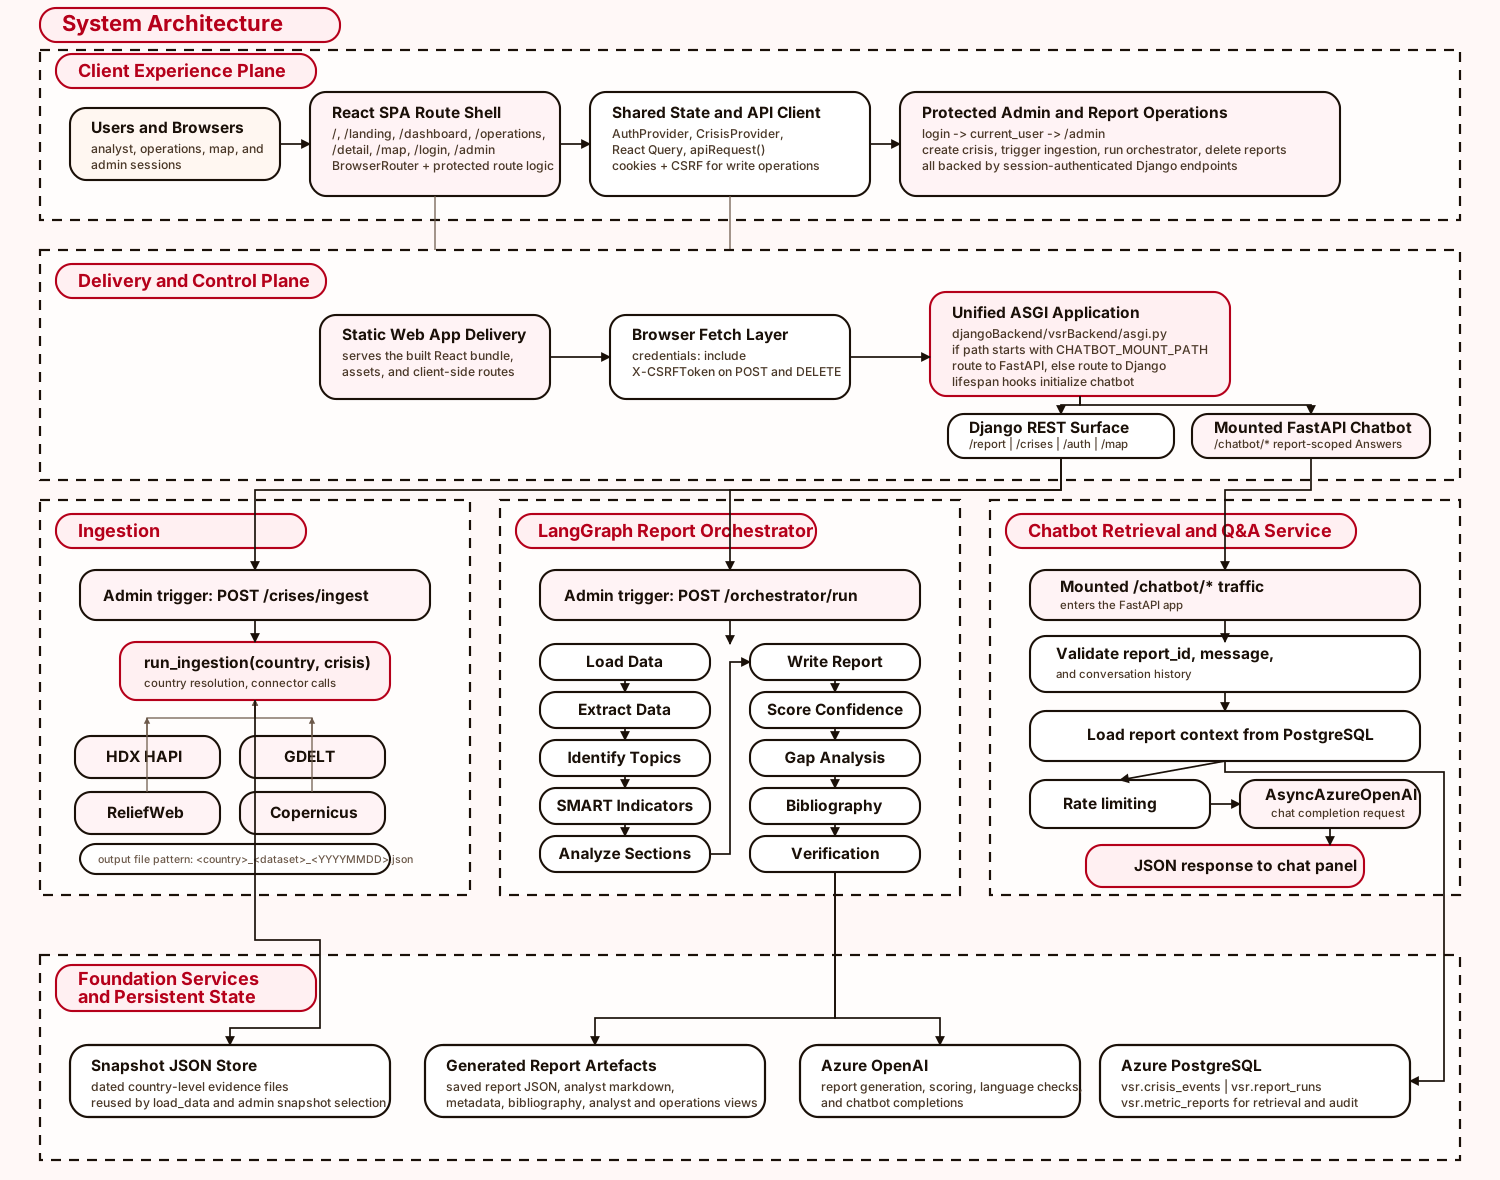
/chatbot/* service. Admin-triggered ingestion and orchestration write dated evidence snapshots and persisted report artefacts that are later reused by both the dashboard and the chatbot.
Frontend and API boundary
The React app owns routing and presentation, while Django provides the main browser-facing API, session authentication, admin controls, and report retrieval endpoints. The chatbot stays as a separate service, but it still reads from the same stored report outputs.
Processing and persistence path
Behind the API, the ingestion agent collects dated evidence, the LangGraph pipeline builds the report outputs, and the language layer checks wording before persistence. The final artefacts are stored once and then reused by both the frontend and the chatbot.
Azure Deployment View
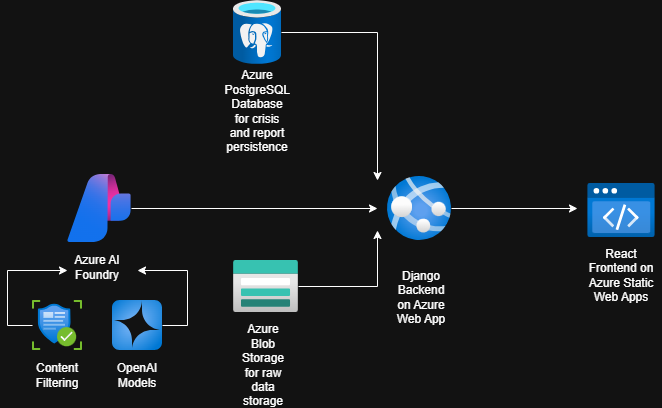
This view keeps the full runtime path visible, from hosted UI delivery down to storage, models, and source inputs.
Read the diagram from top to bottom: hosted clients sit at the top, application and processing services sit in the middle, and storage, model, and source dependencies sit underneath.
Presentation layer
React frontend on Azure Static Web Apps
Serves the crisis selection flow, landing page, analyst and operations views, map route, login page, and protected admin interface.
Built as a single React application using the IFRC-GO UI component library.
Application services
Django backend on Azure Web App
Handles authentication, report retrieval, admin workflows, and orchestration triggers.
This is the main browser-facing gateway for the platform.
FastAPI chatbot service
Offers conversational access to stored report outputs without duplicating the reporting pipeline.
Orchestration and processing
Data ingestion agent
Collects external humanitarian evidence and writes reusable dated snapshots.
LangGraph agent orchestrator
Turns snapshots into structured sections, scores, bibliography entries, and delivery views.
Language verification layer
Applies terminology and consistency checks before final persistence.
Data, model, and source dependencies
Azure PostgreSQL
Stores crisis records, report runs, metric reports, and the structured outputs consumed by the frontend and chatbot.
Azure Blob Storage and JSON snapshots
Preserves raw evidence and reusable snapshots so report generation can start from known source states.
Azure AI Foundry
Hosts the model endpoints used during generation, scoring, and refinement.
Includes: content filtering and OpenAI models.
Humanitarian data sources
The ingestion layer draws evidence from the project source set and prepares it for downstream orchestration.
Sources used: GDELT, HDX HAPI, ReliefWeb, and Copernicus.
Ingestion path
External feeds are collected by the ingestion agent and stored as reusable snapshots.
Generation path
The orchestrator consumes snapshots, calls Azure AI Foundry, applies language checks, and writes the outputs to PostgreSQL.
Delivery path
Django exposes stored report artefacts through secure API contracts that the React app consumes.
Chatbot path
The FastAPI chatbot reuses the persisted report content so responses stay aligned with stored outputs.
Agentic Pipeline
Phase 1. Load and structure the evidence
Stages: load_data, extract_data, identify_topics
The workflow begins by loading the chosen country snapshot, extracting structured facts from raw source material, and identifying the main crisis topics and problem areas that will frame the rest of the report.
Phase 2. Build the report narrative
Stages: generate_indicators, analyze_sections, write_report
Once the crisis themes are known, the pipeline generates SMART indicators, drafts the analytical sections, and assembles them into the IFRC report structure with ordered sections and source citations.
Phase 3. Score confidence and expose uncertainty
Stages: score_confidence, analyze_gaps, generate_bibliography
The system then scores impact and confidence, records important evidence gaps, and compiles the final bibliography so the output is transparent rather than being a black-box summary.
Phase 4. Prepare the final delivery views
Stages: generate_dual_view, verify_language
The completed report is transformed into stable analyst and operations views, then passed through language verification to align terminology and tone with IFRC-style reporting.
Why the pipeline is staged
The workflow is deliberately broken into small named stages because the project has to handle raw news content, structured humanitarian datasets, score generation, bibliography generation, and audience-specific output views. Keeping those responsibilities separate makes the pipeline easier to test and easier to debug when one part of the output is wrong.
What the pipeline produces
By the end of the run, the system has produced ordered report sections, confidence scores, evidence-gap summaries, a bibliography, and two stable output views: one for analysts and one for operations users. Language verification is applied at the end so the persisted report reads consistently and follows IFRC-style terminology.
Site Map and Runtime Interfaces
The frontend and API were designed around a small number of clear route groups instead of one large monolith.
Frontend Route Gallery
Click a frontend route to preview the relevant implemented page and its role in the user journey.
Selected route
/
Crisis selection
Permission and Session Model
- Public retrieval endpoints serve report content, references, metadata, and map context without admin rights.
/adminis guarded in the frontend byProtectedRouteand in Django byIsAdminUser.- Session login uses
/auth/login,/auth/logout,/auth/user, and explicit CSRF acquisition via/auth/csrf. - Long-running ingestion and orchestrator triggers return
202 Acceptedand run in background daemon threads so the UI stays responsive.
| API Group | Representative Endpoints | Consumer | Contract Role |
|---|---|---|---|
| Report retrieval | /report/analysis, /report/analyst, /report/operations, /report/references, /report/metadata, /report/how-sure, /report/whats-new |
Dashboard, operations view, detail page, and “What’s New” components. | Serve audience-specific report artefacts while keeping a shared metric/property query model. |
| Crisis and orchestration admin | /crises/create, /crises/ingest, /crises/delete, /crises/delete-reports, /orchestrator/data-status, /orchestrator/run |
Protected admin panel. | Control crisis lifecycle, data snapshot reuse, and report generation without exposing admin actions publicly. |
| Authentication | /auth/csrf, /auth/login, /auth/logout, /auth/user |
Auth context and protected routes. | Provide session state, CSRF safety, and role information for secure browser-based admin use. |
| Map and context utilities | /countries, /map/copernicus-layers, /map/copernicus-activations, /map/crisis-country-copernicus, /crises/country-from-crisis |
Country selection, map page, and crisis-context lookups. | Augment narrative reports with geospatial context and crisis-country resolution. |
Data and Storage Design
The system deliberately stores both reusable raw snapshots and normalised generated artefacts.
Snapshot storage
The ingestion layer writes dated JSON files into backend/data_ingestion_agent/output so report generation can
start from a known evidence snapshot rather than depending on live external APIs every time.
Operational data in PostgreSQL
Reference countries are stored in vsr.countries, crisis records live in vsr.crisis_events,
and generated outputs are split across vsr.report_runs and vsr.metric_reports.
This keeps crisis lifecycle data separate from the report artefacts produced over time.
Why both storage forms are needed
JSON snapshots preserve the original evidence used for a run, while PostgreSQL stores the processed outputs that the frontend and chatbot actually consume. Keeping both gives the project traceability and makes historical comparisons such as “What’s New” possible.
Shared PostgreSQL access pattern
Domain tables are intentionally accessed through shared PostgreSQL helpers rather than the Django ORM.
This keeps ingestion, Django retrieval, and the FastAPI chatbot on the same persistence model, but it also means
SQL contracts must stay aligned across services.
Database ER Diagram and Schema Summary
The persisted domain model in main centres on four PostgreSQL tables linked to crisis context, report runs, and stored report outputs.
Reference table
vsr.countries
Primary key: iso3_code
Stores country name, region, and active status for crisis validation.
Crisis table
vsr.crisis_events
Primary key: id | Business identifier: event_id
Stores crisis metadata, location, scores, description, and the linked country_iso3.
Run table
vsr.report_runs
Primary key: id
Stores the parent run, keeping crisis context and run-level metadata together.
Output table
vsr.metric_reports
Primary key: id
Stores the final metric/property outputs, including sections, dual_view, bibliography, and metadata.
Relationship note
In the running system,
report_runs.event_id links to the numeric crisis record in
vsr.crisis_events.id. The column name is historical, but it behaves as the crisis-event link for downstream report storage.
vsr.countries
Purpose: Reference table for valid countries used in admin forms and crisis validation.
Key fields: iso3_code, name, region, is_active.
Used by: Crisis creation, country dropdowns, and country resolution logic.
vsr.crisis_events
Purpose: Stores the crisis record that anchors the rest of the reporting lifecycle.
Key fields: id, event_id, crisis, event_type, event_date, country_iso3, country_name, description, metadata, timestamps.
Used by: Crisis overview, country resolution, admin actions, and report-run creation.
vsr.report_runs
Purpose: Represents a single orchestrator run for a selected crisis context.
Key fields: id, event_id, crisis, metadata.
Used by: Grouping related report artefacts and preserving run-level provenance.
vsr.metric_reports
Purpose: Stores the generated output for a specific metric and property pair.
Key fields: id, report_run_id, crisis, metric, property, sections, dual_view, bibliography, metadata, created_at, updated_at.
Used by: Analyst, operations, detail, references, metadata, and chatbot retrieval flows.
Runtime Sequence and Design Trade-Offs
This flow shows how the layers interact during a normal report-generation cycle.
End-to-End Runtime Sequence
- An admin creates or selects a crisis, which gives the platform an
event_id, country, and crisis context. - The admin can trigger ingestion; Django resolves the country and either reuses existing snapshots or starts a background ingestion thread.
- The admin selects a metric, property, and optional snapshot date, then triggers the orchestrator through
/orchestrator/run. - Django validates the request, returns
202 Accepted, and starts the report generation thread without blocking the browser. - The LangGraph workflow loads the relevant snapshots, generates sections, scores, gaps, bibliography, and dual views, then verifies language.
- Generated artefacts are stored in PostgreSQL and exposed through public retrieval endpoints used by dashboard, detail, operations, map, and chatbot flows.
Design Patterns Used
- Pipeline orchestration: LangGraph gives each transformation stage a named node and a typed shared state.
- Facade API: Django presents a small set of stable report endpoints instead of exposing internal orchestrator complexity to the frontend.
- Adapter / normalisation layer: helpers sanitise mojibake, normalise key casing, and shape data for analyst/operations views.
- Guarded admin boundary: frontend route protection and backend permission decorators enforce the same admin-only rules.
Why this design works for the project
Separating ingestion, orchestration, and delivery keeps the platform manageable even though it combines external data collection, expensive model calls, authentication, and multiple audience views. The same structure also made it easier for the team to test individual layers rather than treating the whole system as one opaque workflow.
Main trade-offs
The design is more maintainable than a monolithic script, but it introduces more interfaces that must stay aligned. Session-based admin controls improve safety, but the frontend must manage CSRF correctly. Background execution keeps the UI responsive, but it makes monitoring and status reporting more important during long runs.
Packages and API
Backend packages, data ingestion sources, and Azure platform services
Backend — LangGraph
LangGraph orchestrates the agent pipeline for report generation, staging named workflow nodes and shared typed state.
Documentation: LangGraph overview (LangChain OSS)

Data ingestion
Data ingestion sources used by the ingestion agent (stacked view):
-

GDELT 2.0
Used to retrieve relevant articles and media reports via BigQuery queries to surface timely news evidence for the ingestion agent. GDELT project
-
ReliefWeb
Retrieves situational reports and operational updates used to corroborate events and extract narrative context. ReliefWeb
-
HDX HAPI
Provides structured humanitarian datasets (population, needs, assessments) through the HDX API for quantitative evidence ingestion. HDX
-

Copernicus
Supplies satellite-derived datasets and imagery used for geospatial context, and Area-of-Interest overlays. Copernicus
Azure Services
- Azure PostgreSQL Database — stores crisis events, report runs, metric reports, references, and the structured outputs consumed by the dashboard and chatbot services.
- Azure Blob Storage — stores JSON snapshots, raw evidence, and ancillary assets so reports can be regenerated from known source states.
- Azure AI Foundry — provides model endpoints, content-filtering, and managed inference used during report generation and language verification.
- Azure App Service (Web App) — hosts the Django backend, handles authentication, admin workflows, and orchestrator trigger endpoints.
- Azure Static Web Apps — hosts the React frontend and serves static assets
Frontend
React frontend on Azure Static Web Apps. Built with React and the IFRC-GO UI component library to provide consistent, accessible UI components and patterns across analyst and operations views.