With one of the key requirements by the IFRC being a clean, user-friendly dashboard, it was incumbent upon the team to investigate issues with the existing prototype provided by the IFRC, and identify areas of improvement as well as total redesign.
This section illustrates the UI Design process that took place during the development of the Virtual Situation Room. It outlines the discovery of issues with a current prototype, the identification of key design principles, the iteration of user interface designs, and user acceptability.
Page Map
Quick links to sections on this page.
Scope of UI Design: Why the Analyst View?
The Analyst View as the Primary Design Focus
A core project goal set by the IFRC is a clean, professional, and user-friendly dashboard that minimizes cognitive load for analysts operating under time pressure. Consequently, the UI design process centres on the Analyst View — the primary interface through which humanitarian analysts consume structured crisis reports, inspect confidence scores, trace source references, and navigate geospatial context.
All other content views in the VSR, such as the Detailed Report View and the Operations View, follow directly from the design language and component library established in the Analyst View. Ensuring the Analyst View is clear, navigable, and information-dense therefore has a compounding positive effect across all report-consumption pages.
Supporting and Navigational Pages
Beyond the core report views, the VSR also includes a set of informative and navigational pages: the Landing Page, Home Menu, and Admin Panels. These pages serve purely functional and informational purposes — orienting users, providing entry points, and enabling protected administrative workflows — rather than being primary sites of analytical work.
Because these pages do not carry the same information density or user experience complexity as the Analyst View, they do not require the same iterative UI design process. Their layouts were kept intentionally minimal and consistent with the IFRC GO component library to maintain visual coherence without introducing unnecessary design overhead.
Discovering User Issues with an Existing Prototype
Gathering Requirements
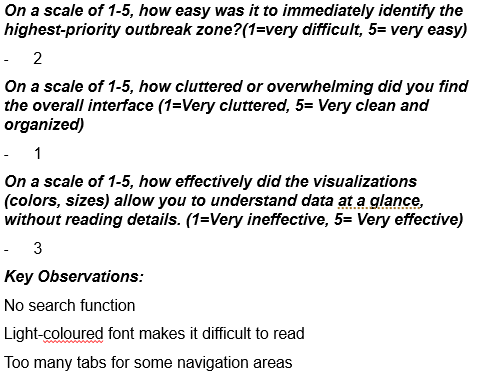
To investigate the issues with the existing prototype provided by the IFRC, the team conducted a series of 10-minute-long observations with volunteer users. Given one of two roles, either volunteers or information analysts, users were given a list of tasks to accomplish by navigating through the platform. These tasks differed for both roles, and the short timeframe of 10 minutes helped mimic the high-pressure environment that both user types work in.
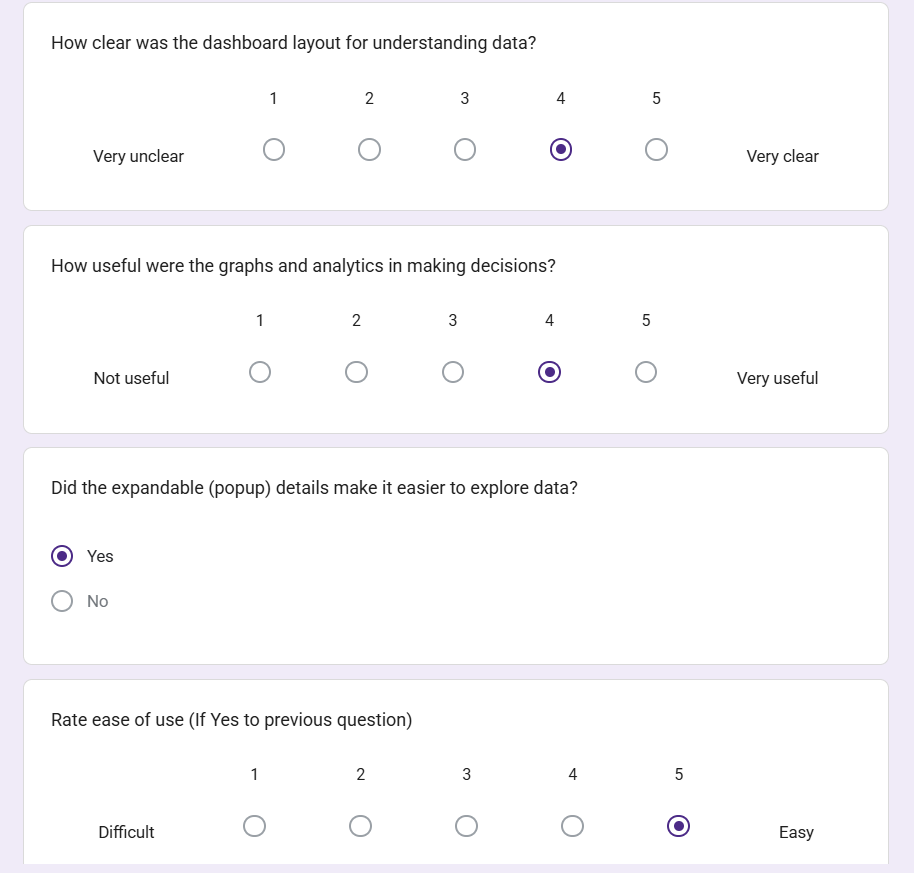
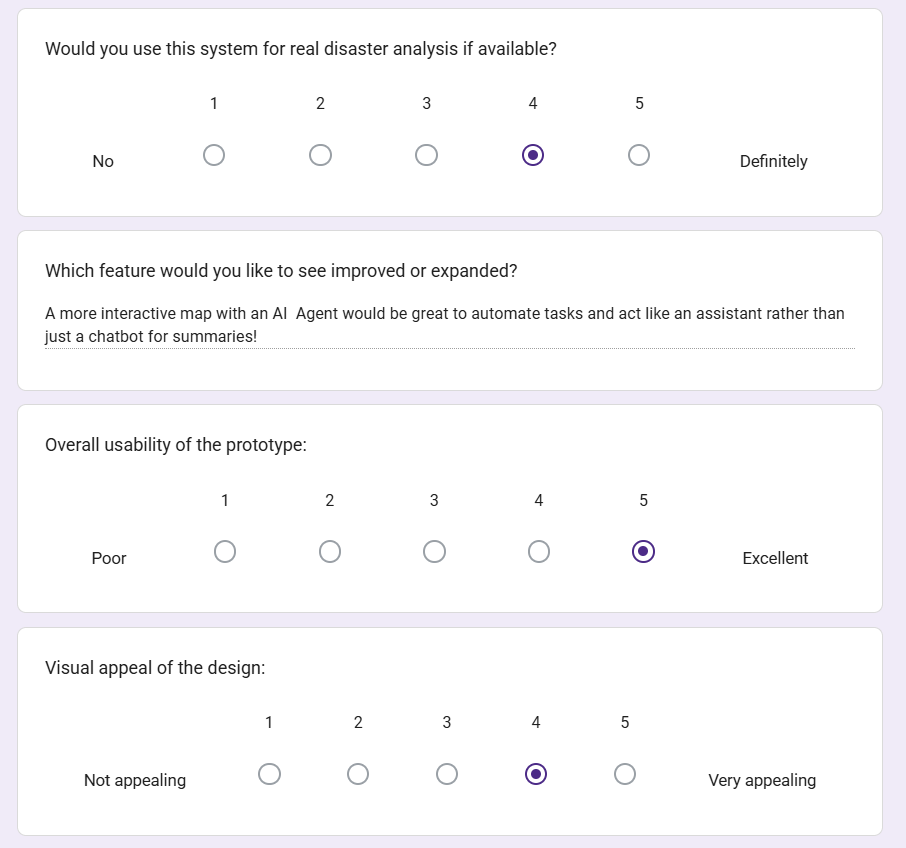
The observation was followed by a structured questionnaire, as shown in Figure 1 below, providing quantitative evidence on user perceptions of the existing prototype, while the observations captured qualitative evidence of usability strengths and pain points. This approach overcomes the limitations of using either method alone by validating subjective ratings with objective behaviour. The research enabled the team to identify key design principles to focus on when sketching and iterating upon an interface design.
Design Resolutions
Following the user testing, the team identified the following design principles to be of importance for the Virtual Situation Room:
Aesthetic and Minimalist Design
Flexibility and Efficiency of Use
User Control and Freedom
These principles would contribute to a user interface that is user-friendly and fast to navigate, matching the requirements provided by our project partners.
Following these principles, and the user testing results, the team identified relevant design problems through heuristic evaluation, and iterated upon their solution throughout the design process.
Figure 1: Questionnaire for an 'Information Analyst' user role
Sketches and Prototypes Evolution: Images
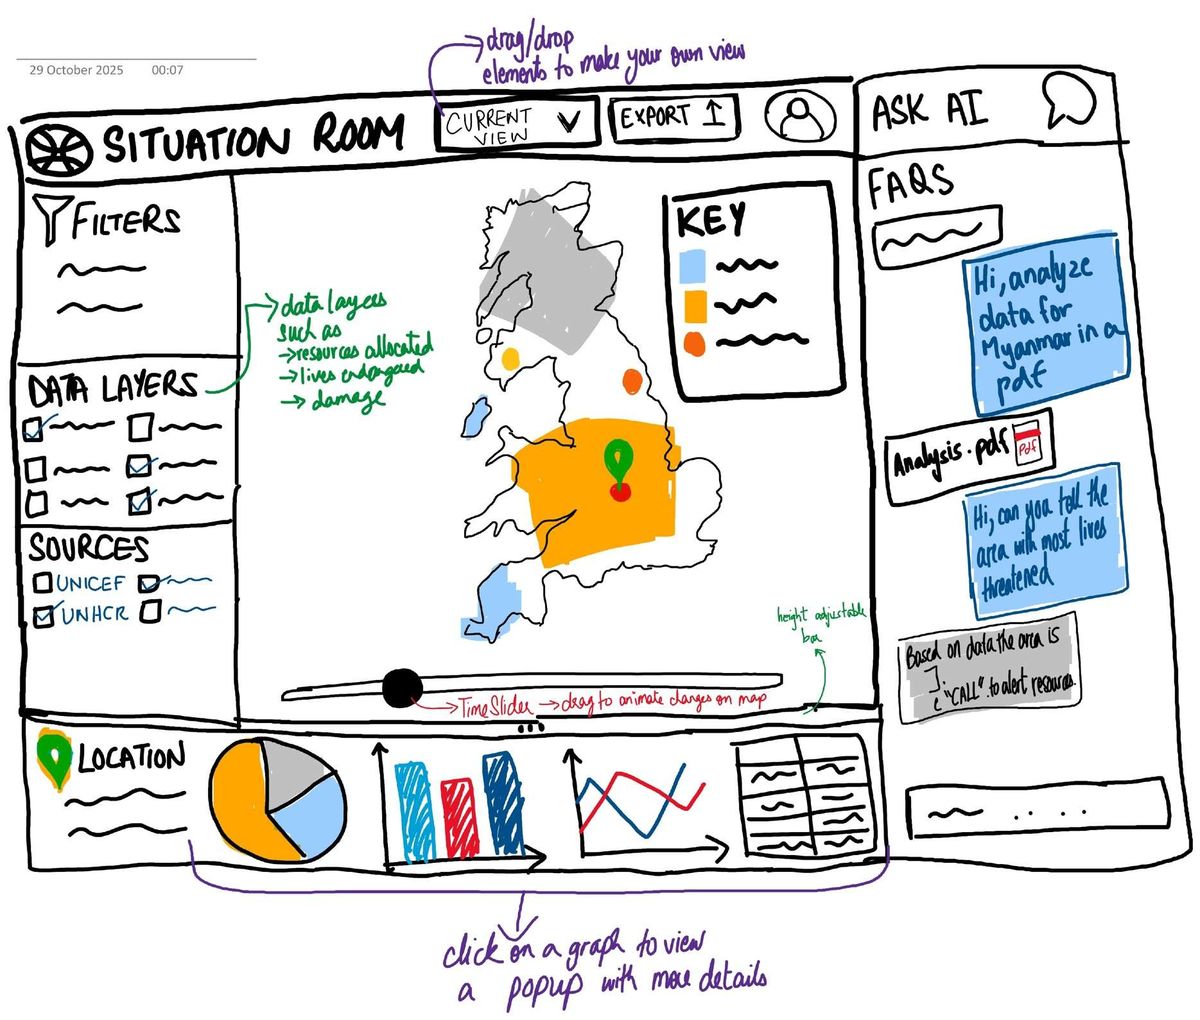
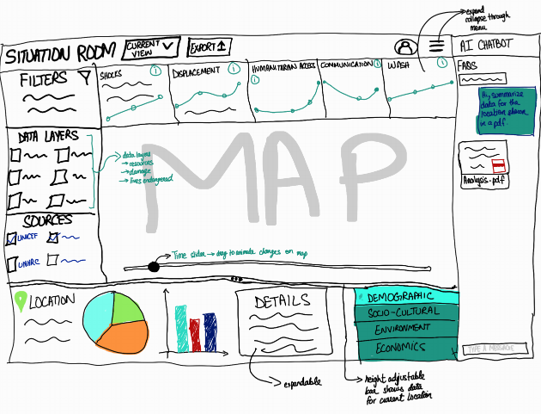
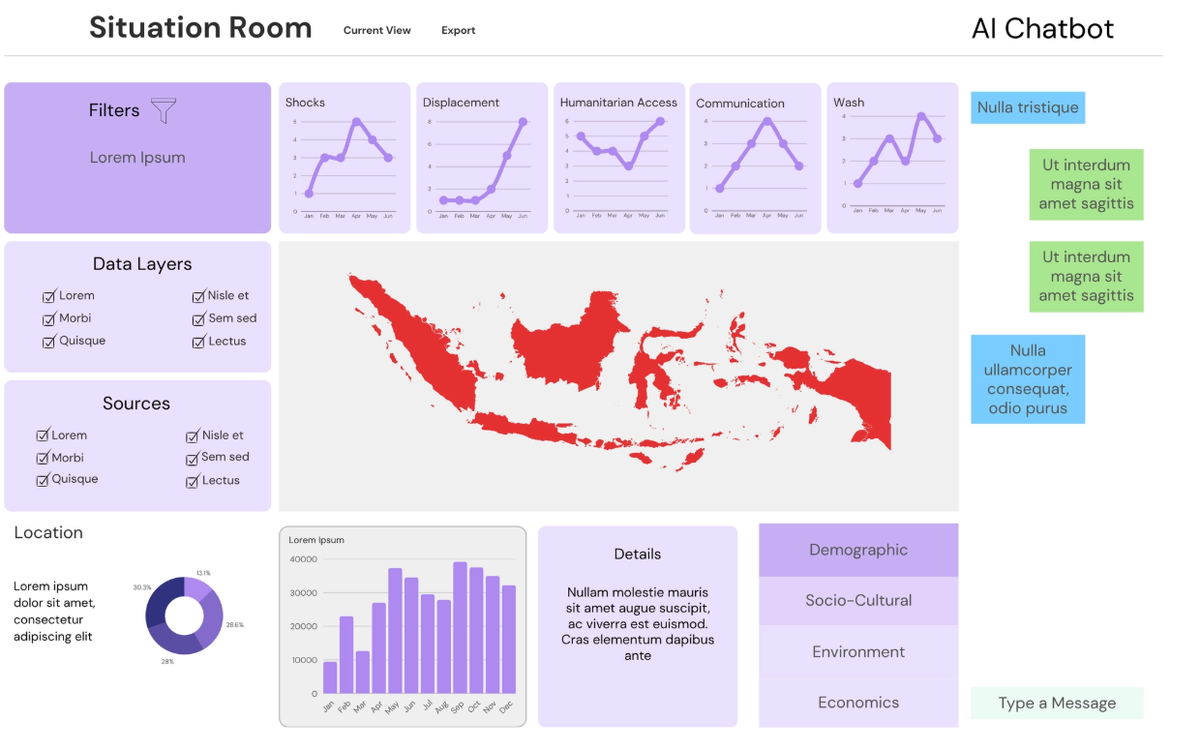
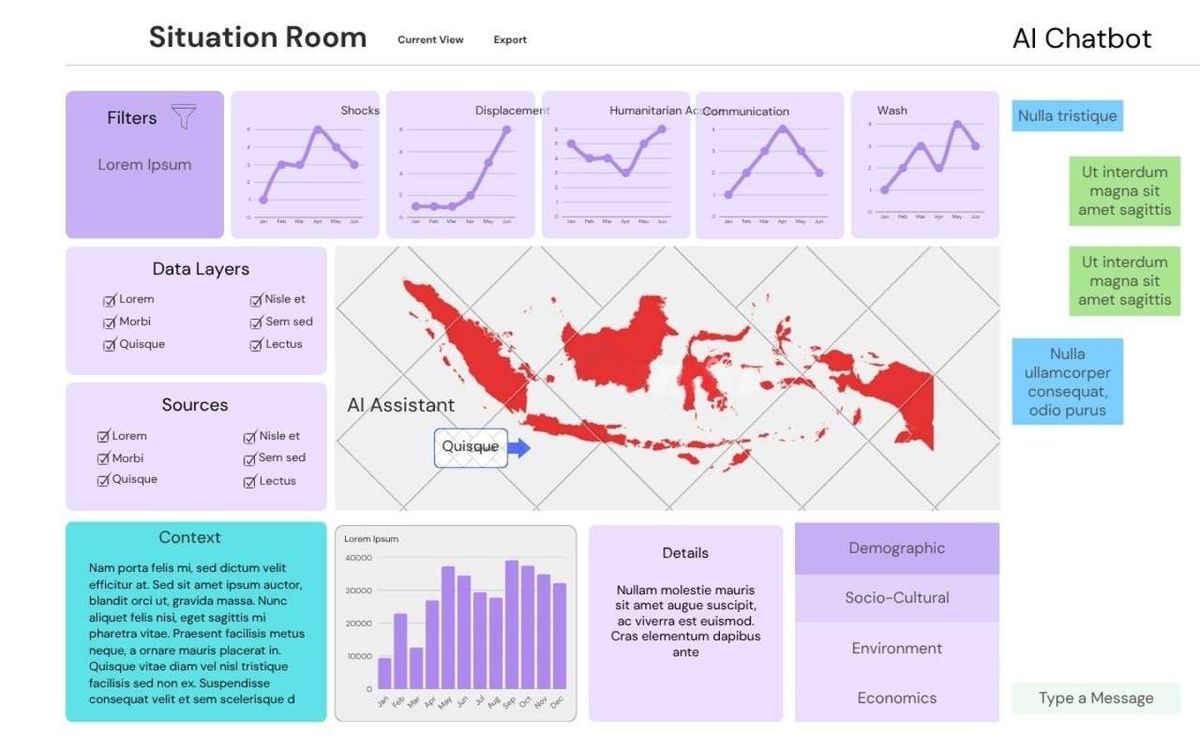
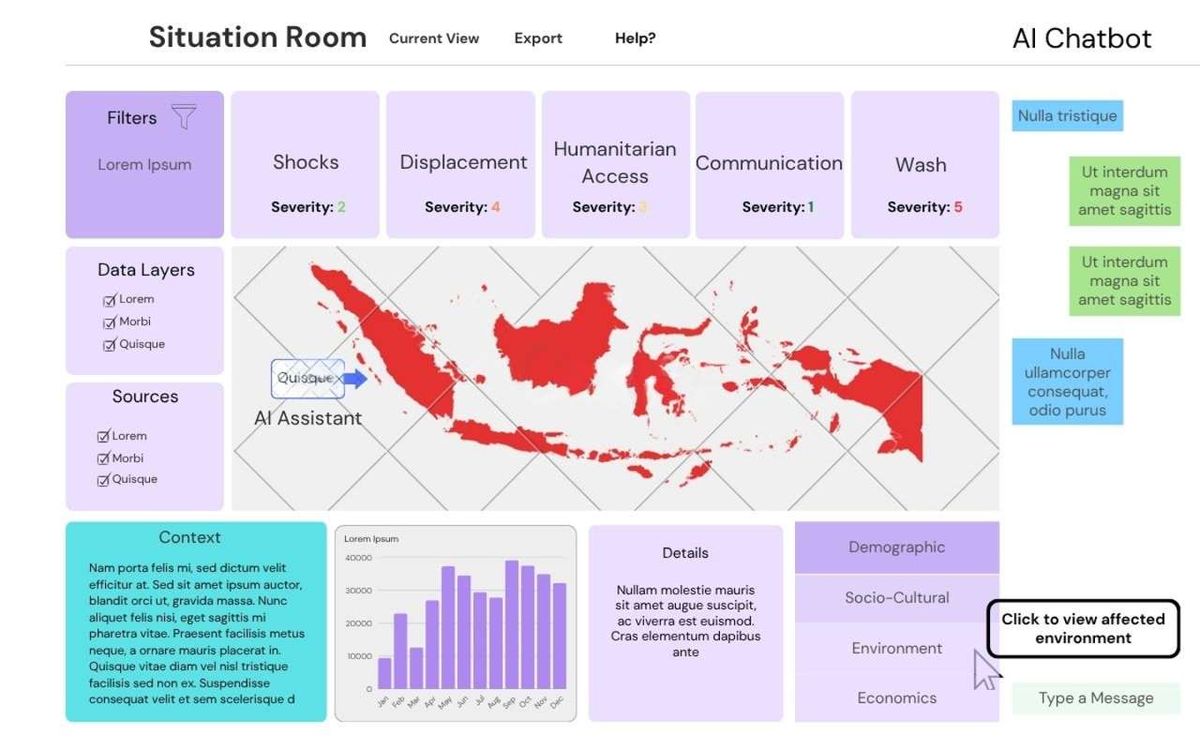
Sketches were then drawn up for the 'Analyst View' and 'Operations View' of the dashboard, with repeat user testing after each sketch to identify necessary changes and evaluate the changes made. This process was then repeated for prototyped webpages to explicitly identify usability and user experience changes that would need to be made. The figures below are the sketches and prototypes for the 'Analyst View' of the Virtual Situation Room, depicting the iterative design process that occurred. The Analyst View has been chosen as it is the primary dashboard view, contains the most detail, and was the focus of the design process.
Click any image to open it at full resolution. Click numbered pins to read feature annotations.
Sketch 1
Navigation Layout
Drop-down menus enable structured, hierarchical access to report sections, reducing the visual footprint of the navigation bar.
Boxed Components
Distinct bordered panels separate information domains, reinforcing separation of concerns and reducing cognitive load.
Analyst View: Sketch 1
Sketch 2
Persistent Navigation Bar
A dedicated top nav consolidates page structure around Analyst-only content, reducing context-switching overhead.
View Toggle
A toggle button lets users switch between the Analyst View and Operations View, supporting User Control and Freedom without cluttering the default layout.
Analyst View: Sketch 2
Prototype 1
Routed Navigation
Page-level routing abstracts granular detail into separate views, keeping the Analyst View focused and uncluttered.
Collapsible AI Chatbot
A show/hide toggle for the chatbot panel frees screen real estate when the feature is not actively in use, improving spatial efficiency.
Analyst View: Prototype 1
User Consultation after Prototype 1: Following Prototype 1, the team returned to user testing with a dedicated questionnaire focused specifically on the 'Analyst View'. Users evaluated navigability, information hierarchy, cognitive load, and map usability. The structured feedback gathered here directly guided the additions and layout refinements seen in Prototype 2 — most notably the introduction of the crisis context section and geospatial location pins.
Crisis Context Panel
A dedicated context section provides analysts with immediate situational clarity, reducing the need to consult external sources.
Geospatial Location Pins
Map pins highlight areas of impact, giving analysts instant geographic orientation and reducing cognitive effort needed to interpret crisis scope.
Analyst View: Prototype 2
Heuristic Evaluation: After Prototype 2, the team conducted a formal heuristic evaluation against Nielsen's 10 Usability Heuristics. Three issues were identified, each mapped to a specific heuristic and design principle. The evaluation findings were discussed with project partners and directly shaped the changes implemented in Prototype 3, including the consolidation of left-panel sections and the expanded map view.
Problem No.
Description
Heuristic
Solution
Severity (0–4)
1
The Analyst Interface contains headers with graphs. Too many figures can make the dashboard look cluttered and overwhelming.
Aesthetic and Minimalist Design
Remove the graphs from the headers, and add more readable confidence scores instead.
2
2
The Volunteer Interface doesn't highlight digestible action points for the user to directly implement.
Flexibility and Efficiency of Use
Add a suggestions tab providing step-by-step action points to resolve a certain issue.
2
3
The interactive map lacks visual differentiation between severity levels, making it difficult for analysts to quickly identify the most critical areas of impact at a glance.
Visibility of System Status
Add color-coded severity overlays and an interactive legend to the map, enabling analysts to immediately identify high-priority regions without additional interpretation.
3
Prototype 3
Condensed Filter Panel
Left-panel sections are shortened following heuristic finding #1 (Aesthetic & Minimalist Design), removing visual noise without losing functionality.
Expanded Map Area
The map grows to fill the reclaimed space, improving spatial orientation — directly addressing heuristic finding #3 (Visibility of System Status).
Basic information architecture and navigation concepts.
Enables simpler navigation by way of drop-downs and boxed components for separation of concerns.
Improved navigation through the 'Analyst View' while also reducing cognitive load.
Sketch 2
Added a navigation bar for a further abstracted view, focusing on Analyst requirements only, with other user views accessible via a toggle button.
Consolidates the webpage on fewer topics, while further reducing cognitive load by abstracting away details irrelevant to an Information Analyst.
Provides 'User Control and Freedom' by allowing the user to navigate between different views i.e. Analyst View and Operations View, for different levels of information complexity.
Prototype 1
Initial wireframe based off of Sketch 2. Changes are mostly technical, with redirection to different views, as well as further toggling for popup components like the AI Chatbot.
Further redirects allows the webpage to abstract even more information away into other webpages, allowing users to focus on relevant data only in the 'Analyst View'. Toggles to show/hide components like the AI Chatbot frees up space when these features are not in use.
Iterates upon the 'User Control and Freedom' principle discussed above.
Prototype 2
The 'Analyst View' now contains a context section. The interactive map also contains location pins, highlighting areas of impact.
The context provides analysts with clarity, with the location pins improving map readability as analysts can now visualize where the crisis is occurring geographically.
Improved clarity about the humanitarian crisis being analysed, which reduces the user's need to search through other sources. The improved map readability also reduces user frustrations with using the map, which is one of the more complex information components in the dashboard.
Prototype 3
Sections on the left such as filters have been shortened, with the map being expanded to take up the empty space.
This improves readability due to the map being a key component.
Users are able to navigate the map more easily, improving the user experience in extracting information from it.
Dashboard Evolution: Images
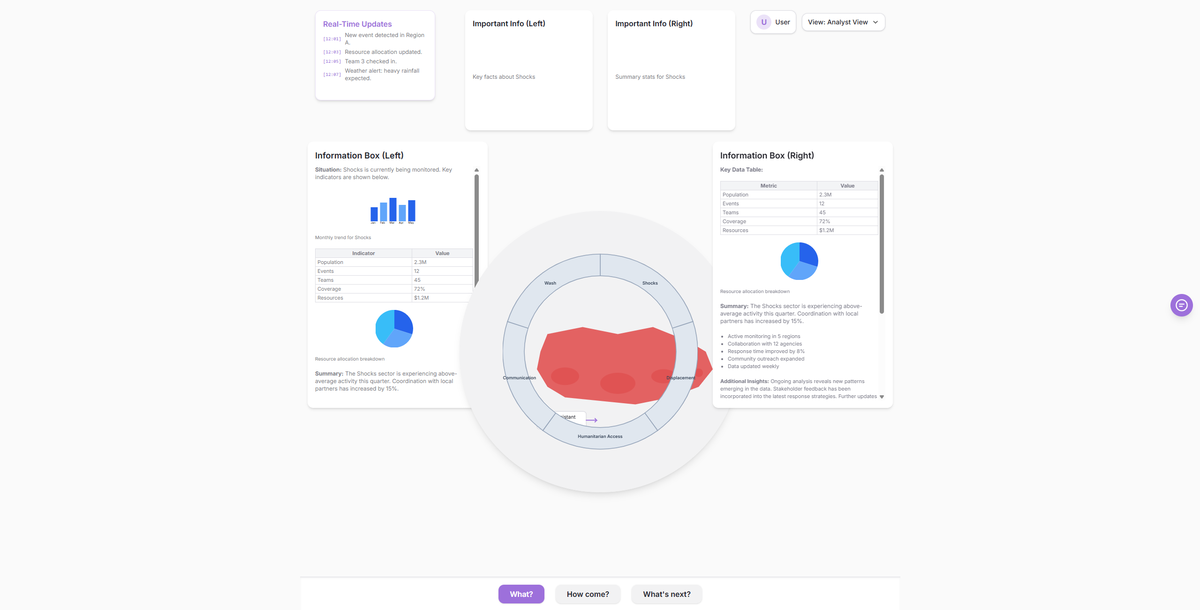
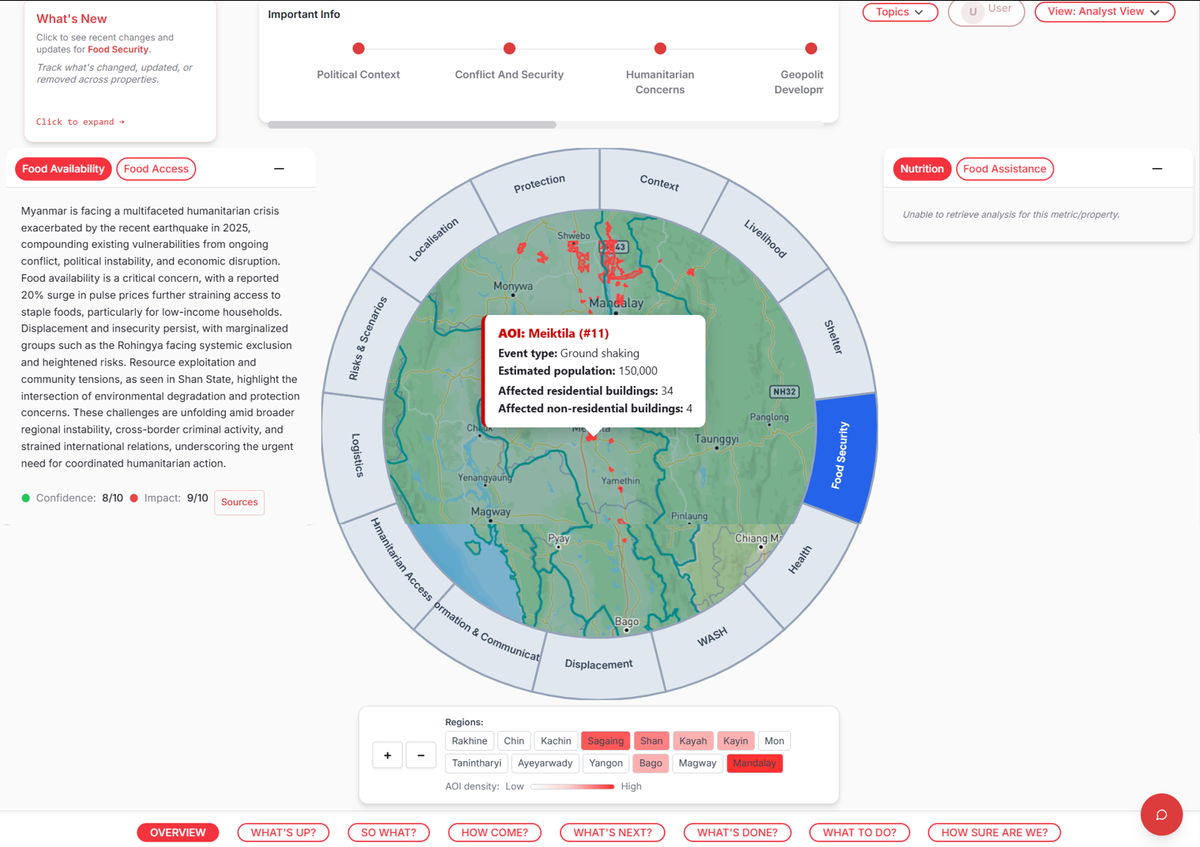
After the project partners had approved the final prototype, we began implementing the dashboard views using React. This was an iterative development process up until deployment, where layout and component design were improved repeatedly using both team decisions and project partner consultations to ensure the design did not stray away from initial specifications. During this process, significant changes, such as implementing the circular segment around the map, were made to improve the user experience significantly. To keep inline with the IFRC GO design, its UI component library was used, alongside custom-made React components. The figures below are the webpages for the 'Analyst View' of the Virtual Situation Room.
Iteration
Screenshot
Initial Webpage
First Webpage Iteration, generated by Loveable using Prototype 3 within the prompt.
Webpage 1
'Analyst View' with most features implemented but not yet refined.
Final Webpage
The current version of the 'Analyst View' webpage with all features implemented
Dashboard Evolution: Annotations
Iteration
What Changed
Reason
Outcome
Initial Webpage
Converted prototype into a functioning webpage with placeholder styles and components.
Needed a tangible baseline to test interactions and information hierarchy in a real browser environment.
Exposed layout and CSS issues early and provided a platform for user testing.
Webpage 1
Implemented core features (map, filters, panels) and refined spacing and typographic scale.
Users required clearer visual hierarchy and reliable interactive controls to complete analyst tasks.
Improved usability for primary workflows; uncovered interaction bugs and accessibility issues for further iteration.
Final Webpage
Polished component states, addressed accessibility fixes, and finalised responsive layout adjustments. Added country regions panel below the map, with buttons highlighted according to Area of Impact density
Addressed findings from usability testing and heuristic evaluation to make the dashboard production-ready. The area-of-interest overlays were added to highlight hotspots, with the country regions panel surfacing regional context and enabling quick region switching, improving spatial orientation for analysts.
Delivered a clearer, more navigable dashboard: overlays improve map readability and focus attention on key impact areas; the regions panel enhances contextual understanding and enables faster navigation, reducing cognitive load and improving analysts' task efficiency.
Conclusion
The final website design successfully met the partner's expectations by delivering a clean, user-friendly dashboard tailored to the fast-paced humanitarian context. Through continuous iterations guided by direct user feedback, we systematically resolved early navigational pain points and improved the clarity of the interface. This design process ensures that analysts and operational teams can efficiently digest complex crisis data without cognitive overload, rounding off the UI design phase before proceeding to detailed user testing.