


WillowBETA
Transform. Analyze. Visualize.
Make the most out of your data
Willow was created for data science and machine learning; with functionalities such as feature scaling, feature encoding, and plenty of options for dealing with missing data, Willow is the new toolkit for your data analysing needs.
Gain insights into your data
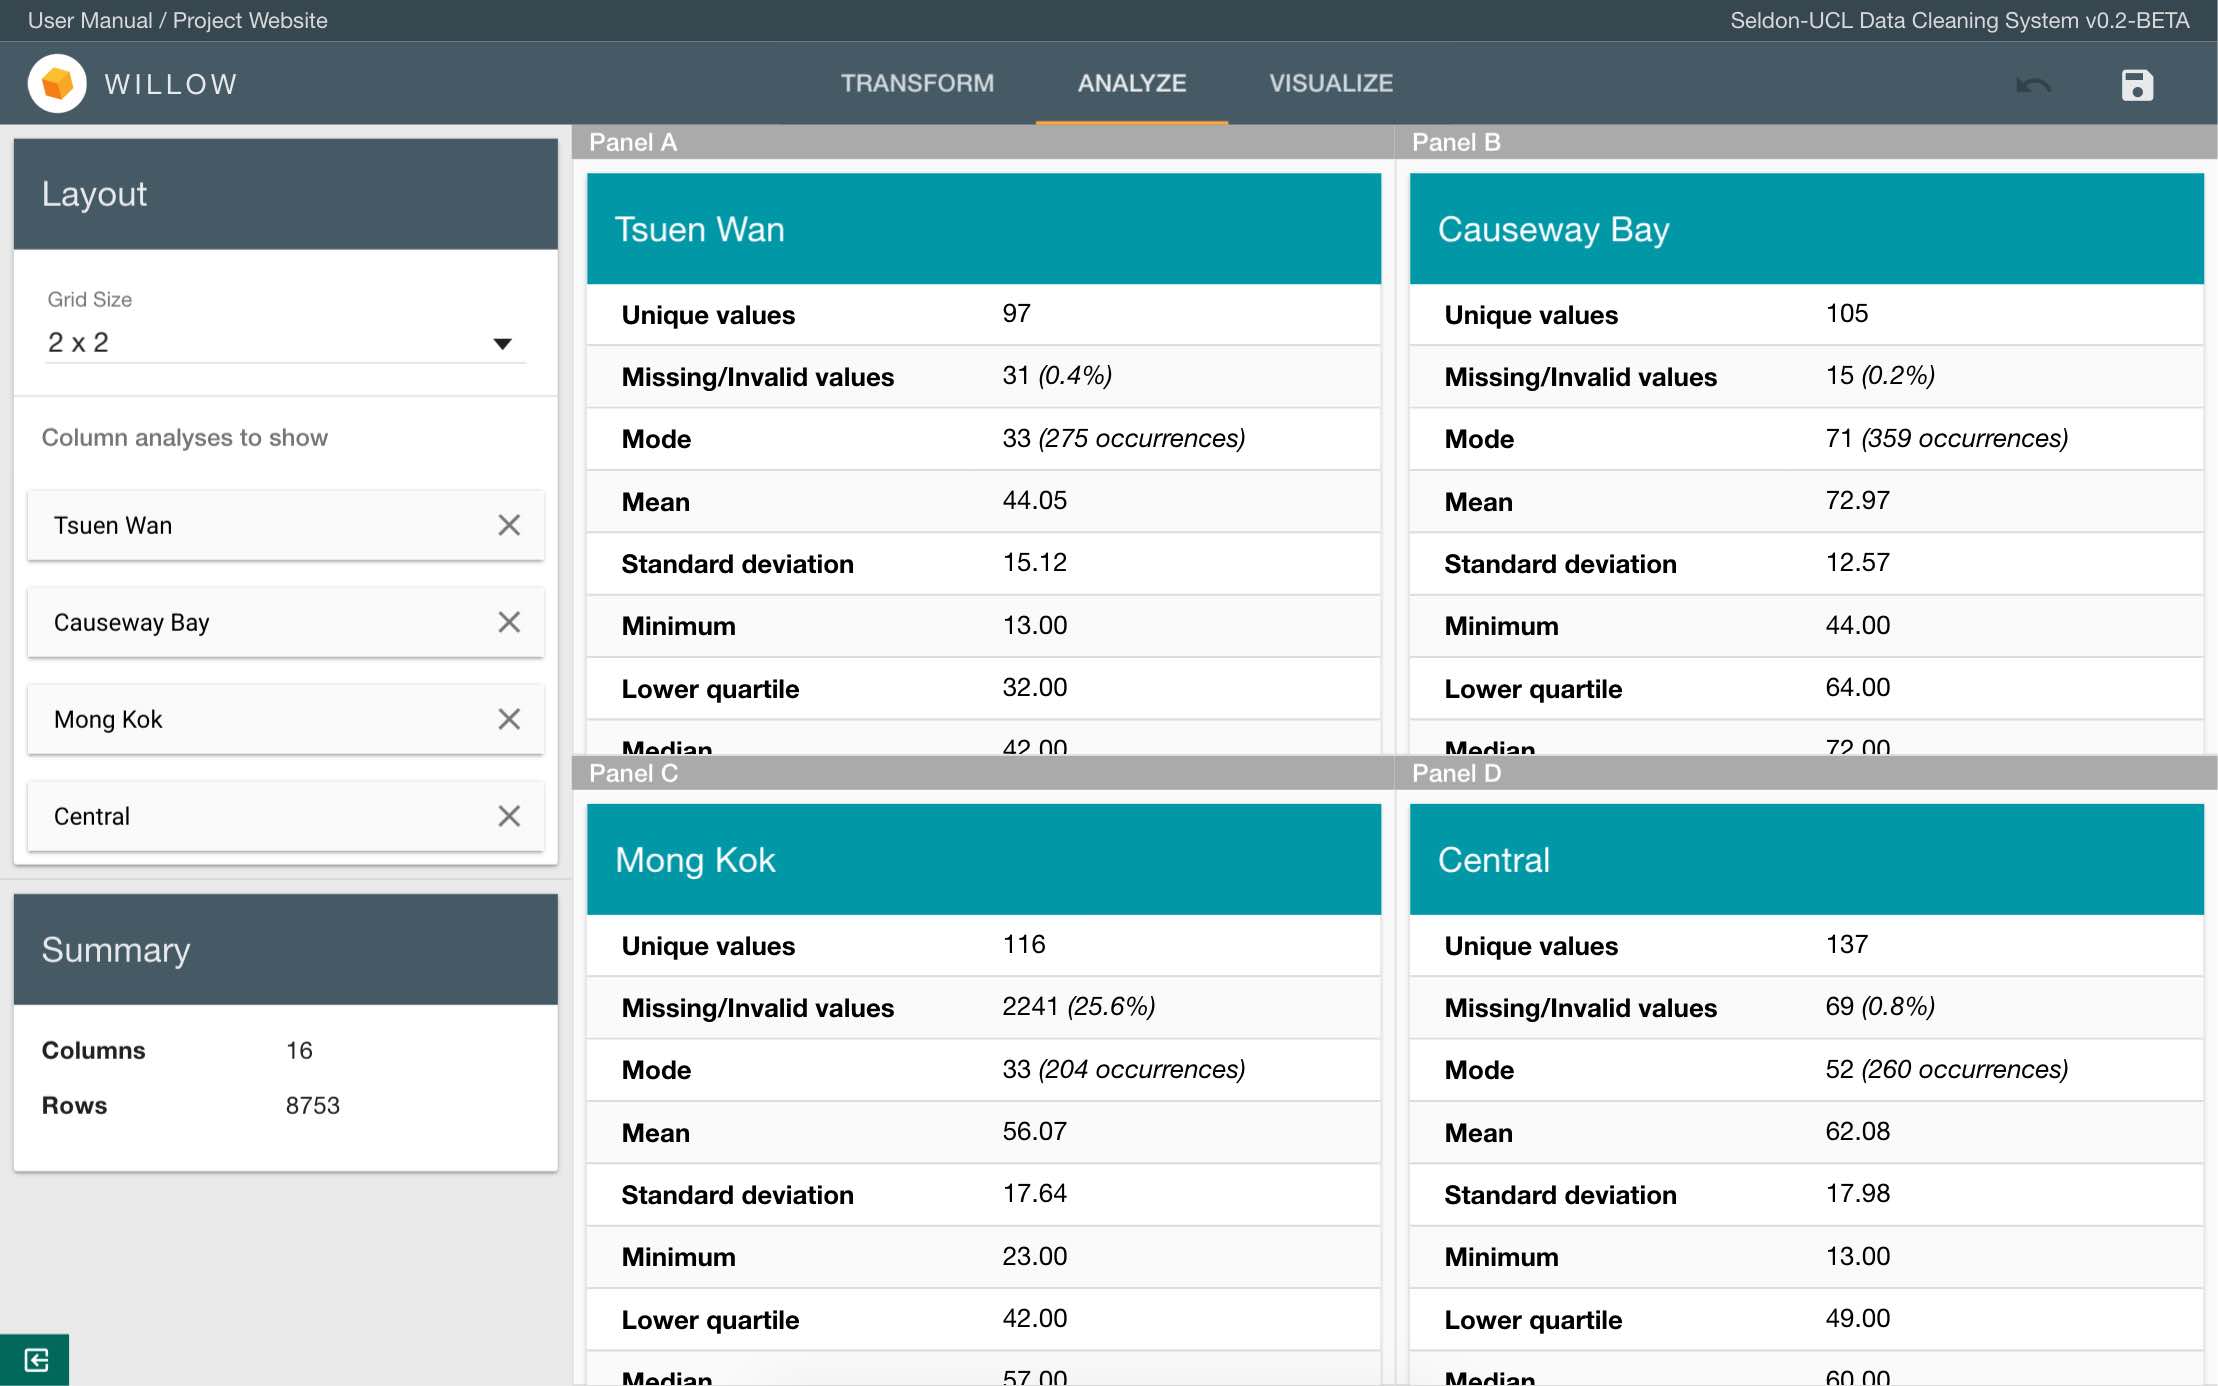
It is often useful to have some statistical information of your data. Luckily, Willow gives you all the essential statistical analyses you need. Attributes such as averages, range, frequencies and more are just one click away, right where you need it.
Visualize your data, spot patterns
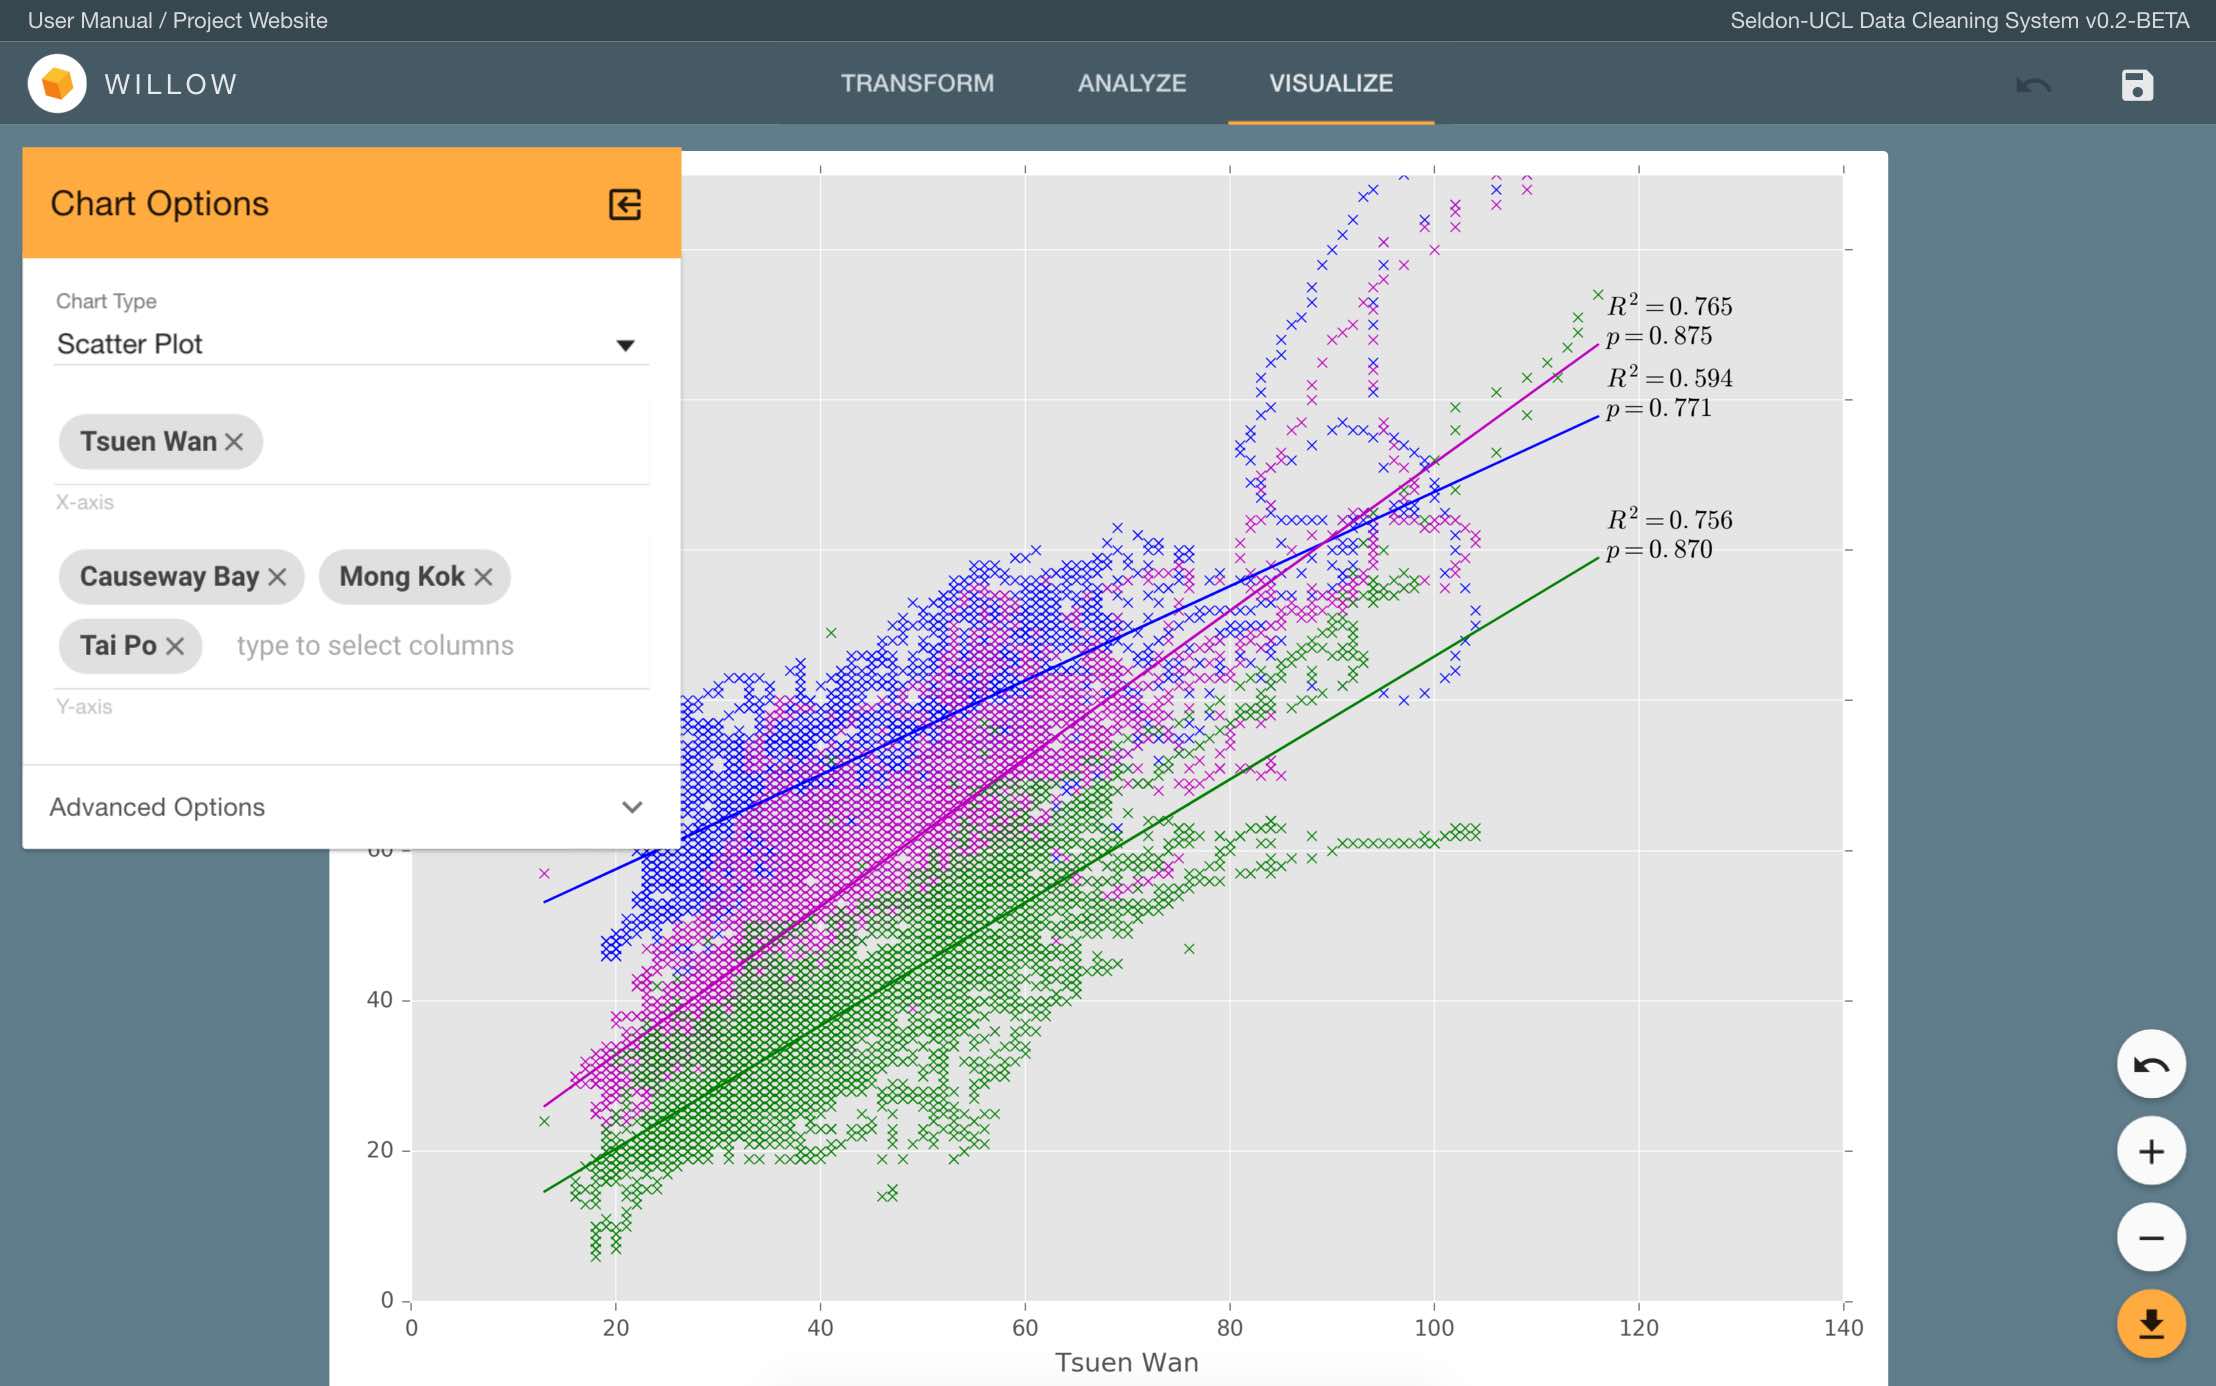
Sometimes it's not-so-easy to spot patterns when all you've got is an endless stream of letters and numbers. This is why Willow has data visualization functionalities built-in. Start plotting graphs and uncover hidden patterns in your data.

Shivam Dhall
Group Manager, Chief Researcher

Bandi Enkh-Amgalan
Technical Lead, Client Liaison

Gordon Cheng
UI Lead, Chief Editor
Made by UCL undergraduates
Willow was meticulously crafted by three UCL undergraduate computer scientists as part of their second year studies.
ETL for Data Science
Willow is the outcome of the project ETL for Data Science of which the objective was to investigate and implement improvements to the data collection, preparation and analysis phase that occurs at the start of most data science projects.
This project was done for Seldon as part of the UCL COMP204P and COMP205P modules.
Learn More About the Project