
Installing and Running Willow
System Requirements
- Operating System: Mac OS X 10.7+, Windows 7+, Linux
- Memory: 4GB+
- Browser (JavaScript Enabled): Chrome 45+, Safari 9+, Firefox 42+, Edge 25+, IE 11+
- VirtualBox and Vagrant installed
Install Willow
- Install VirtualBox if not installed already.
- Go to the download page.
- Follow instructions to install VirtualBox.
- Install Vagrant if not installed already.
- Go to the download page.
- Follow instructions to install Vagrant.
- Create a directory for Willow and make it the current directory.
mkdir willowcd willow
- Download the Willow Vagrantfile and put it in the directory.
- Start up the vagrant instance of the box.
vagrant up
Run Willow
Start
To start Willow, open the terminal (Mac/Linux) or command prompt (Windows), set the current directory to your Willow folder. Enter and execute:
vagrant up
Open the web browser and navigate to:
localhost:5000
Shut down
To shut down Willow, go to the terminal/command prompt, make sure the current directory is your Willow folder. Enter and execute:
vagrant halt
Uninstall Willow
To uninstall Willow, simply delete your Willow directory. You will not be able to retrieve any previously uploaded datasets once you delete that directory. Refer to VirtualBox and Vagrant website for their uninstallation instructions.
Data Uploading and Downloading
Uploading Data
You need to first upload your data into Willow in order to perform any operations. Uploading a dataset creates a new Willow project. Unlike common web services, uploading a file in Willow actually stores the project locally on your computer and not on the internet. This means that Willow works even if you’re offline! Willow currently supports CSV, JSON, XLS, and XLSX formatted data files.
When you access Willow using the appropriate address in your web browser, you will be directed to the Upload page. To upload a new file, click the gray box in the middle. This will open a file explorer, simply select the file you want and click Open. Alternatively, you can select a file by dragging the file inside the gray box. Click Upload to upload the selected file. If the upload is successful, you will be directed to the clean tab in main page.
Large Files
If you select a large file to upload, the advanced options section will expand automatically and warn you about potential performance issues. This is because even with the optimisations we have implemented in Willow for dealing with large datasets, its performance will unavoidably degrade as the file size increases.
In this situation, you can choose to upload your file anyway. However, expect slower performances from Willow. Alternatively, if you don’t need all of the data in the file, you can select a random sample of your dataset by specifying a percentage (0, 100] under Advanced Options. You can also select a seed so you can retrieve the same sample again in the future.
To ensure that you have a good experience with Willow, it is recommended that you only upload files that are less than 80MB.
Common Issues
Comments at the start of the file
- Some CSV/XLSX files have comments at the start of the file which are not part of the dataset. While Willow may accept the file, the resulting data structure will likely not to be correct. Luckily, under Advanced Options, you can specify the number of initial lines to ignore when uploading your file. If you do so, Willow will skip those lines when parsing your file.
Invalid formats
- While Willow is a great tool for cleaning datasets, it wasn’t built for dealing with invalid data files. However, it will make its best attempt at parsing your file by removing invalid records. If Willow was not able to parse your file, you will have to fix them before being able to upload them into Willow.
Text encoding issues
- Text encoding discrepancies may result in Willow not accepting your file. Willow works in UTF-8, while it will do its best to detect the encoding of your file using the excellent chardet library and convert it to UTF-8, it doesn’t always succeed. In these cases, you will have to convert the file yourself before uploading it again.
Saving/Downloading Data
After you have finished operating on the data, you can download it back in CSV or JSON formats. To do this, simply click on the save button on the right of the top bar. You may be able to access a previously uploaded dataset by going to the same URL as the one generated when the data was first uploaded. However, this is not guaranteed and it is recommended that you save your dataset as a CSV or JSON file between sessions.
Data Viewing
After Willow has successfully parsed your data file, you will be directed to the Transform tab in the main page. The Transform tab consists of two parts, the toolbar on the right and the data table on the left.
Interface
Data Table
The data table is where your dataset is displayed and works similarly to spreadsheets software such as Excel. You can select cells by clicking on them; select multiple cells by dragging; and select entire column or row by clicking on the column or row headers. Initially, the table will show the first 10 columns and first 50 rows and you can navigate between these rows by scrolling inside the table.
![]()
The bar beneath the table (bottom bar) has 2 modes, you can toggle between them by clicking on the tune button on the left side of the bar. The first and default mode is table navigation. As mentioned, by default, the table will show the first 10 columns and first 50 rows; you can change which columns/rows to show by editing the values in this bar. The table can show a maximum of 20 columns and 500 rows at once.
The second mode is quick inspect. This shows 3 properties of the column that is currently selected, the column data type, the column mode, and the number of missing/invalid values in the column.
Toolbar
The toolbar is where you will perform all cleaning and transformation operations. The toolbar has 3 sections, inspect, view, and operate; you can switch between them by clicking on their tabs. The Inspect section shows you the various properties and statistics of the currently selected column. The View sections lets you set filters to what is shown on the data table, and also search through the dataset. The Operate section lets you perform the various operations. These operations are separated into cards and they will show according to your current table selection, click the arrow on the right to expand these cards.
Filter
The Filter card under the View tab lets you show specific rows of the dataset according to some criteria. Start by selecting one of the criteria, then select the columns to check against the criteria. You can also select a column for the records to be grouped by in the Group by field.
Duplicates
This option only shows rows that has a non-unique value in the selected columns.
Invalid Values
This option only shows rows that has a missing/invalid value in the selected columns. If Check All Columns is checked, then only rows that have missing/invalid value in all columns in the dataset will be shown.
Outliers
This option only shows rows that is a outlier in the selected columns and only works on numerical columns. By default, a value is considered an outlier if it lies beyond 2 standard deviation from the mean. You can alter this by changing the number of standard deviations to be used for the accepted range. You can also select a trimmed percentage which is defaulted to 0%.
Sort
The Sort card under the View tab lets you sort your dataset according to a specific column. Start by typing in a column for the dataset to be sorted by. After a column has been chosen, you can choose to sort the dataset in ascending or descending order.
N.B. This feature only changes the way the dataset is displayed and has no effect on the dataset itself.
Search
The Search card under the View tab lets you filter your dataset by only showing rows that matches your search query. Input your query string and select which columns to search in and click Search. You can also check the Search all columns option to search in all columns. To clear your search, click Clear.
Data Cleaning and Transformation
After Willow has successfully parsed your data file, you will be directed to the Transform tab in the main page. The Transform tab allows you to perform various data cleaning and transformation operations that Willow offers.
Edit Column
When you select one whole column, the Edit Column card will appear under the View section. In this card, you can change the column name and data type.
Which data types you will be allowed to change your column to will depend on the current type. You can check the current type in quick inspect.
| Current Type | Possible Options |
| string | datetime64, float64, int64 |
| int64 | string, float64 |
| float64 | string, int64 |
| datetime64 | string |
N.B. You will not be able to change the type of a column if the column has missing/invalid values. Refer to the Missing Data section for ways to deal with missing values.
Date format string
When changing a column to type datetime64, you can specify a format string, this will make sure that Willow will interpret the date values correctly. Date strings format in Willow is the same as Python’s strftime, documented here. Here are some commonly used directives:
| Directives | Meaning |
| %d | Day of month as a decimal number. |
| %m | Month as a decimal number. |
| %Y | Year with century as a decimal number. |
| %H | Hour (24-hour clock) as a decimal number. |
| %M | Minute as a decimal number. |
For example, here is 20:18 on July 20th, 1969 in different date-time formats:
| Date-time | Format String |
| 20/07/69-20:18 | %d/%m/%y-%H:%M |
| July 20, 1969 (8:18pm) | %B%d,%Y(%I:%M%p) |
Quirks
- Conversion to datetime64 will fail if any values in the column cannot be converted to datetime64.
Delete column and dealing with empty strings
Other than changing column name and data type, you can also delete the column entirely by clicking Delete Selected Column.
For string typed columns, you can convert all empty strings to invalid values by clicking Treat Empty Strings as Invalid Values, this can be useful when you’re trying to impute missing data.
Edit Row
When you select one or more rows, the Edit Row(s) card will appear under the View section. In this card, you can delete the rows you have selected by clicking the Delete Selected Row(s) button.
Edit Cell
When you select a single cell, the Edit Cell card will appear under the View section. In this card, you can change the value of the selected cell. Willow will attempt to convert the entered value back to the data type of the column the cell is in, e.g. 33 to int rather than literal string. However, it may not be successful at doing so. In these cases, Willow will treat the value as a string and convert all values in the column to type string.
Column Operations
When you select a single column, the Column Operations card will appear under the Operate section.
Duplicate Column
This option makes a copy of the currently selected column and insert it to the right of the original.
Split Column
This option splits each value in the selected column using a specified delimiter, put them into multiple columns and inserts them to the right of the original. For example, splitting the following column using the delimiter ‘/’…
| Date |
| 20/07/1969 |
| 21/07/1969 |
| 22/07/1969 |
| 23/07/1969 |
| 24/07/1969 |
| ... |
… will result in the following columns.
| Date | Date_0 | Date_1 | Date_2 |
| 20/07/1969 | 20 | 07 | 1969 |
| 21/07/1969 | 21 | 07 | 1969 |
| 22/07/1969 | 22 | 07 | 1969 |
| 23/07/1969 | 23 | 07 | 1969 |
| 24/07/1969 | 24 | 07 | 1969 |
| ... | ... | ... | ... |
The names of the new columns will be in the format: original-name_(n-1) where n is the nth column generated.
Quirks
All empty strings in the newly generated columns will be treated as invalid values. However, the original column will be unaffected.
Combine Columns
This option combines values of multiple columns into a single column using an optional separator and inserts it in the selected column’s position.
Unlike most other operations, the selection of columns to operate on is not done via the data table. To add a column to the list of columns to combine, type the column name into the text field, select the column you want and click Add. You must have 2 or more columns in order to perform this operation.
You can specify a separator that will be inserted between the values-to-combine; the separator can be one or more non-whitespace characters. The name for the new column generated must be provided, this name must be unique. Click Combine Columns after you’ve finished all configurations.
Willow will convert all values to strings and combine them by concatenating the values one-by-one, starting from the first column. The resulting column will be of type string. For example, having selected the columns Year, Month, Day in this order, separator set as ‘-‘, new column name set as ‘Date’ and having selected the column Year on the data table…
| Year | Month | Day |
| 1969 | 07 | 20 |
| 1969 | 07 | 21 |
| 1969 | 07 | 22 |
| 1969 | 07 | 23 |
| 1969 | 07 | 24 |
| ... | ... | ... |
… will result in the following columns.
| Date | Year | Month | Day |
| 1969-07-20 | 1969 | 07 | 20 |
| 1969-07-21 | 1969 | 07 | 21 |
| 1969-07-22 | 1969 | 07 | 22 |
| 1969-07-23 | 1969 | 07 | 23 |
| 1969-07-24 | 1969 | 07 | 24 |
| ... | ... | ... | ... |
Quirks
Behind the scenes, Willow uses the Python join function to combine the values. So, for example, combining 6 empty strings using '%' as separator will result in the value '%%%%%'. However, Willow does ignore invalid values (NaN/NA) when combining. Because of this, combining…
(nan), 'abc', (nan), (empty string)
… with '%' will result in the value 'abc%'. You can convert all empty strings in a column to NaNs by selecting that column, go to Edit Columns under View, and click Treat Empty Strings as Invalid Values.
Missing Data
When you select a single column, the Missing Data card will appear under the Operate section.
Impute With Column Average
Depending on the data type of the selected column, you can choose to impute all invalid/missing values in the column with:
- The column mean (if the column is of a numerical type)
- The column median (if the column is of a numerical type)
- The column mode aka most frequent value (works on all data types)
Quirks
- Imputing with column mean on an int64 typed column will change it to type float64.
- If the column has more than one mode, Willow will arbitrarily choose one to use for filling.
Impute With Neighboring Valid Value
This gives you 2 options, forward fill and backward fill. Their behaviour is illustrated below.
| Original | Forward Filled | Backward Filled |
| Euston Square | ||
| Euston Square | ||
| Euston Square | Euston Square | Euston Square |
| Euston Square | King's Cross St. Pancras | |
| Euston Square | King's Cross St. Pancras | |
| King's Cross St. Pancras | King's Cross St. Pancras | King's Cross St. Pancras |
| Waterloo | Waterloo | Waterloo |
| Waterloo | Goodge Street | |
| Goodge Street | Goodge Street | Goodge Street |
| ... | ... | ... |
N.B. As illustrated above, when performing forward fill, if the first row of the original column has a missing value, all missing values until the first valid value will not be filled. This applies similarly to backward fill if the last row has a missing value.
Impute Using Interpolation
This option fills in missing values by interpolating them where possible. Note that for the Spline method, you are limited to an order of 1 - 5. The polynomial method also has a limit of 1 - 20. Willow uses the SciPy library for performing interpolation, read more about the behaviour of the different interpolation method here.
Impute With Custom Value
This option fills in missing values with a custom specified value. Willow will attempt to convert the entered value back to the data type of the column the cell is in, e.g. 33 to int rather than literal string. However, it may not be successful at doing so. In these cases, Willow will treat the value as a string and convert all values in the column to type string.
Delete Entire Row
This option deletes (i.e. removes from the table) all rows containing an invalid/missing value in the selected column.
Discretization & Quantiling
When you select a single column of a numeric type, the Discretization & Quantiling card will appear under the Operate section. This option partitions continuous features to discretized intervals by putting them into bins. Discretization put values into evenly spaced bins according to the values themselves. On the other hand, quantiling put values into evenly sized bins according to the values frequencies. The following example illustrates the behaviour when a column is discretized and quantiled with 5 bins.
| Original | Discretized | Quantiled |
| 0 | (-0.01, 2] | [0, 1.8) |
| 1 | (-0.01, 2] | [0, 1.8] |
| 2 | (-0.01, 2] | (1.8, 4.2] |
| 3 | (2, 4] | (1.8, 4.2] |
| 5 | (4, 6] | (4.2, 6.4] |
| 6 | (4, 6] | (4.2, 6.4] |
| 7 | (6, 8] | (6.4, 8.2] |
| 8 | (6, 8] | (6.4, 8.2] |
| 9 | (8, 10] | (8.2, 10] |
| 10 | (8, 10] | (8.2, 10] |
Instead of having evenly spaced/sized bins, you can set custom intervals and quantiles. Check the Custom Ranges/Quantiles option and input a comma-seperated list of ranges/quantiles. The following example shows the behaviour when a column is discretized with the ranges: -0.01, 2.5, 5, 10; and quantiled with the qunatiles: 0, 0.25, 0.5, 1.
| Original | Discretized | Quantiled |
| 0 | (-0.01, 2.5] | [0, 2.25] |
| 1 | (-0.01, 2.5] | [0, 2.25] |
| 2 | (-0.01, 2.5] | [0, 2.25] |
| 3 | (2.5, 5] | (2.25, 5.5] |
| 5 | (2.5, 5] | (2.25, 5.5] |
| 6 | (5, 10] | (5.5, 10] |
| 7 | (5, 10] | (5.5, 10] |
| 8 | (5, 10] | (5.5, 10] |
| 9 | (5, 10] | (5.5, 10] |
| 10 | (5, 10] | (5.5, 10] |
Quirks
- When setting custom intervals, make sure that the first value is less than the minimum value of the column. Otherwise the minimum value will become blank when being discretized.
- When a column is discretized/quantiled, the column type will change to string and the values will act like strings. This means that the column will be sorted alphanumerically when using the sort feature.
Feature Scaling
When you select a single column of a numeric type, the Feature Scaling card will appear under the Operate section.
Min-Max Scaling
This option scales the values in the column to a specified range (0 - 1 by default). This operation is also known as normalization. When applying this option, Willow will ignore any invalid values, i.e. invalid values will still be invalid values after the column is scaled. This operation will fail if the column has zero range (minimum value is the same as the maximum value).
Standardization
This option scales the values in the column so that the column has zero-mean and unit-variance. When applying this option, Willow will ignore any invalid values, i.e. invalid values will still be invalid values after the column is scaled. This operation will fail if the column has zero-variance.
Categorical Feature Encoding
When you select a single column of a numeric or string type, the Categorical Feature Encoding card will appear under the Operate section. This option encode categorical features using a one-hot scheme, i.e. converts each record of the column to a combination of a single high (1) bit and zero or more low (0) bits. The following example illustrates this behaviour when the column ‘Model’ is encoded.
| Model | Model_A340 | Model_A350 | Model_A380 | Model_B-737 | Model_B-747 | Model_B-787 |
| B-737 | 0 | 0 | 0 | 1 | 0 | 0 |
| A380 | 0 | 0 | 1 | 0 | 0 | 0 |
| A340 | 1 | 0 | 0 | 0 | 0 | 0 |
| B-787 | 0 | 0 | 0 | 0 | 0 | 1 |
| B-747 | 0 | 0 | 0 | 0 | 1 | 0 |
| B-787 | 0 | 0 | 0 | 0 | 0 | 1 |
| A340 | 0 | 1 | 0 | 0 | 0 | 0 |
| 0 | 0 | 0 | 0 | 0 | 0 | |
| B-747 | 0 | 0 | 0 | 0 | 1 | 0 |
| A380 | 0 | 0 | 1 | 0 | 0 | 0 |
The names of the newly generated columns follow the format: original name_value. If the Replace Original Column option is checked, the original column will be deleted once the operation is complete.
N.B. Invalid/missing value will not generate a new column.
Custom Transformations
When you select a single column of string or date type, the Custom Transformations card will appear under the Operate section.
Find & Replace
This feature gives you the flexibility to perform custom text transforms on a column by replacing certain specified values. By default, upon clicking the Replace button, Willow will look for records that completely matches your input in the String to match field, and replace them with the input in the Replacement string field. If the Match Regular Expression option is checked, then Willow will replace matched strings inside each record with the replacement string. For example, replacing ‘Acton’ with ‘Harrow’ yields the following results.
| Original | Replaced (Complete) | Replaced (Regex) |
| Acton | Harrow | Harrow |
| West Acton | West Acton | West Harrow |
| North Acton | North Acton | North Harrow |
| South Acton | South Acton | South Harrow |
N.B. Willow uses the Python flavoured regex. Read more about it here.
Another example using more advanced regex.
Replacing
([0-9]*)/([0-9]*)/([0-9]*)
with
\3-\1-\2
yields…
| Original | Replaced (Regex) |
| 07/20/1969 | 1969-07-20 |
| 07/21/1969 | 1969-07-21 |
| 07/22/1969 | 1969-07-22 |
| 07/23/1969 | 1969-07-23 |
| 07/24/1969 | 1969-07-24 |
| 07/25/1969 | 1969-07-25 |
Batch Replacement Queue
If you wish to do multiple replacements on a column, rather than performing the operations one by one, you can push each replacement operation into a queue and then execute them all at one go. To add a replacement to the queue, click Add instead of Replace after entering the details. You can add as many replacements as you want to this queue. To remove a replacement, click the close next to the replacement. To reorder the replacements, click Edit and move a replacement up/down a spot by clicking the expand_less or expand_more buttons. When you are ready, click Batch Replace, this will apply all the replacement in the queue (in the order they’re in) to the selected column. To clear the current queue, click Edit and Clear Queue.
You can also export a queue for use in a later date or with another dataset. To export a queue, click Export, a dialog should pop-up with a JSON string, copy and save the string. To import a queue, simply click Import and paste in the JSON string. If the dialogs are not appearing, make sure to disable your browser’s dialog blocking functionality.
Miscellaneous
Undo Operations
Willow provides a basic undo function if you wish to revert your dataframe to the immediate previous state. To do this, click the undo button in the top bar.
N.B. Unlike the ordinary undo function in other software, the undo functionality in Willow is considered an operation in and of itself. This means that after you press undo once, and you press it again, Willow will simply give you the dataframe before the first undo (i.e. it undoes the undo).
Highway to the Danger Zone
This feature allows you to execute Python statements to directly manipulate the dataset. This card appears under the Operate tab. To show/hide this card, click the word ‘and’ in the table navigation bar.
The dataset is represented by the Pandas dataframe object and is referenced by the reference named df. To execute statements, input them in the Commands to execute field and click Execute. Multi-line code is supported.
N.B. df is a reference to the dataframe object so only in-place operations will work, i.e. operations that manipulates the dataframe itself and not ones that returns a copy of a dataframe.
Data Analysis
Interface
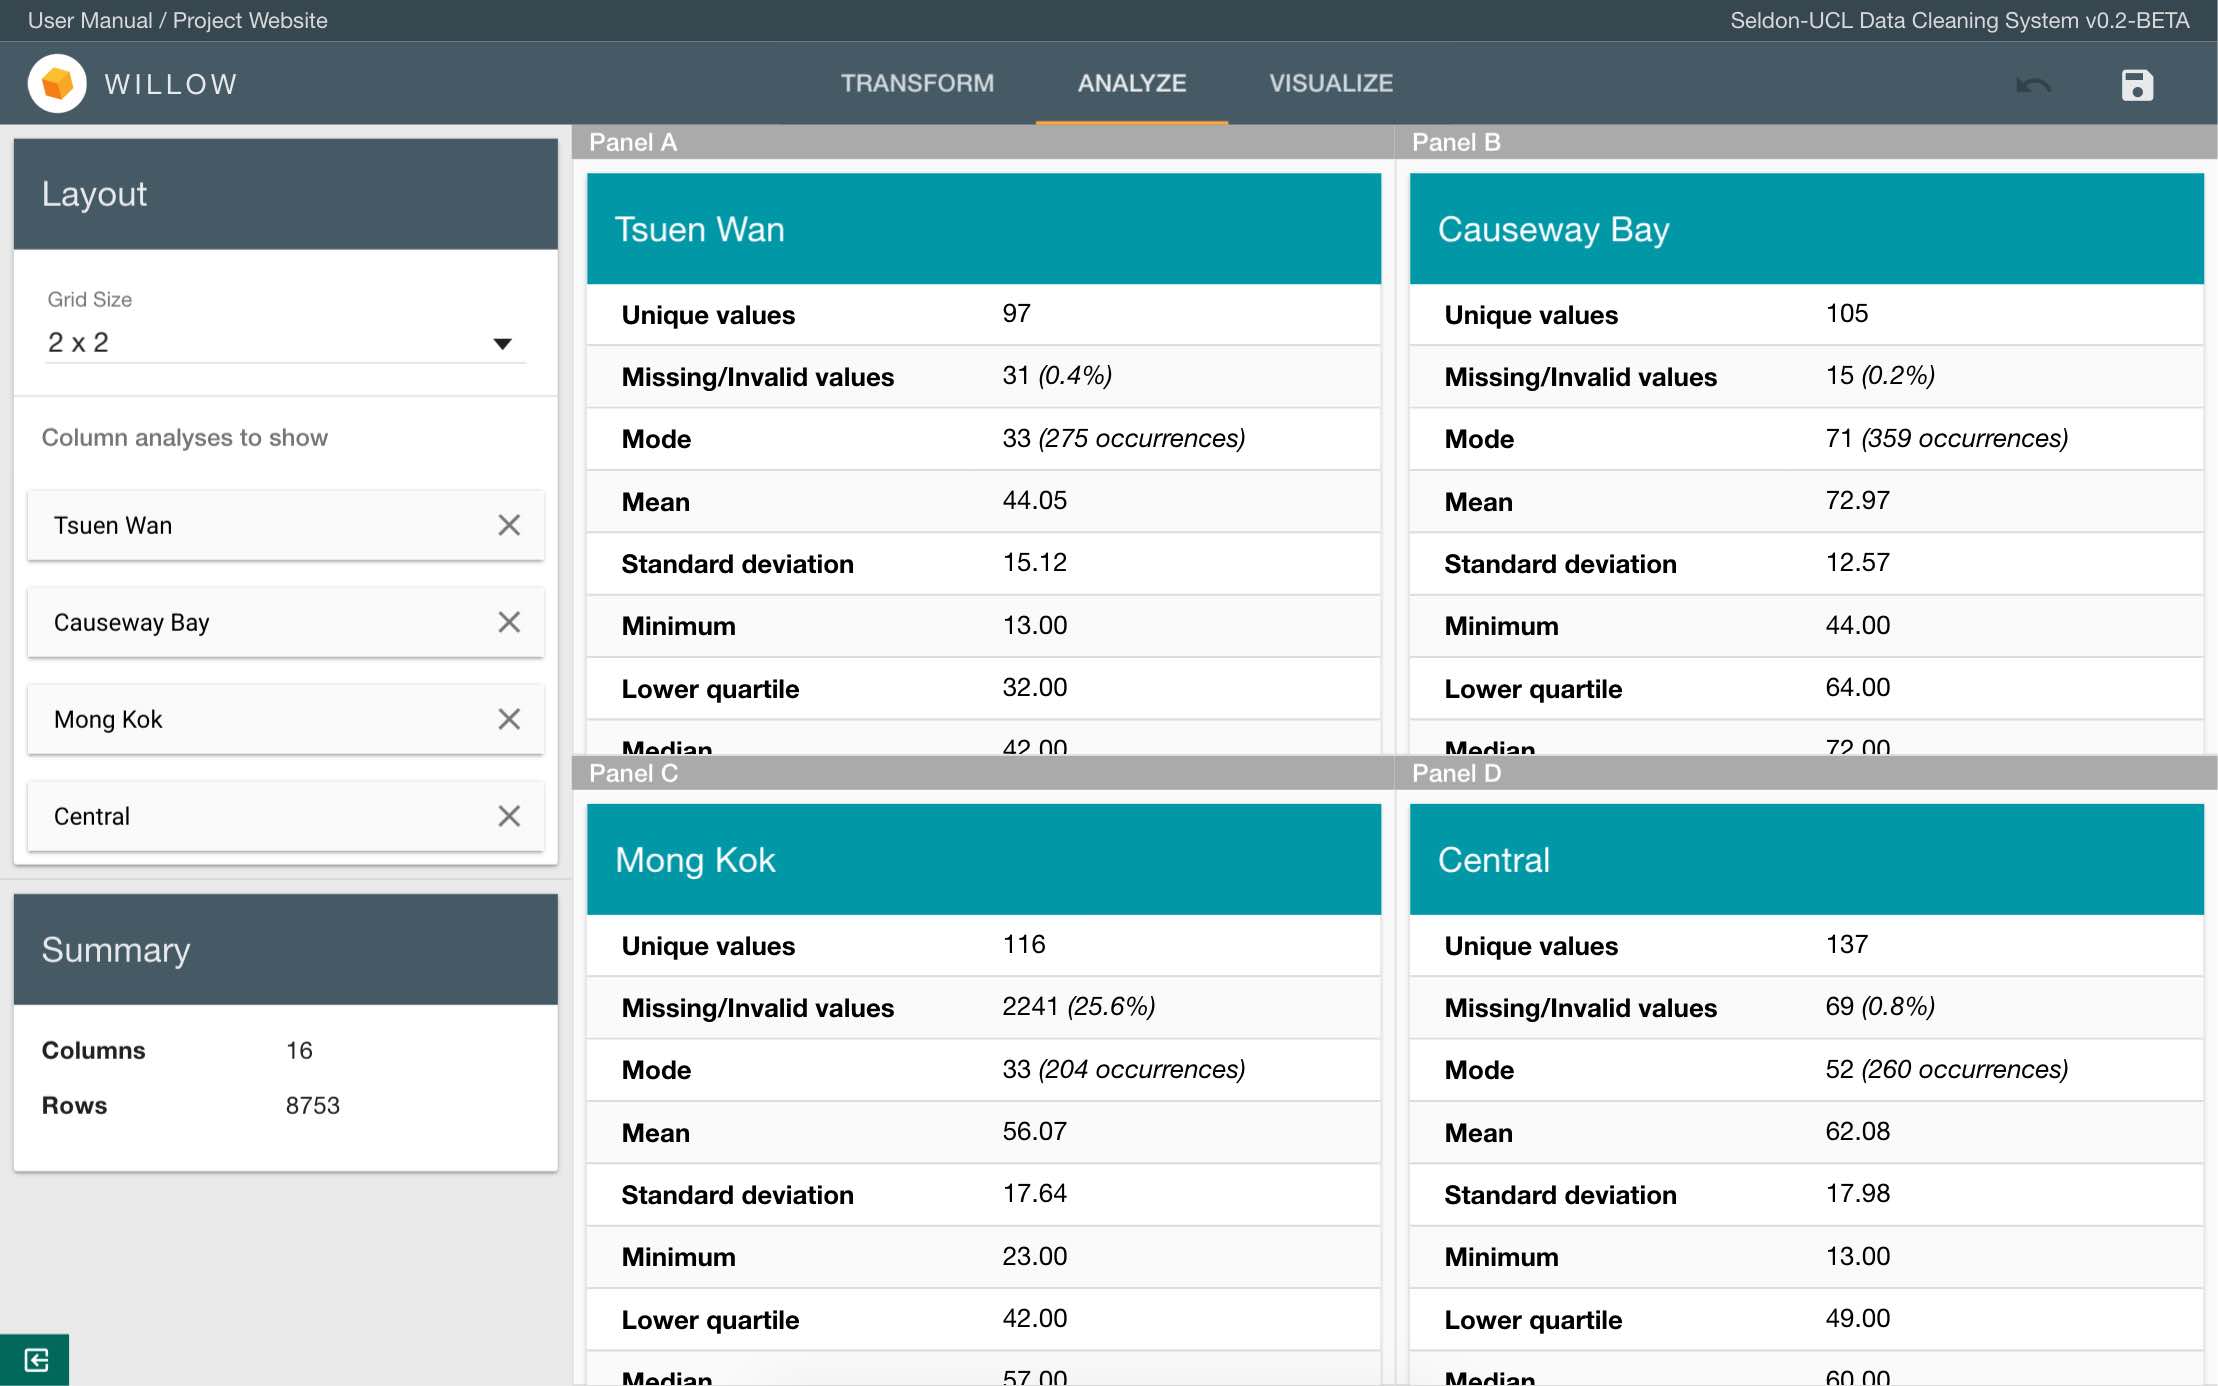
The Analyze tab consists of two parts - the sidebar and the panels. The sidebar is where you can control which column analyses to show in the panels on the right. Simply start typing the name of the column you wish to analyze, and select the column. It’s analysis should show in one of the panels. You can show at most 4 column analyses at once, change the panel grid size by selecting an option in the grid size selector.
Numerical Analysis
For columns of a numerical type (int, float), the following statistical attributes will be displayed:
- Unique values - total number of unique values in the column
- Missing/Invalid values - total number of missing values in the column
- Mode - most frequent value(s)
- Mean
- Standard deviation
- Minimum
- Lower quartile
- Median
- Upper quartile
- Maximum
A frequency table is also available which shows the 50 most frequent values in the column and their frequencies.
Text Analysis
For columns of type string, the following statistical attributes will be displayed:
- Unique values - total number of unique values in the column
- Missing/Invalid values - total number of missing values in the column
- Mode - most frequent value(s)
- Total words - total number of words (not values) in the column
- Unique words - total number of unique words in the column
- Most prominent word - most frequent word(s)
- Word lengths - minimum and maximum word lengths
- Average word length - mean of word length
- Words per row - minimum and maximum of words in values
- Average words per row - mean of words per row
A frequency table is available which shows the 50 most frequent values in the column and their frequencies. A word frequency table is also available which shows the 50 most frequent values in the column and their frequencies.
Data Visualization
Interface
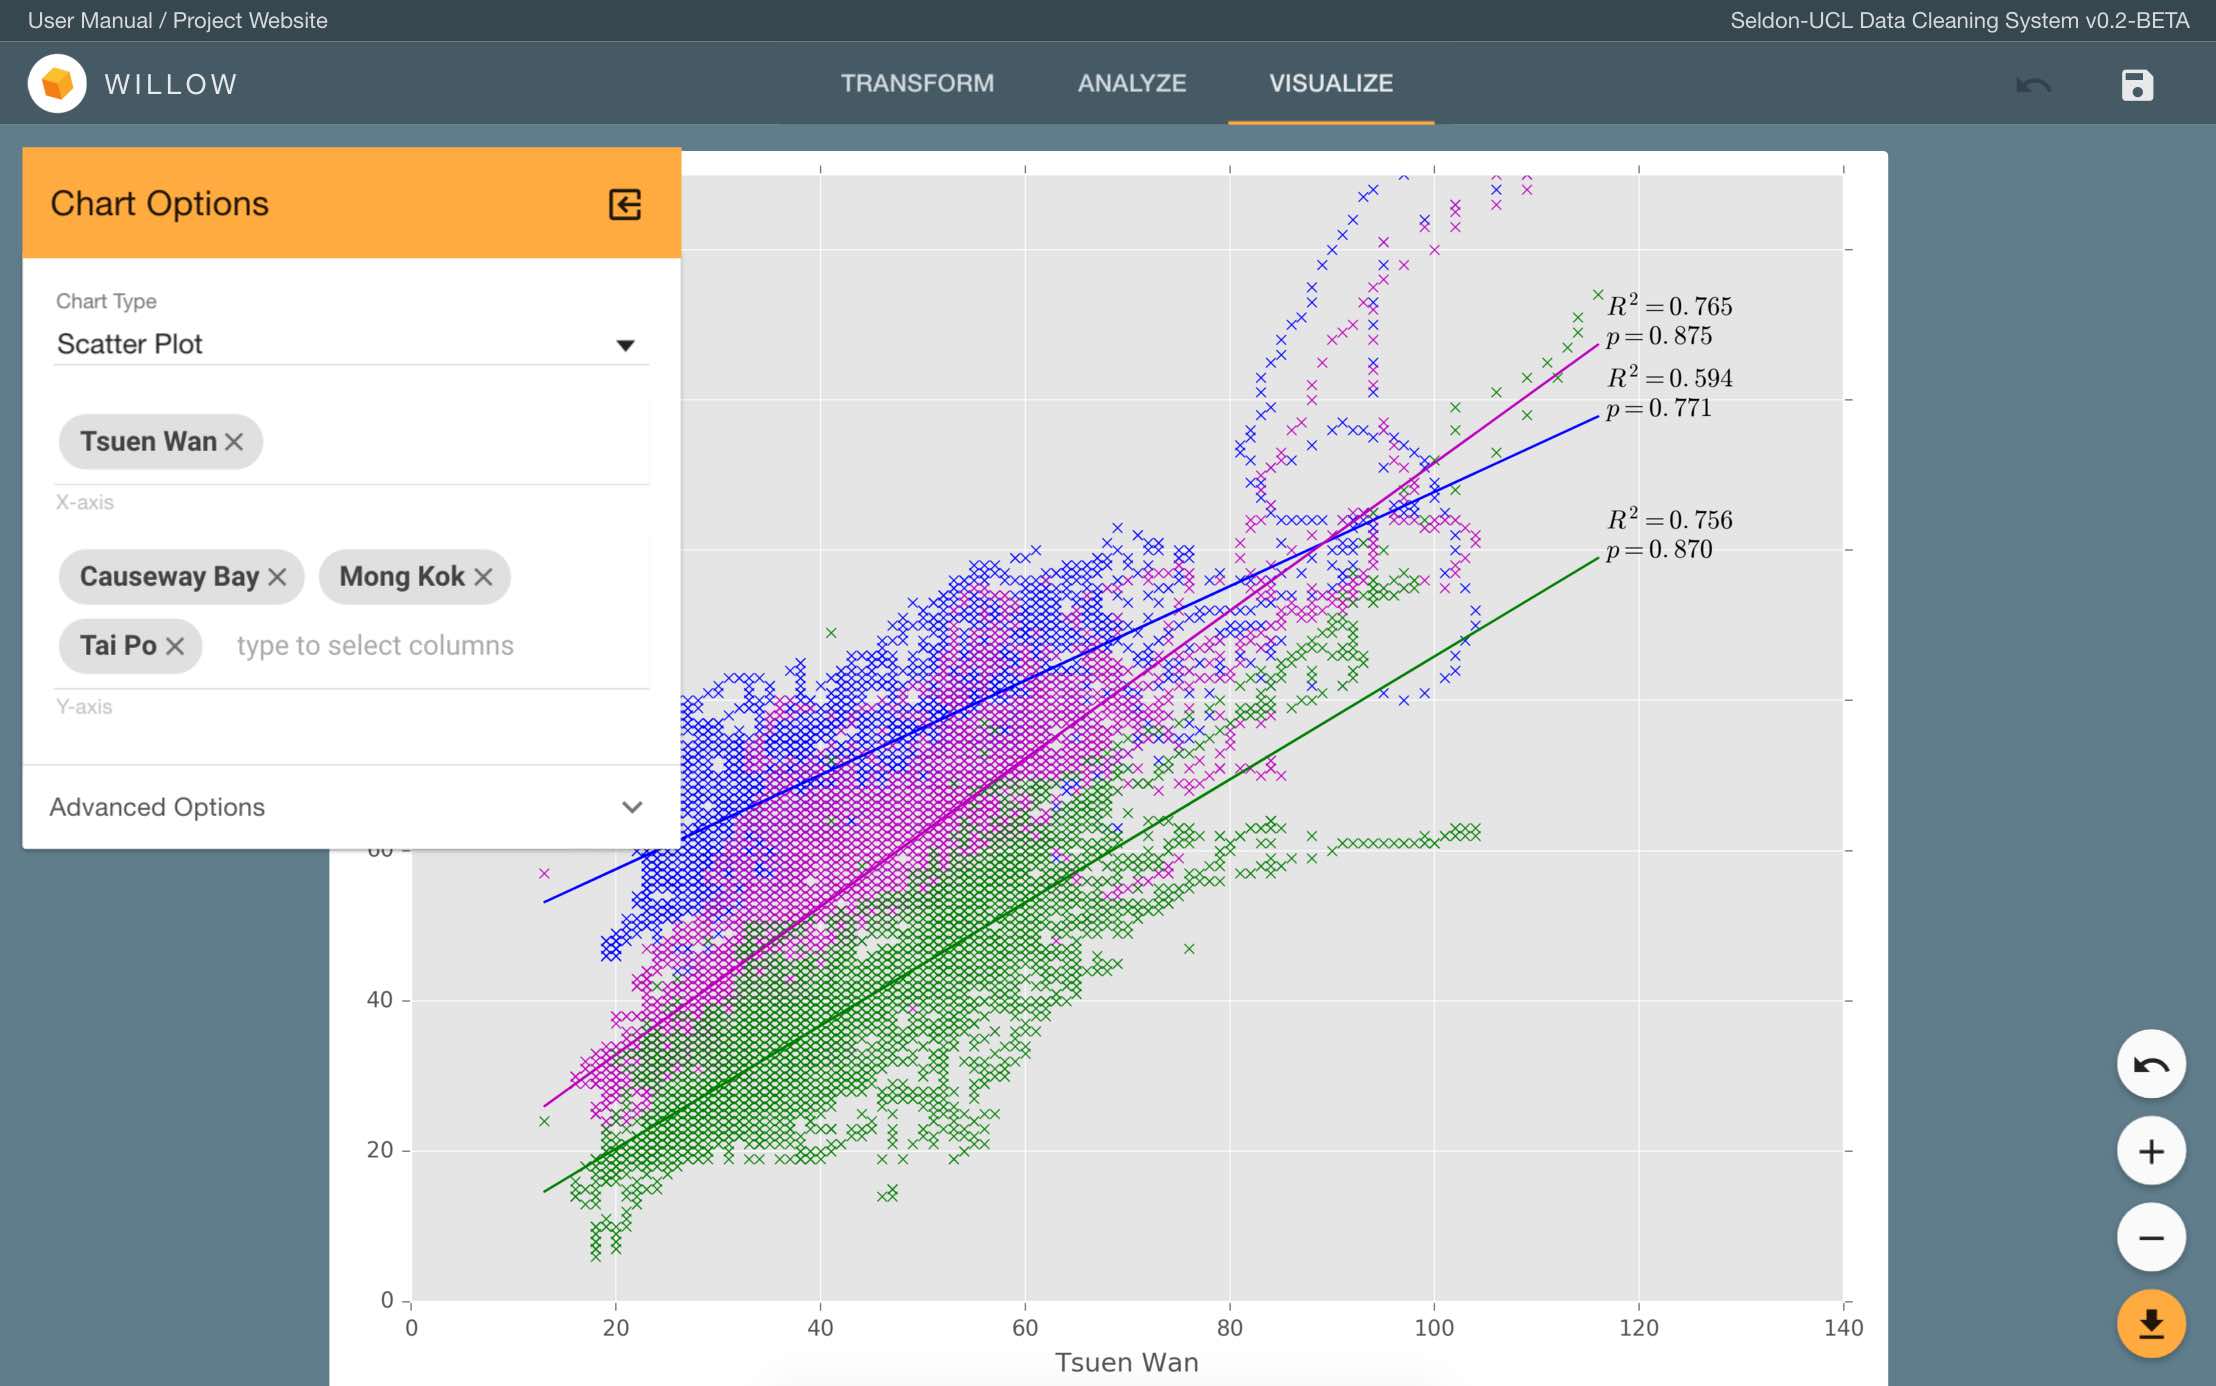
The Visualize tab consists of the main canvas that displays the graph, and the sidebar that goes on top of the canvas. Click exit_to_app to show/hide the sidebar. To start generating a chart, first select the chart type and follow instructions in the next section. When a chart has been generated, there will be several controls on the bottom right hand side of the canvas. The white buttons are zooming controls. Click add to zoom in, remove to zoom out, and undo to reset to the default zoom level. Click the orange file_download button to download the current chart as an image.
Charts
Willow supports 5 chart types and each of them have different options, below is a description of the options for each of the chart types.
Line Chart
- X-Axis - A column to go on the x-axis. Only numerical columns (int, float) are accepted.
- Y-Axis - Columns to be plotted against the x-axis Only numerical columns (int, float) are accepted.
Scatter Plot
- X-Axis - A column to go on the x-axis. Only numerical columns (int, float) are accepted.
- Y-Axis - Columns to be plotted against the x-axis Only numerical columns (int, float) are accepted.
A regression line will also be plotted with each variable in the x-axis along with its coefficient of determination (R2) and Pearson product-moment correlation coefficient (p).
Time Series
- X-Axis - A datetime column to be plotted against.
- Y-Axis - Columns to be plotted against the x-axis. Only numerical columns (int, float) are accepted.
Histogram
- X-Axis - Columns to be plotted. Only numerical columns (int, float) are accepted.
- Bin Size - A number greater than 0 indicating the width of each bin.
Frequency
- X-Axis - The column to be used for the chart. Only string columns are accepted.
- Use Word Frequency - If checked, the chart will use word frequencies instead of value frequencies.
- Top n Occurrences - Top n values/words to show in the chart. Maximum 50.
Advanced Options
You can adjust the range of data to show in your charts by going to the advanced options section of the sidebar. Here you can specify the minimum and maximum value for both the x-axis and the y-axis to be shown on the current chart.