Testing Strategy

We will be using python unit tests to test the functions used in the statistical analysis algorithm. Then we will move on to integrated testing, where we will test how these functions behave when interacting with each other. For the unit tests we started by writing tests to meet the most basic required functionality and once that has been achieved we changed the test (so that it would fail) which tests for an added functionality that had not been implemented yet. Once this new functionality has been implemented in the original (basic) function we redo the test to ensure that it has passed. If the test does not pass we change the original function until it does. Once this is done we will test how this function interacts with other functions from the other components of the project.

Unit and integration testing

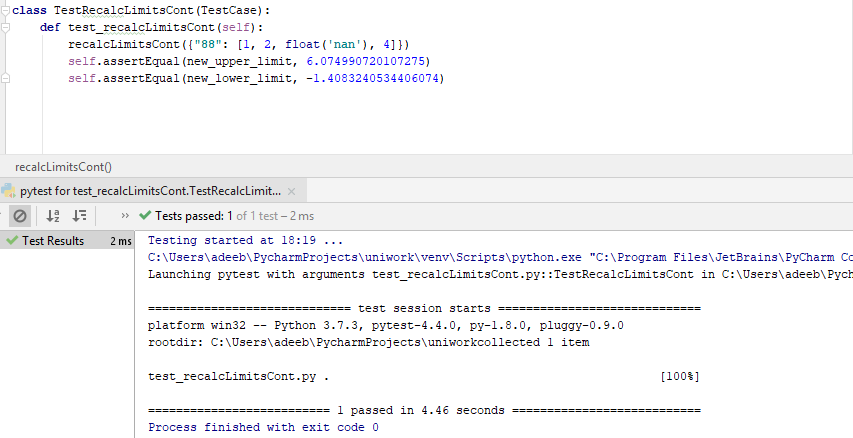
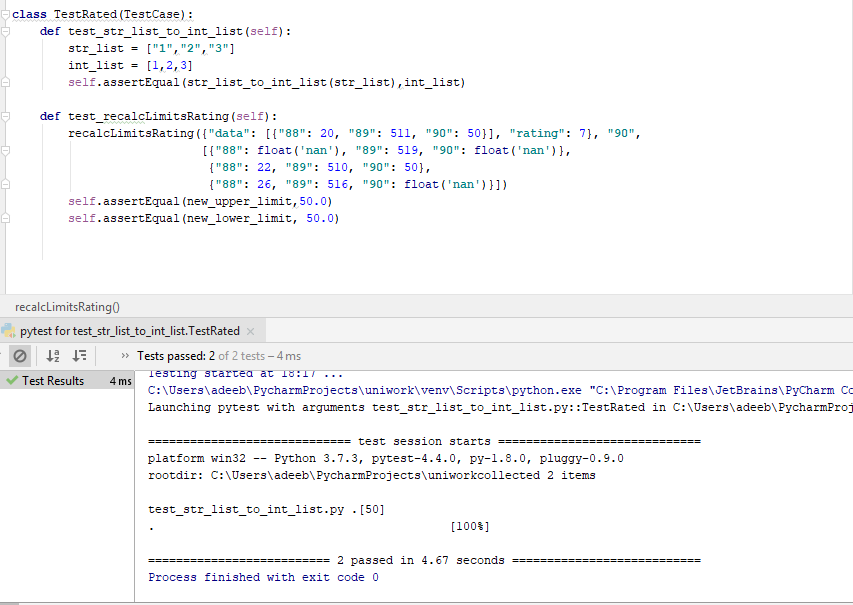
Firstly, we started by testing the most basic components of the algorithm. The algorithm is split into 2 parts; one part which runs as the event progresses and another once the event has been completed. For both parts of the function we need to ensure that they produce the correct limits and they also work when ‘NaN’ values arise. The tests also ensure that the json data is properly being converted into the required format.


Below is an example of the tests we did:


We have made some tests to make sure that all the correct views load in when the dashboard is started.

User acceptance testing

The prototype was tested on other students who have been informed about the setting that the application will be used in. This included test cases for test scenarios such as:


Checking responses for different inputs on the login pages and other pages of the dashboard

Checking responses when interacting with sensors


Below is an example of a test case:


The positive feedback included having grid-based design allowing scalability. Having easy access to previous surgical events and ability to start new one with one button click. On the other hand, our tester was not very happy with the lack of data on the graphs and inability to see recent data without stopping the current event. They also mentioned the lack of ability to hot swap type of graphs for each sensor. Using this feedback we modified the prototype and created our final product.