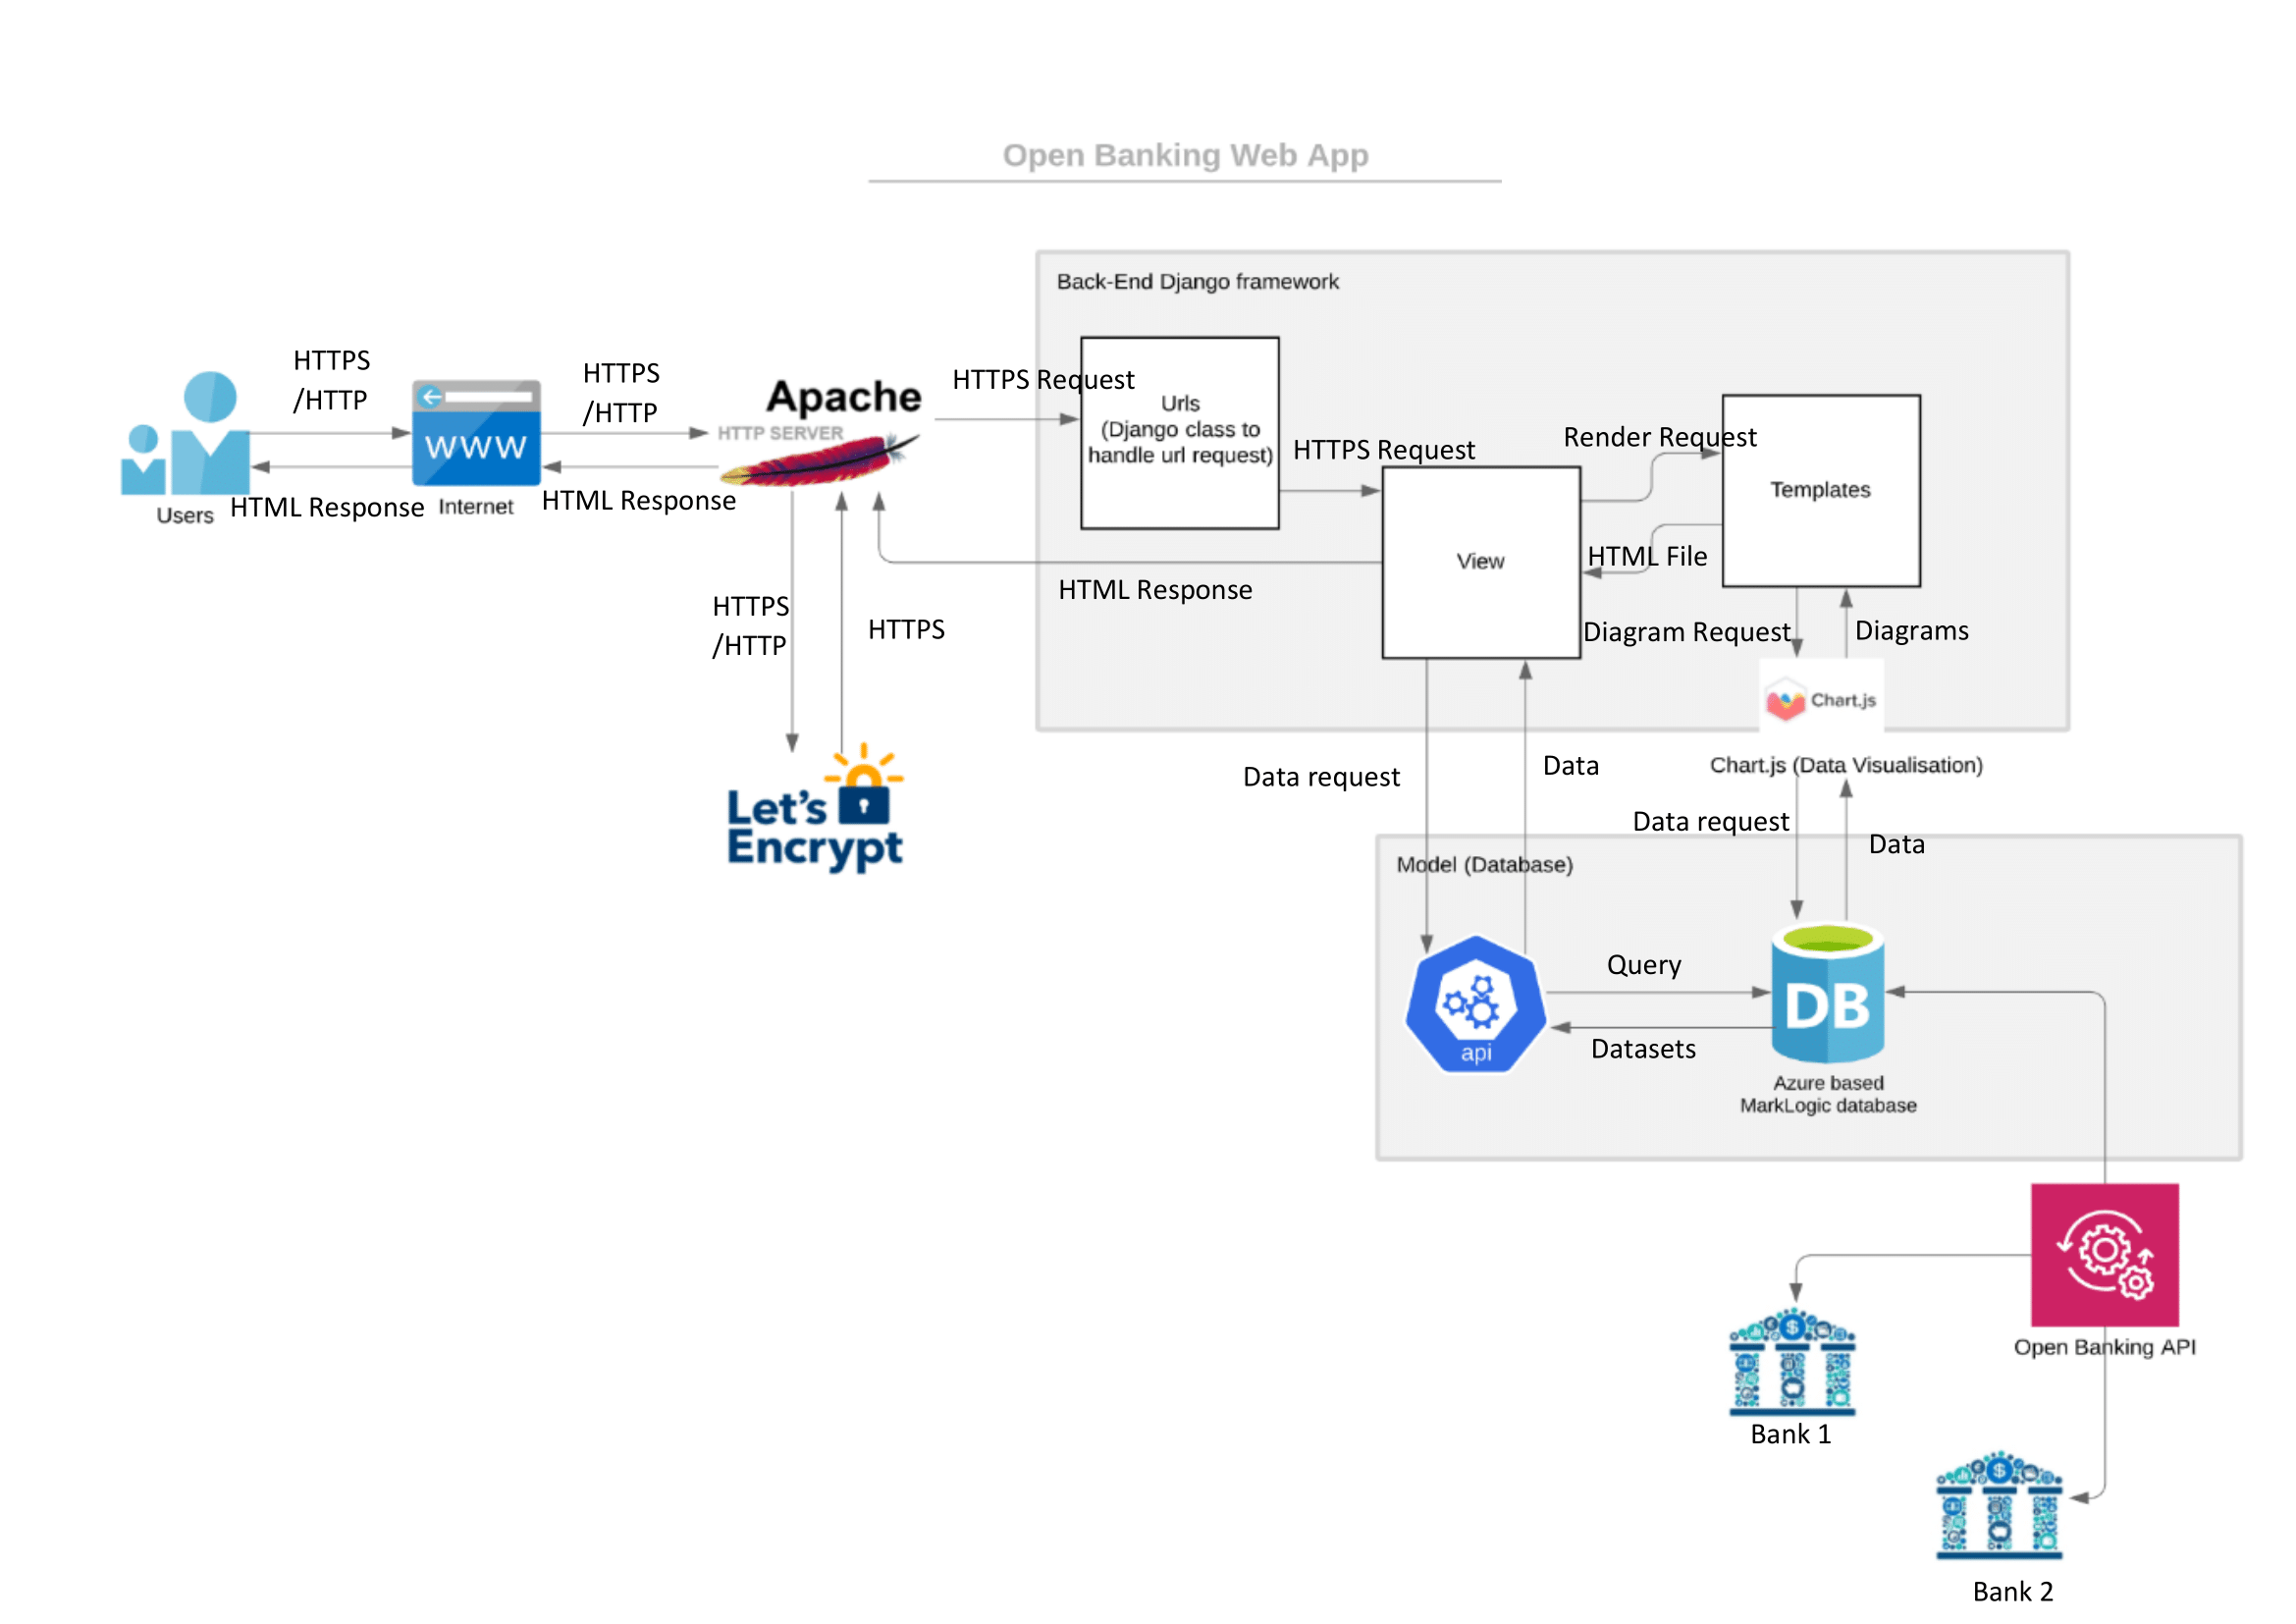
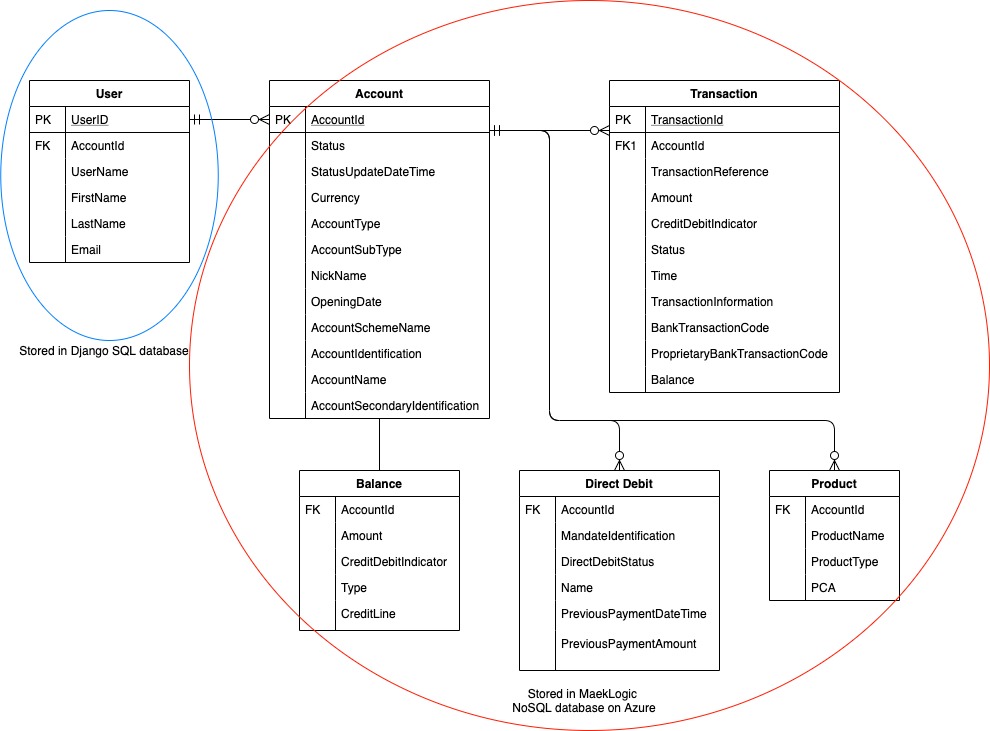
1 / 11
1. Login
System
Our web app needs users to link their bank accounts to their accounts in our
app. We
have
implemented password strength requirements when users sign up and session
cookies
that auto
logout
users inactive for 10 minutes. These are part of our security measures to
protect
user's
sensitive financial information.

2 / 11
2. The
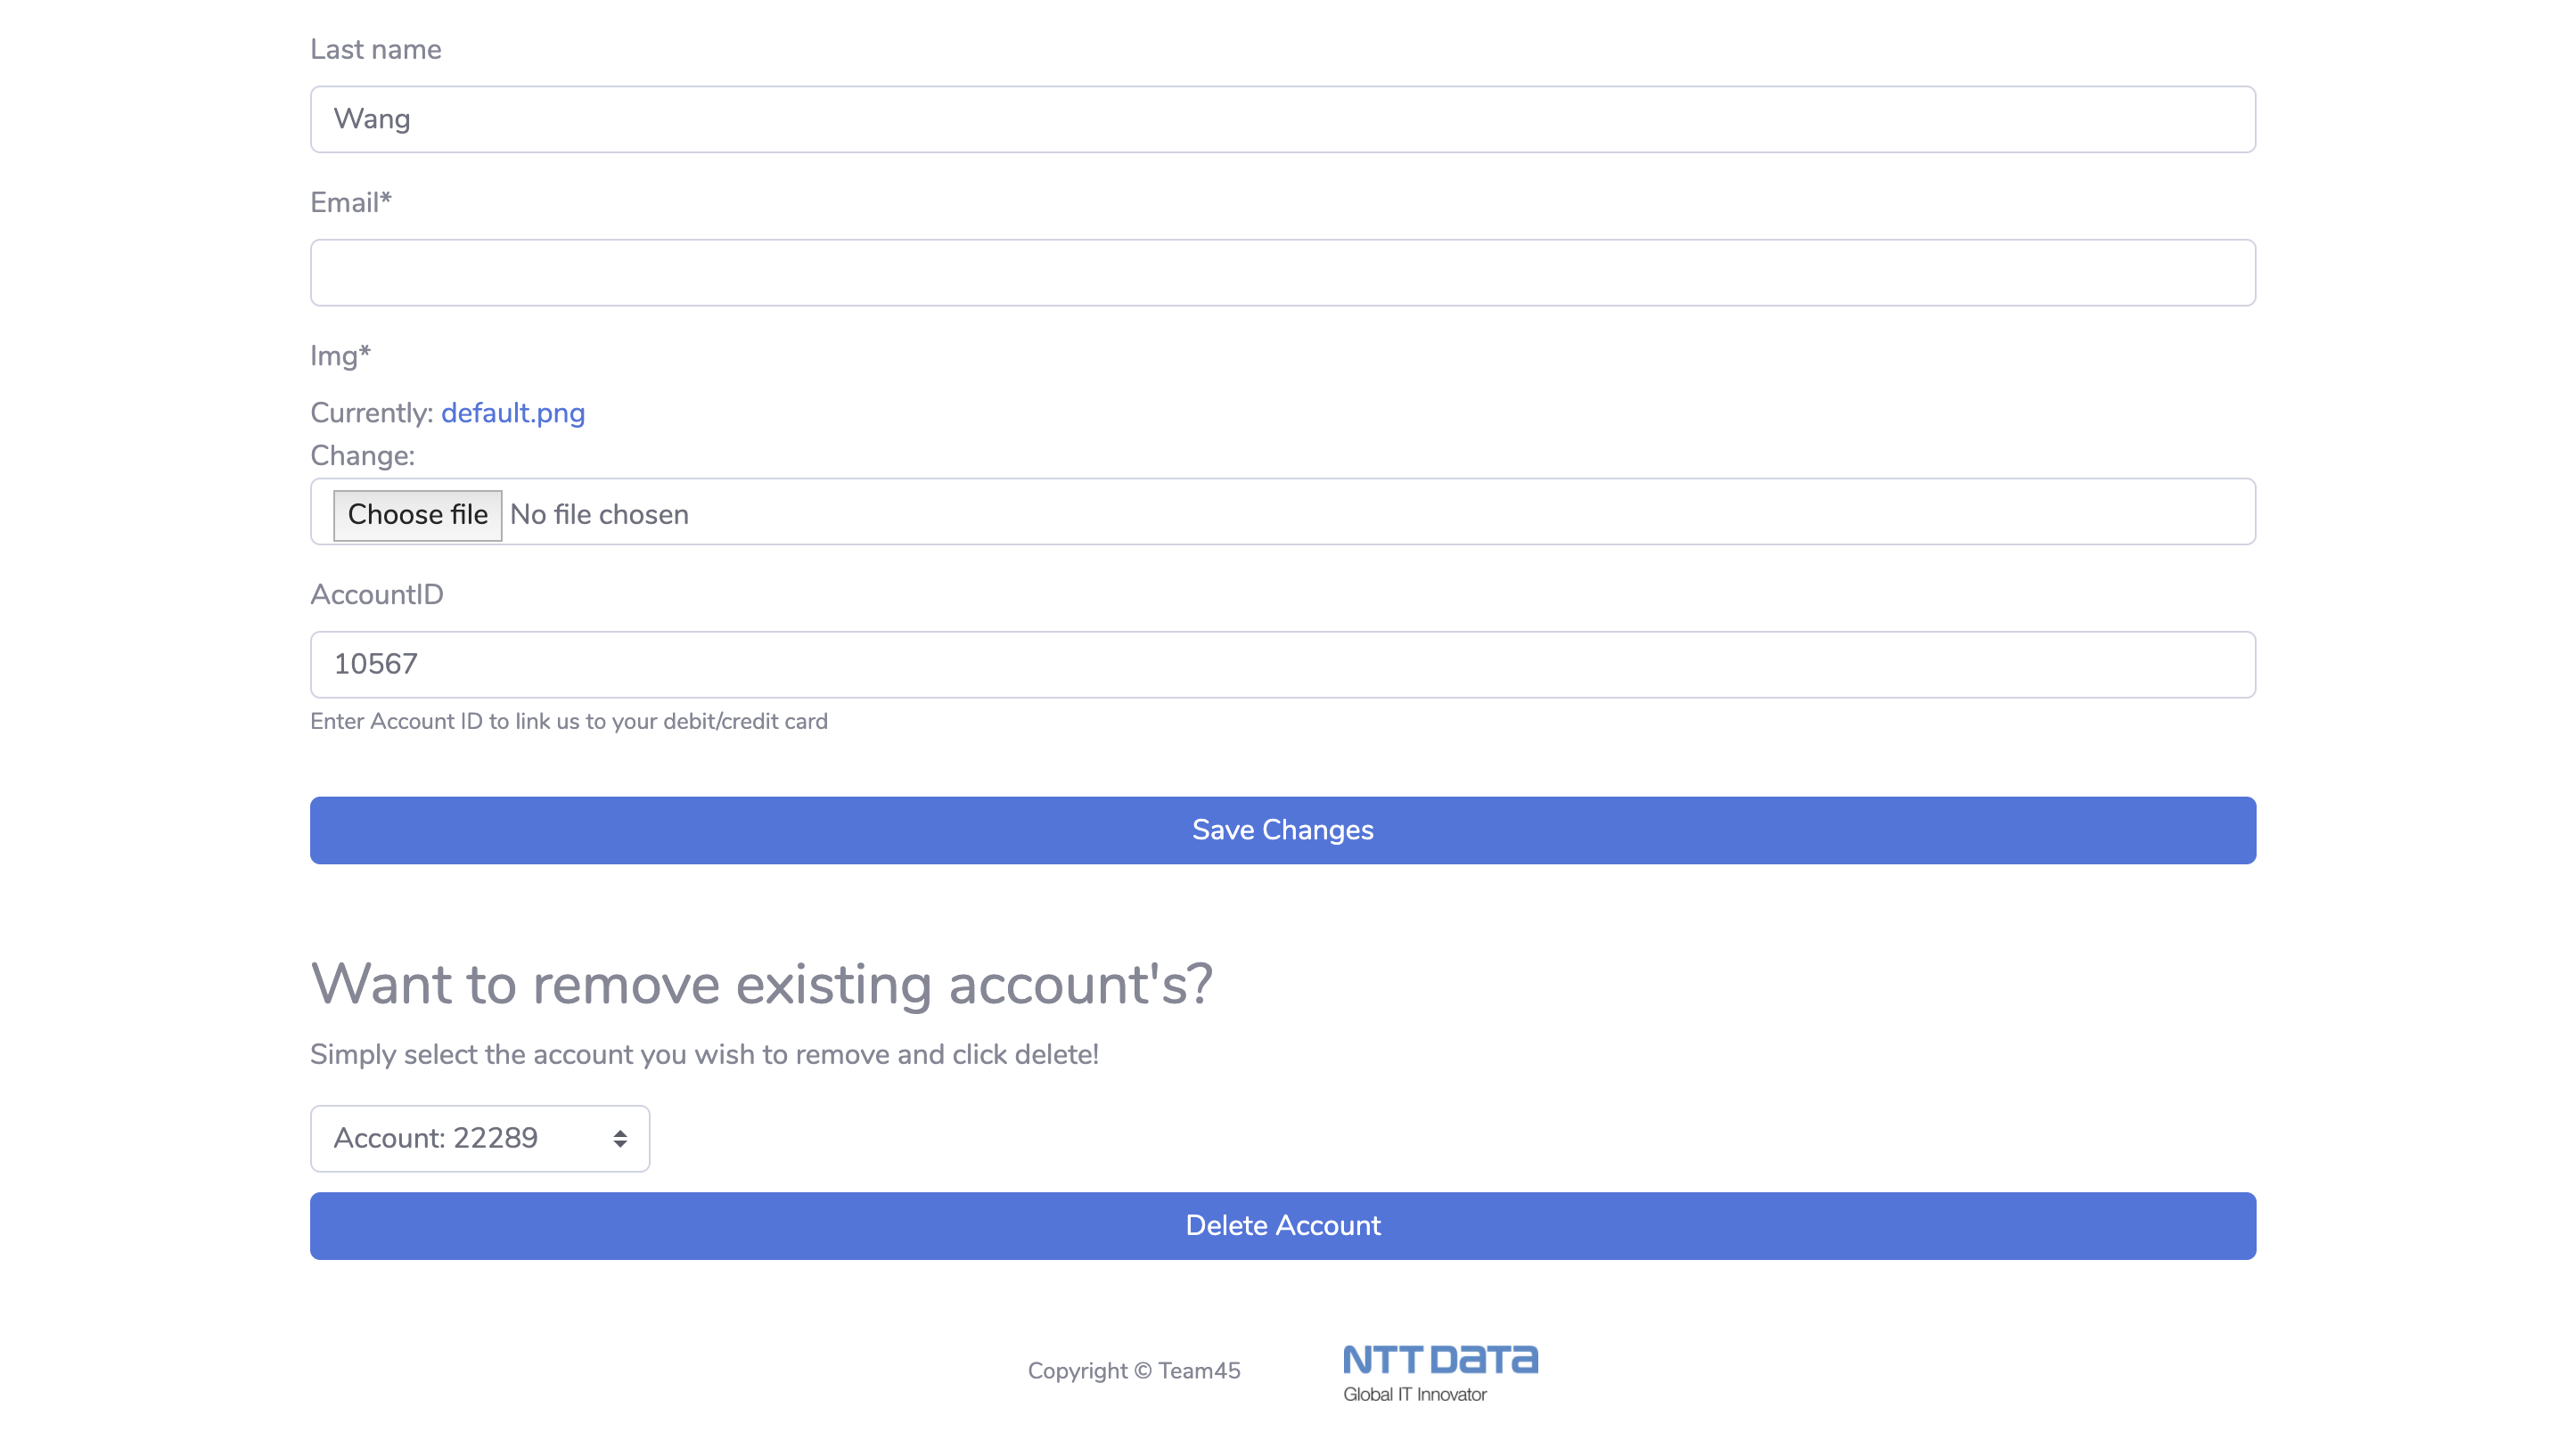
current webapp allows users to add
multiple accounts. (Current and Credit Card)
Being the key idea of Open Banking, we consolidate financial information
from
various
financial
institutions and present them together for the user, we implemented this
feature
to
allow
users to add accounts that they want to track and remove accounts that
they do
not
care
about.
Different account types, such as current accounts and credit cards can
be
tracked.
3 / 11
3. Help
system providing user feedback
and queries
We implemented a help page which allows users to submit feedback and
questions
regarding the
web app. The query will be saved in the admin page in Django framework
and be
sent
to our
admin email.

4 / 11
4. Users
have a centralised view on their
finance
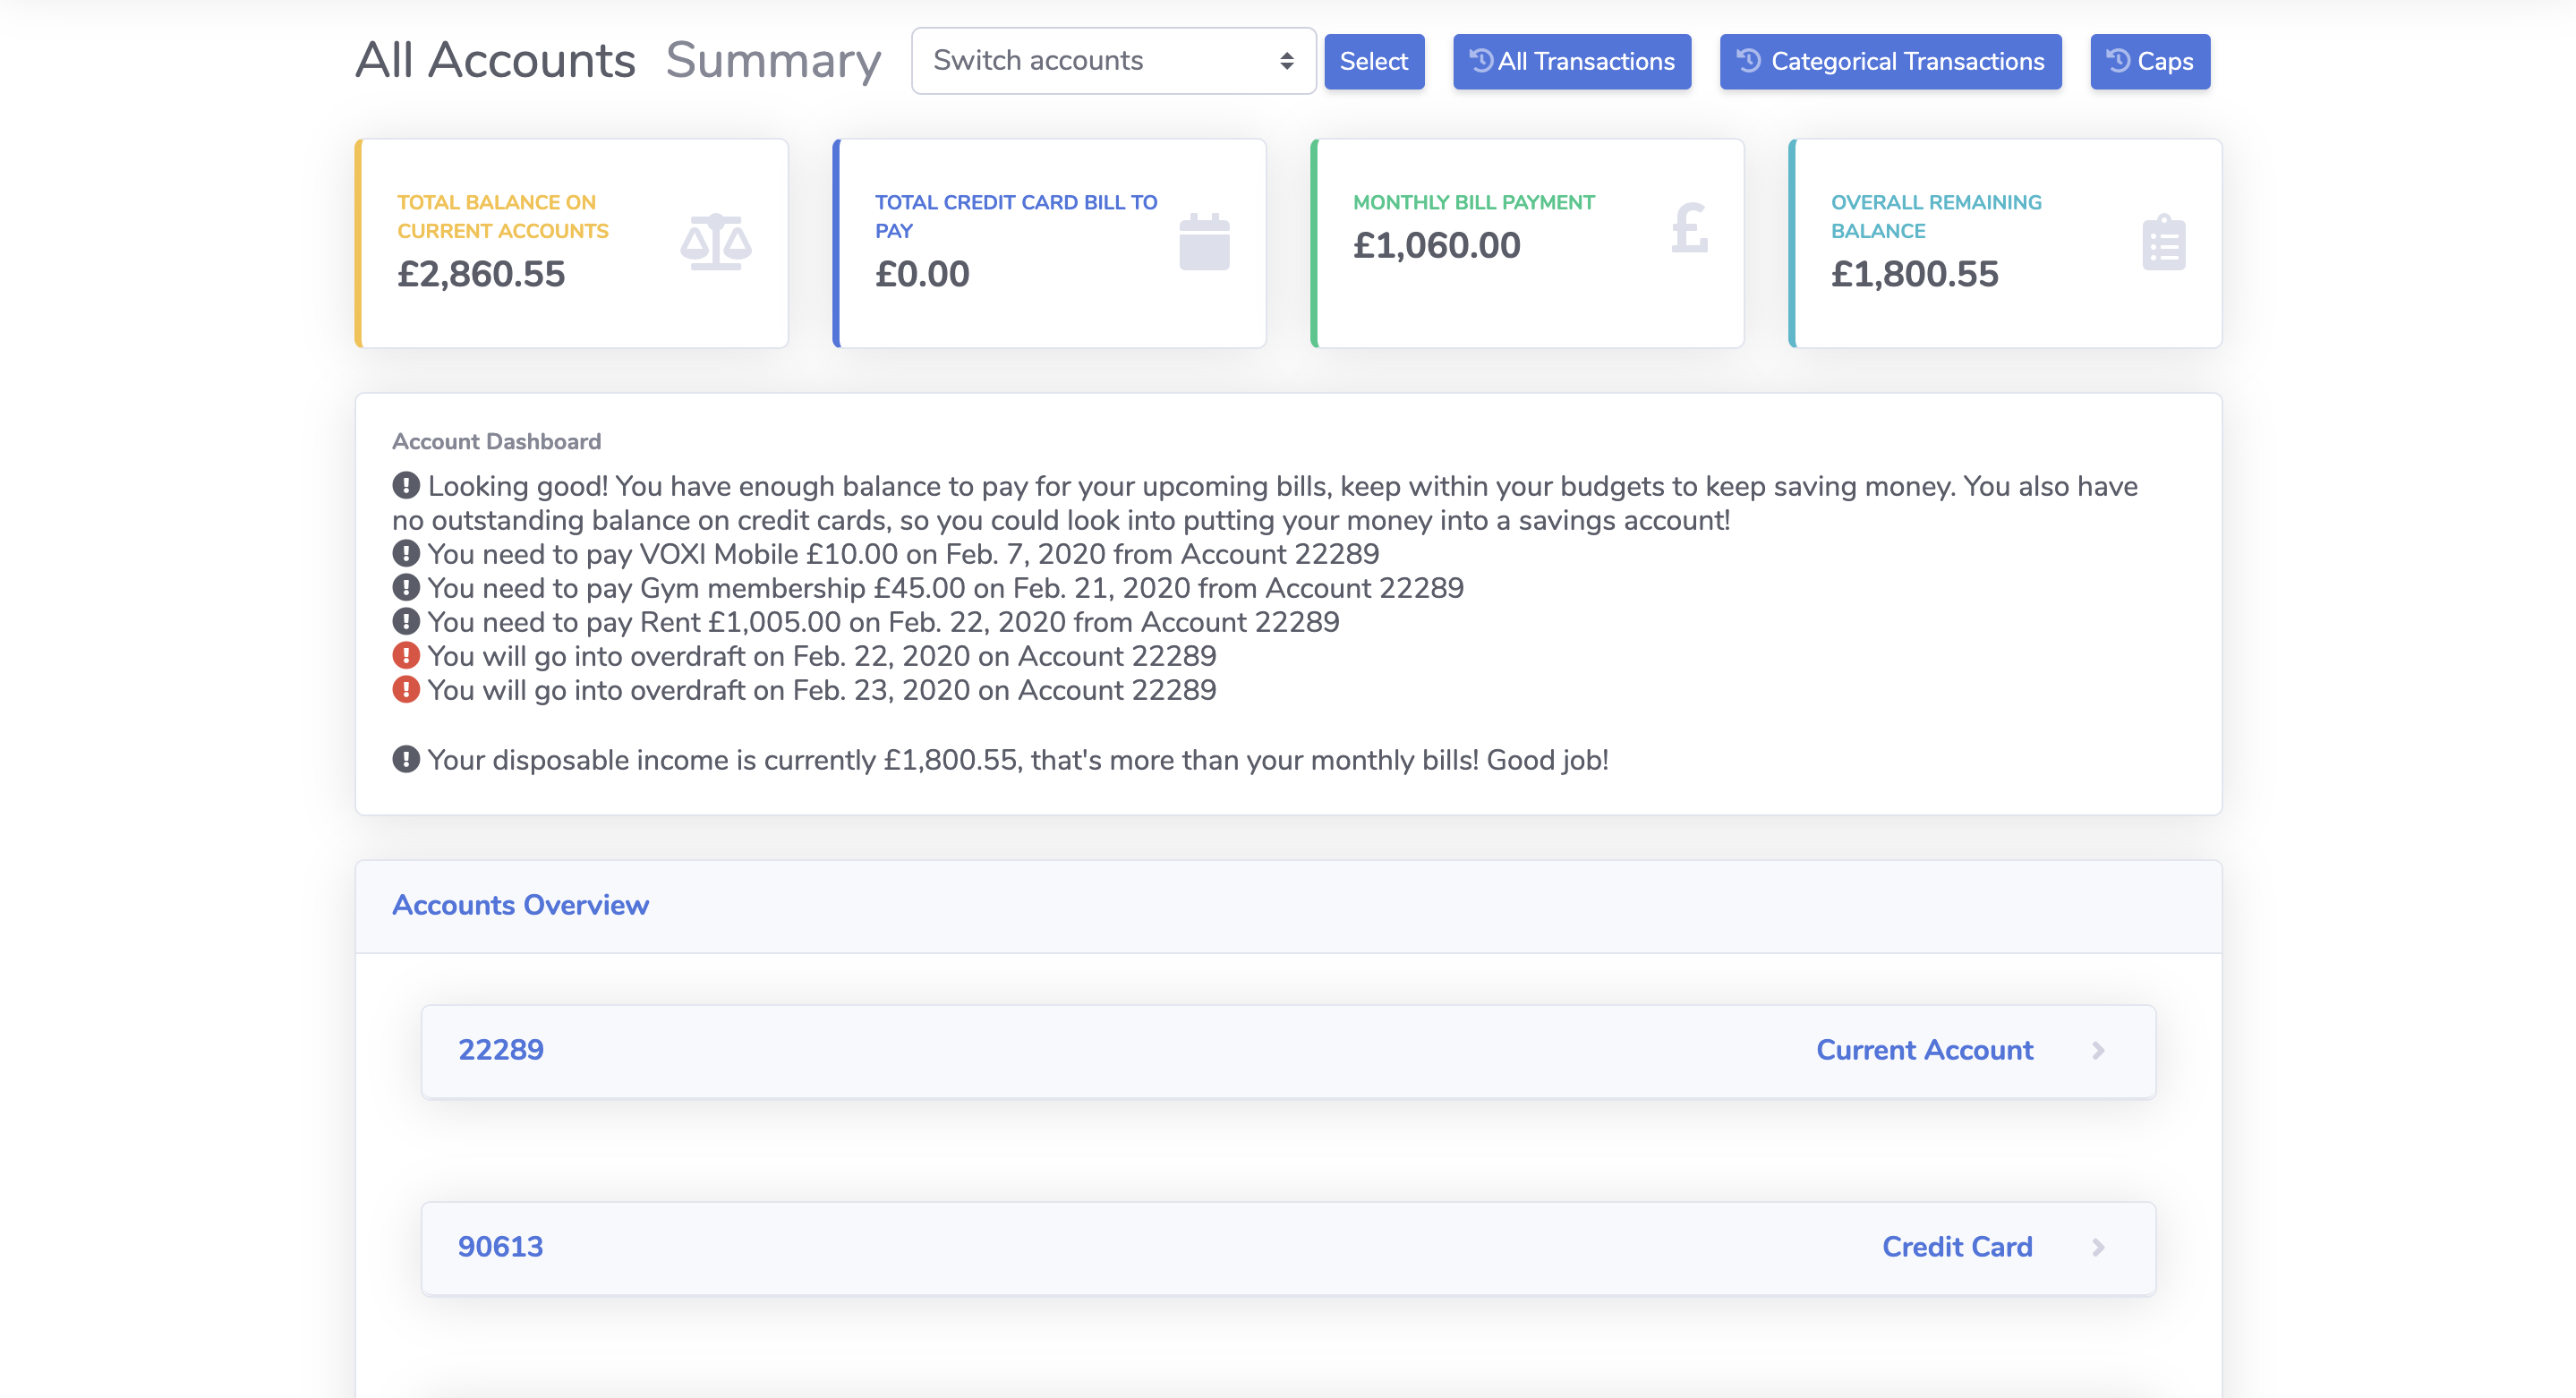
Since multiple accounts are connected, our web app have a summary page
that
compiles
financial
data from all accounts and shows the important financial tips, bill
reminders
and
overdraft
warnings. This allows the user to see a full financial overview on
various
accounts.
Meanwhile,
we also have summary pages for current accounts and credit cards
separately as
they
show
different insights into different types of accounts. Users thus could
understand
their
financial
data better.
5 / 11
5. Financial data
is
categorised
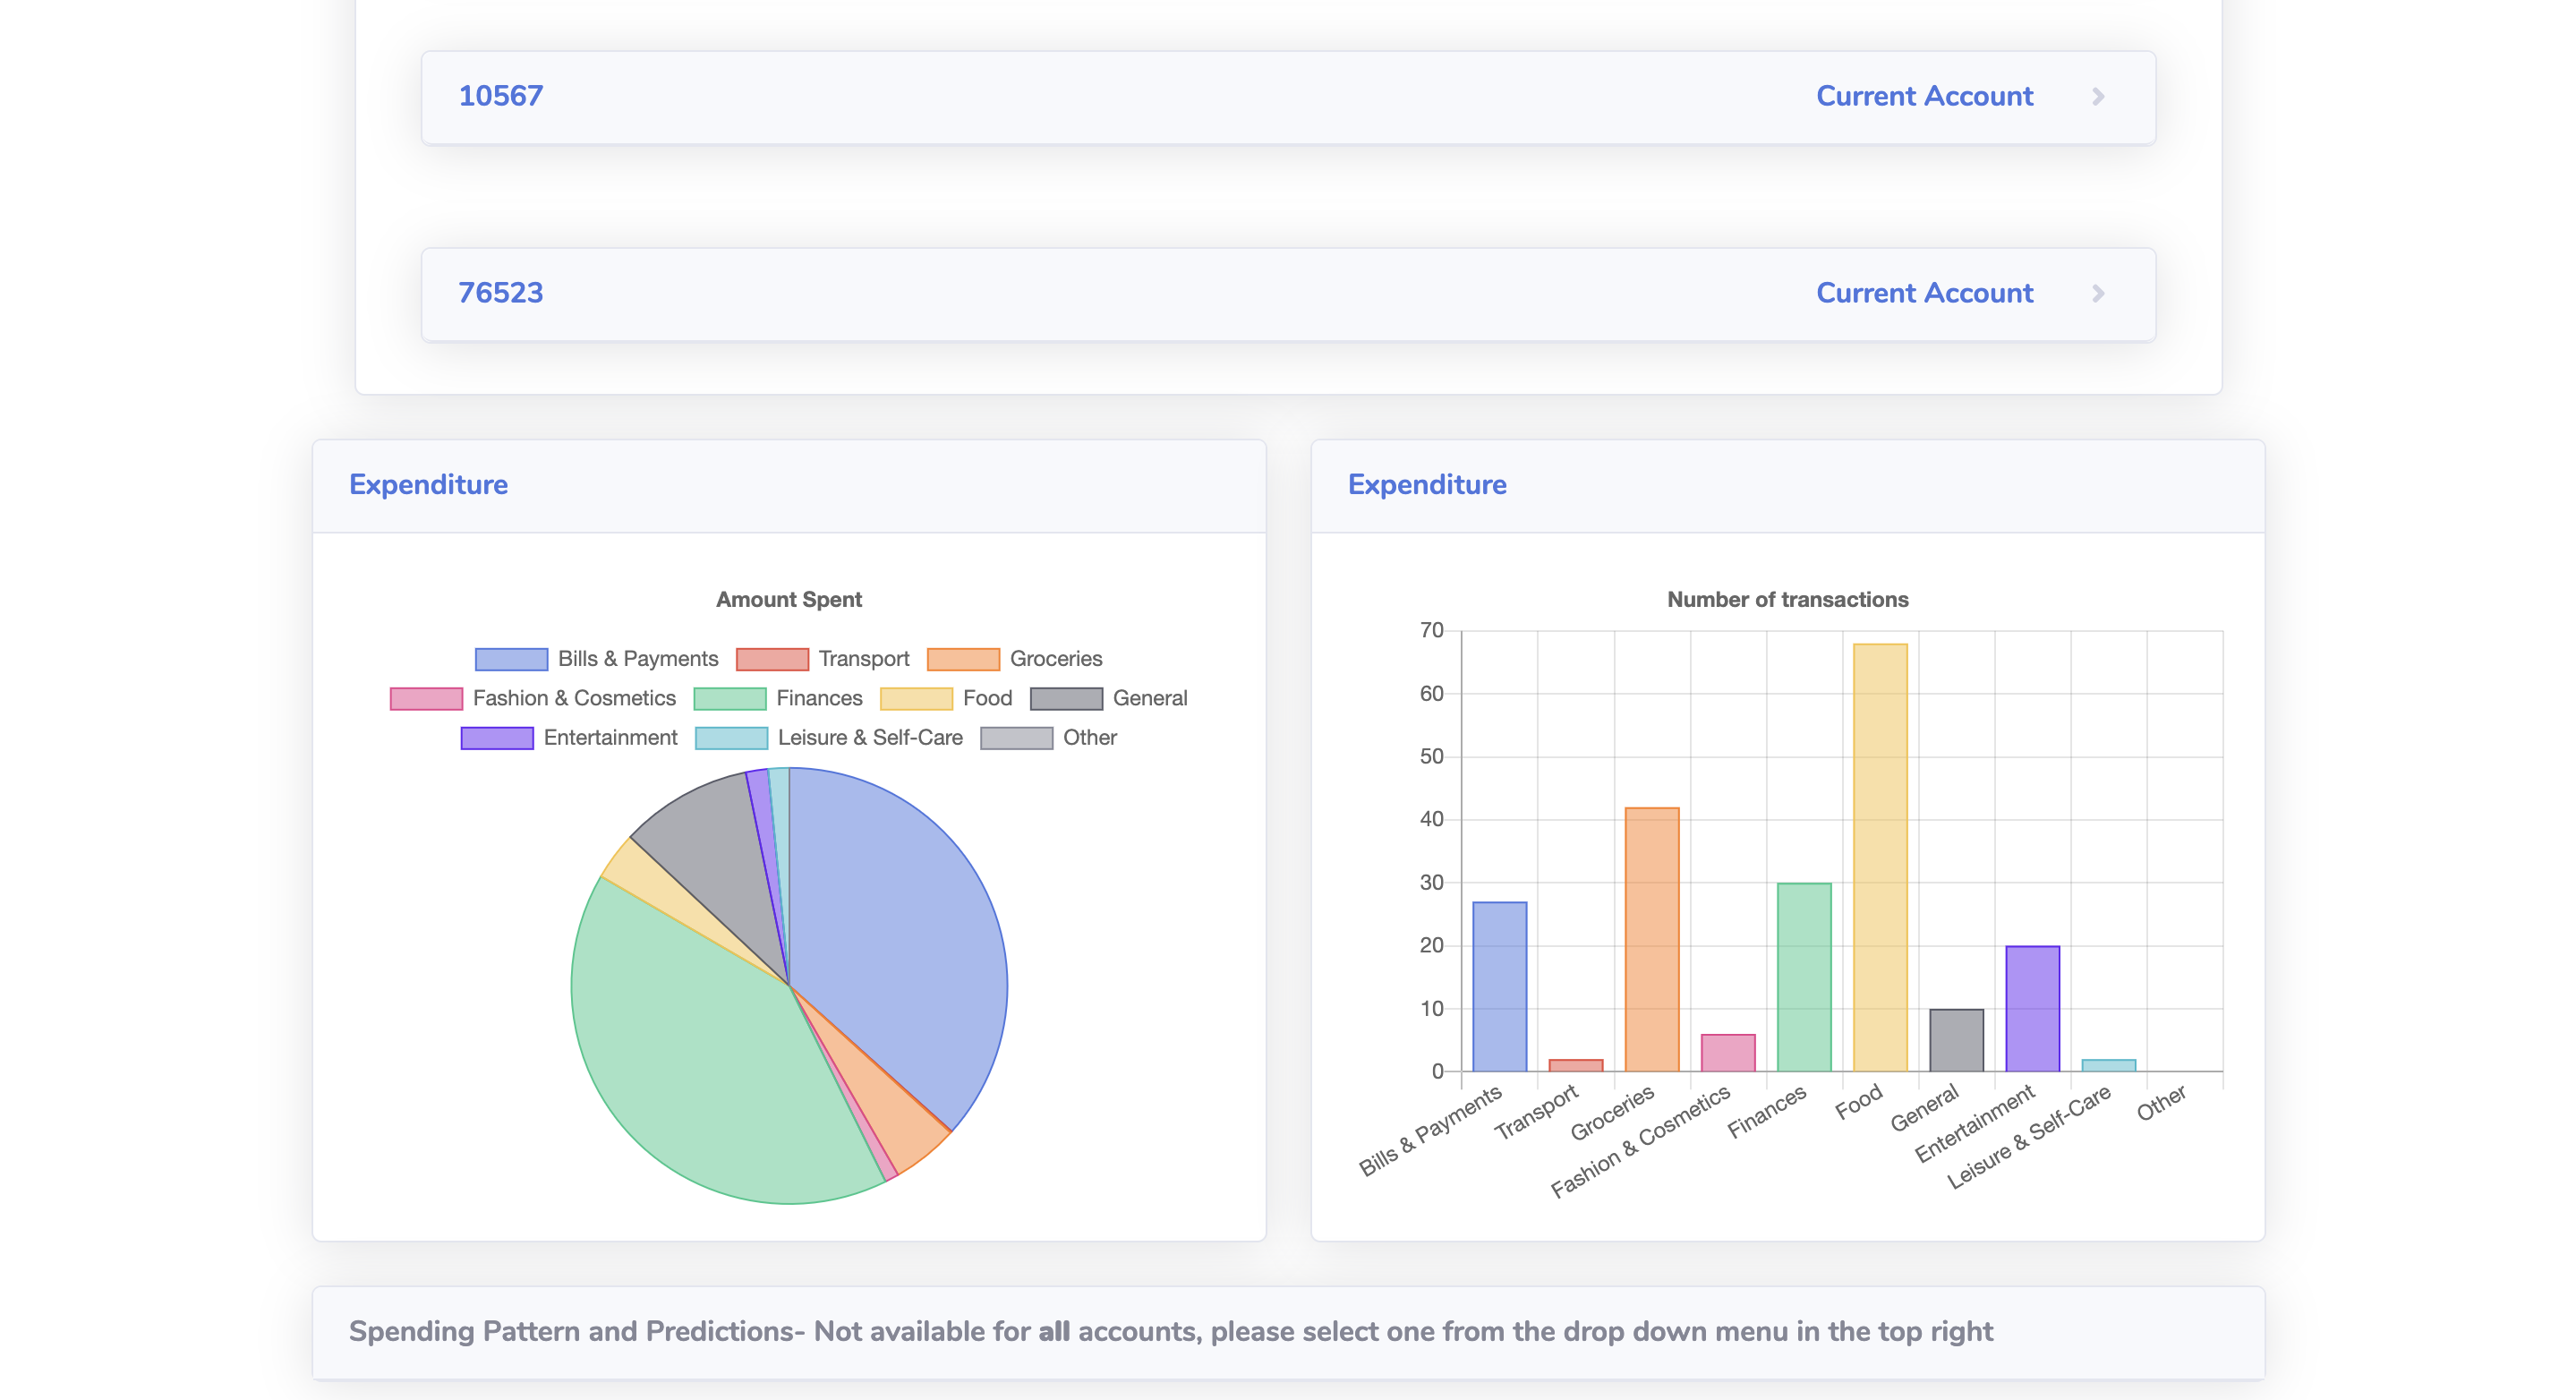
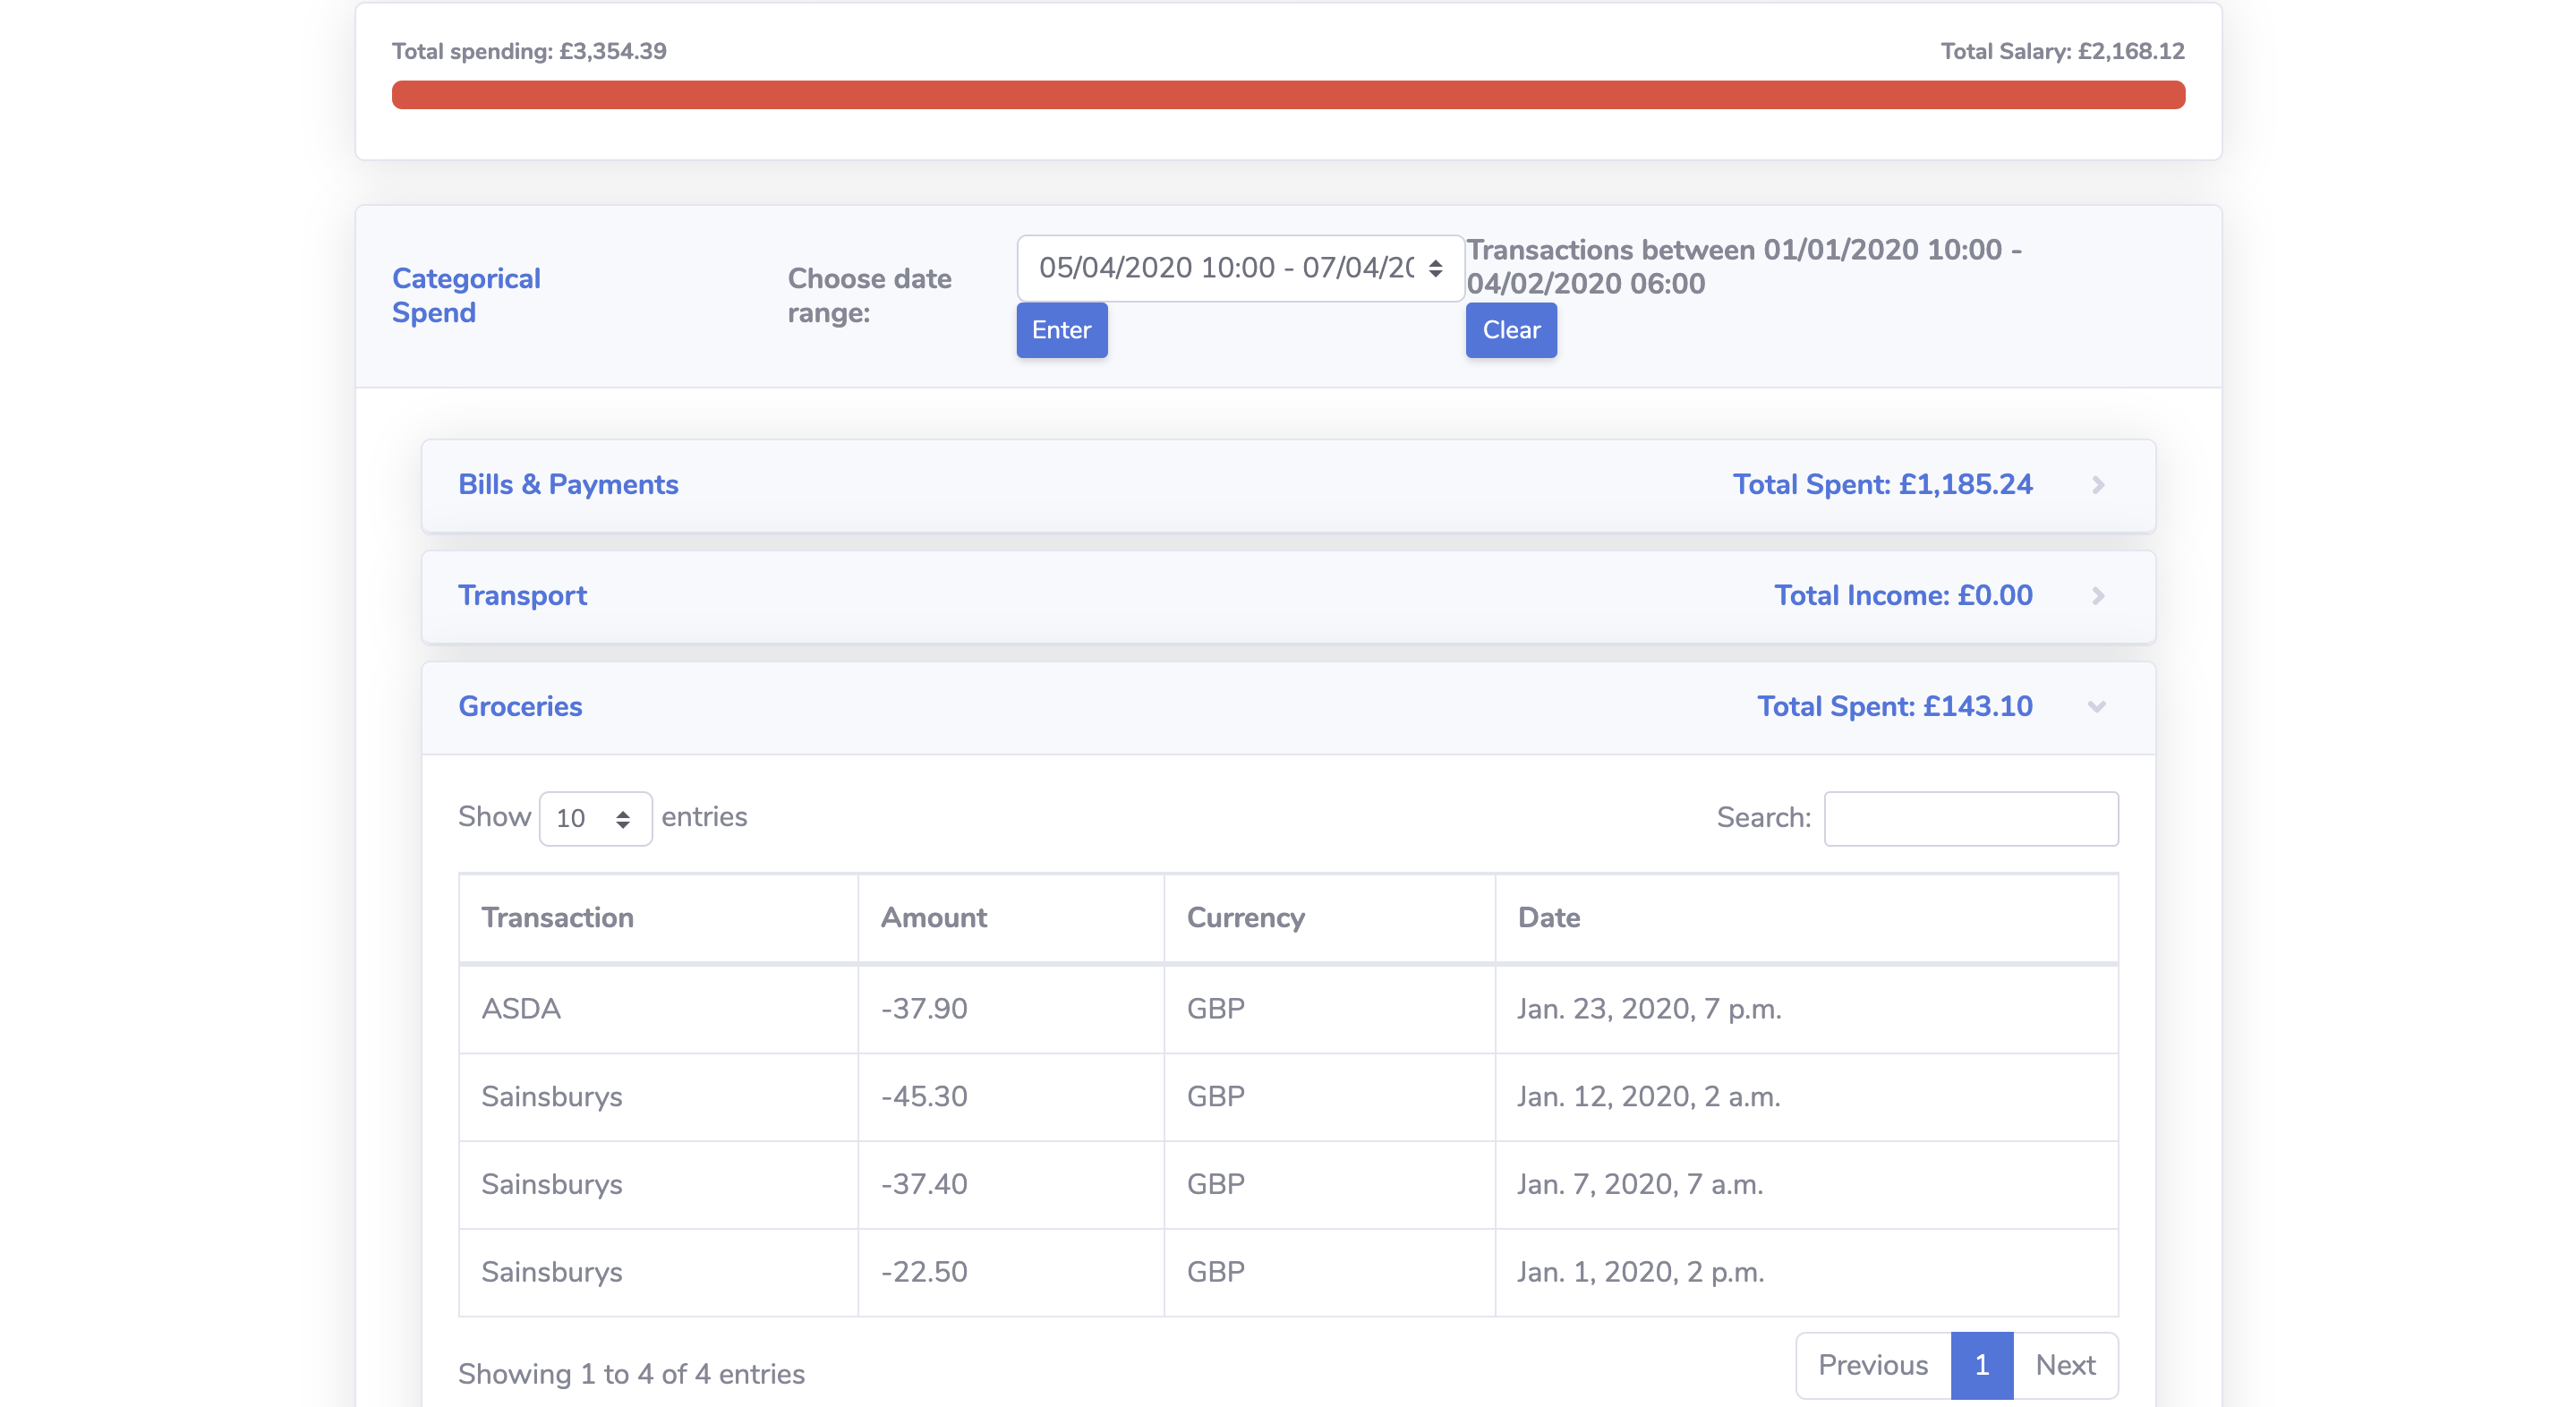
Financial transactions are categorised under 'Bills & Payments',
'Transport',
'Groceries',
'Fashion & Cosmetics', 'Finances', 'Food', 'General', 'Entertainment',
'Leisure
&
Self-Care'
and 'Other'. This provides the user with a deeper understanding
regarding their
financial
expenditure.
To categorise financial data, we used Merchant Category Code that comes
with
every
piece
of transaction data provided by Open Banking api. It allows extra
accuracy in
categorisation
compared to the machine learning model we have built.
6 / 11
6. Bill
reminders
Bill reminders are catered towards each account. it analyses the
information
about
all
direct debits on an account and display active direct debits with next
payment
happening
anytime from now to the next statement day. Bill reminders remind users
of the
date
and
amount they have to pay the bills so they could decide if they want to
save some
money
for these bills.
7 / 11
7. Dynamic data
visualisation using
Chart.js
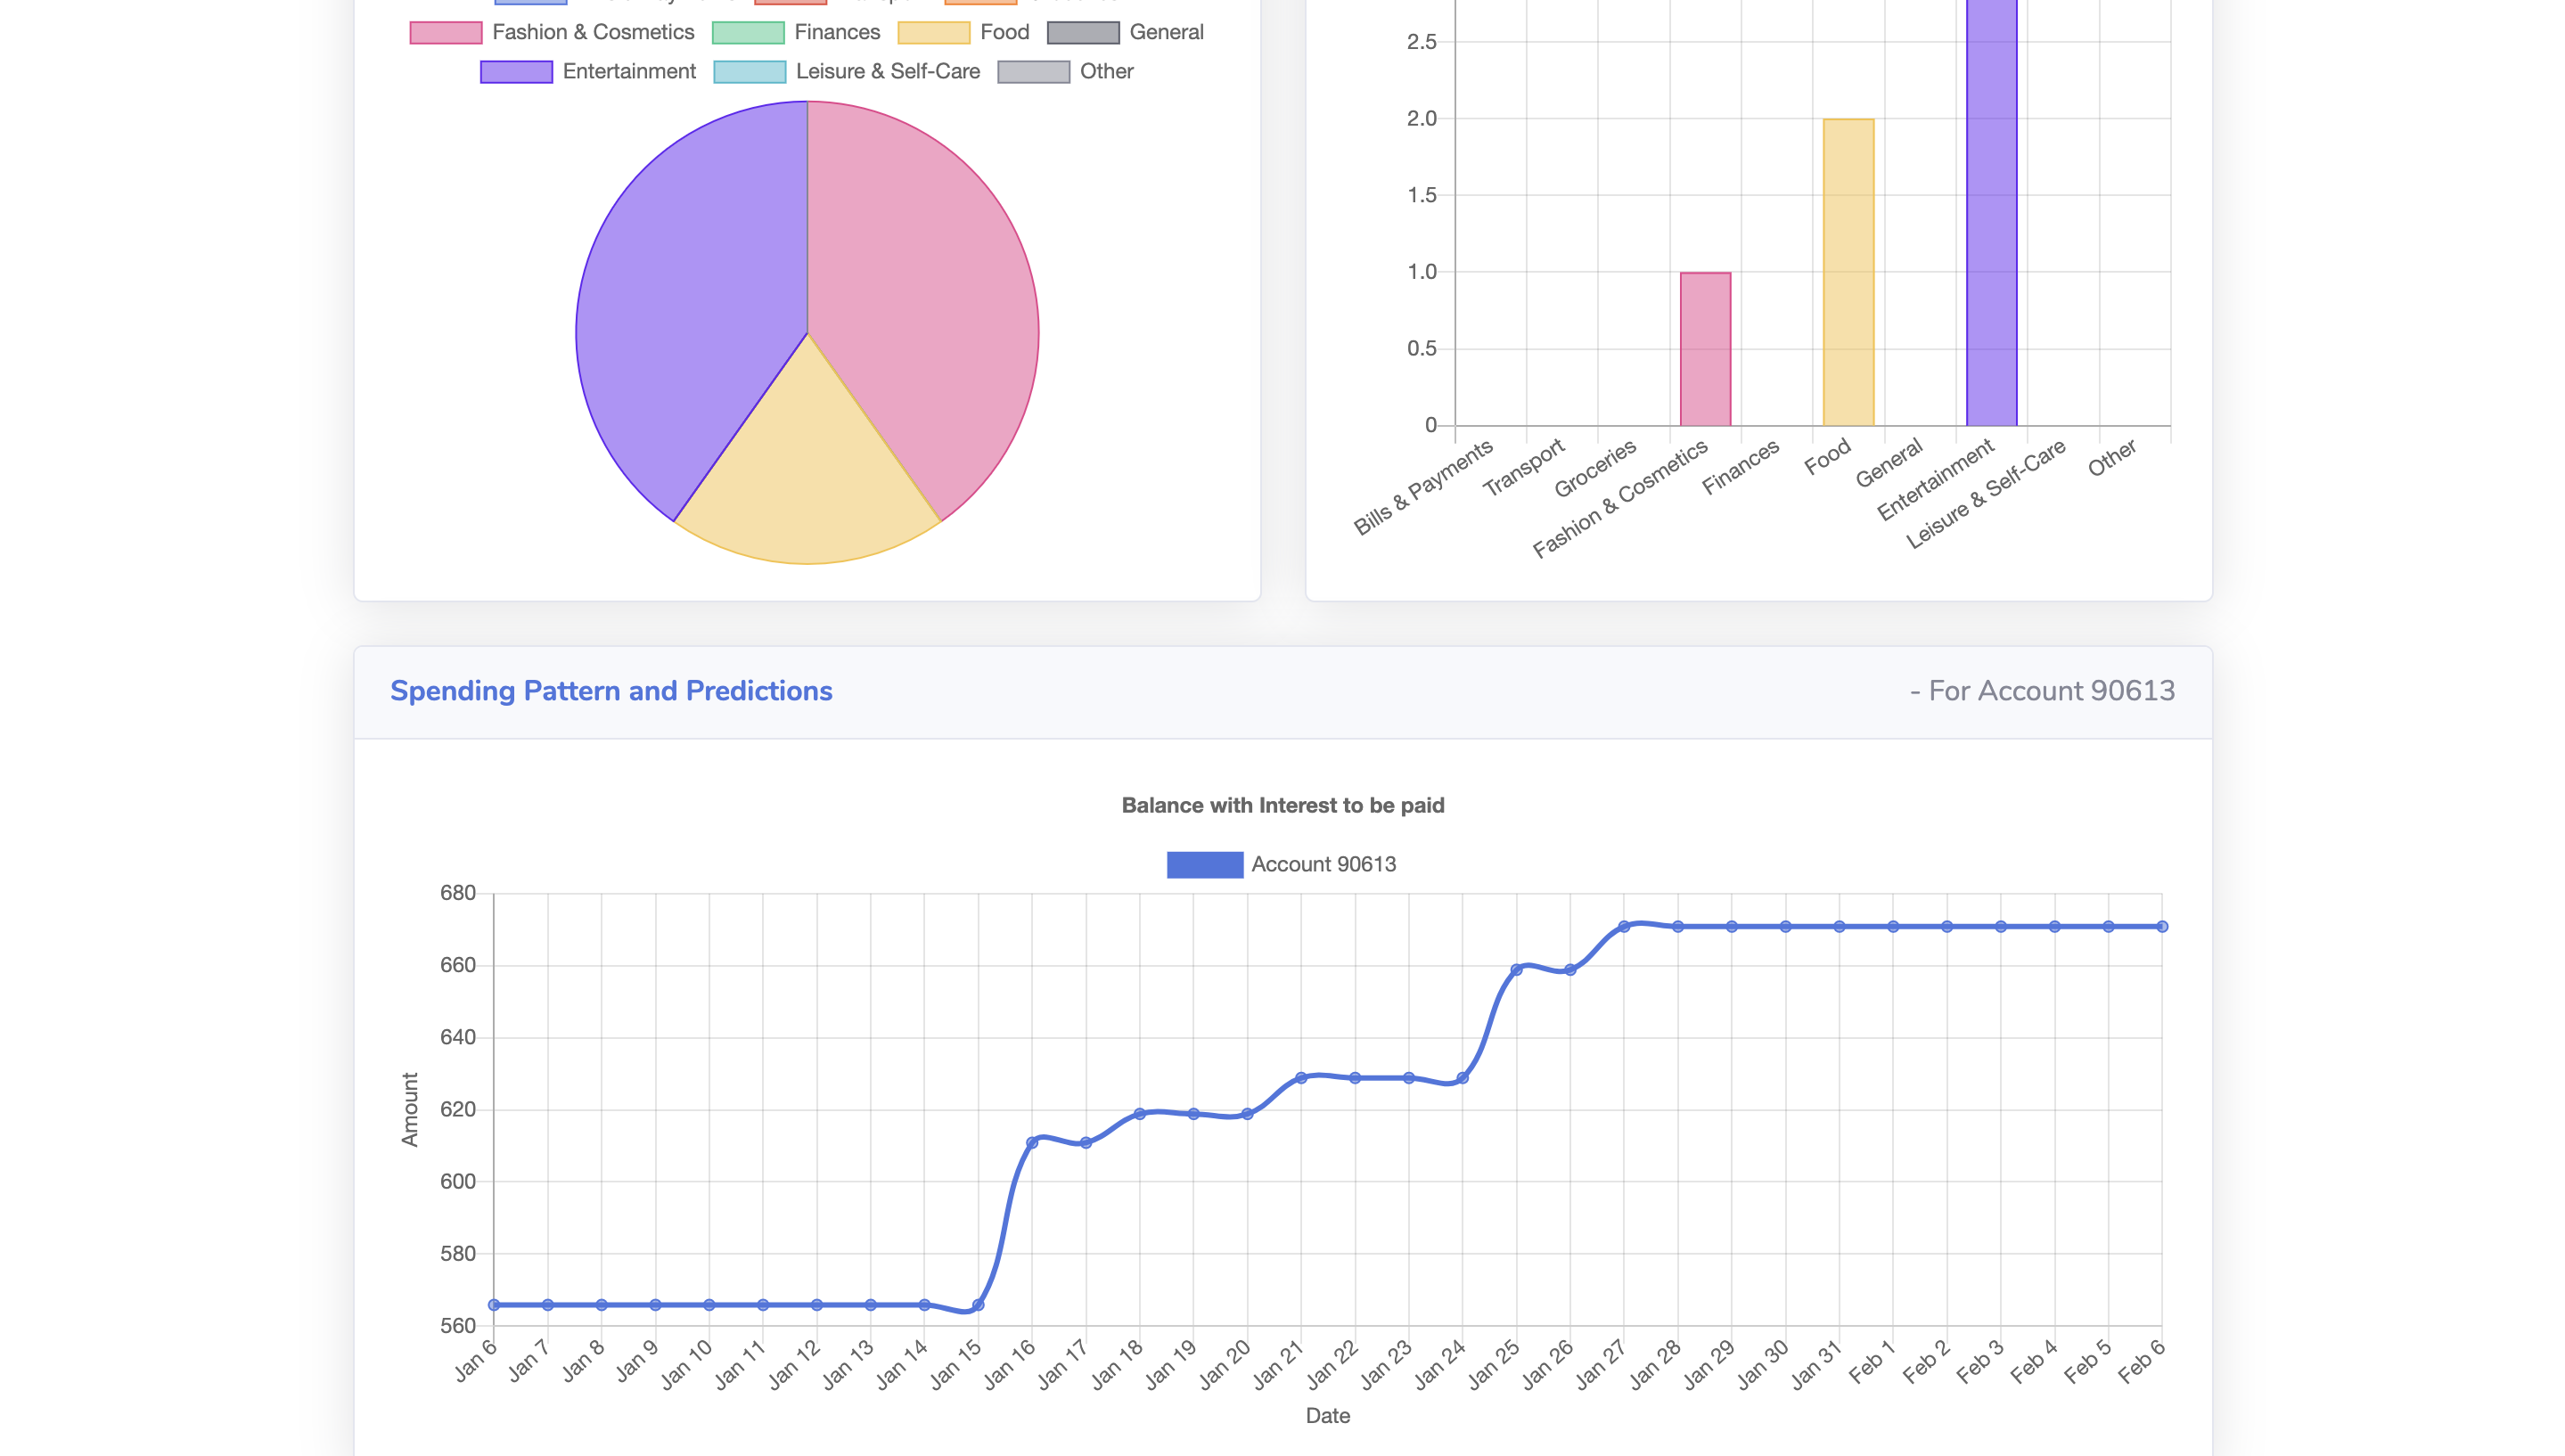
Our visualisations are made using Chart.js. After processing and
cleaning the
data
in our
Django model, it is then used in our charts. According to the account
selected,
the
visualisations will reflect the respective account. Using customised
tooltips, I
have
successfully formatted the tooltips to display the correct number format
as well
as
currency
(e.g categorical amount spent pie chart), as well as adding lines to the
predictions
graph
if there were multiple accounts selected.
8 / 11
8. Budgeting
Caps
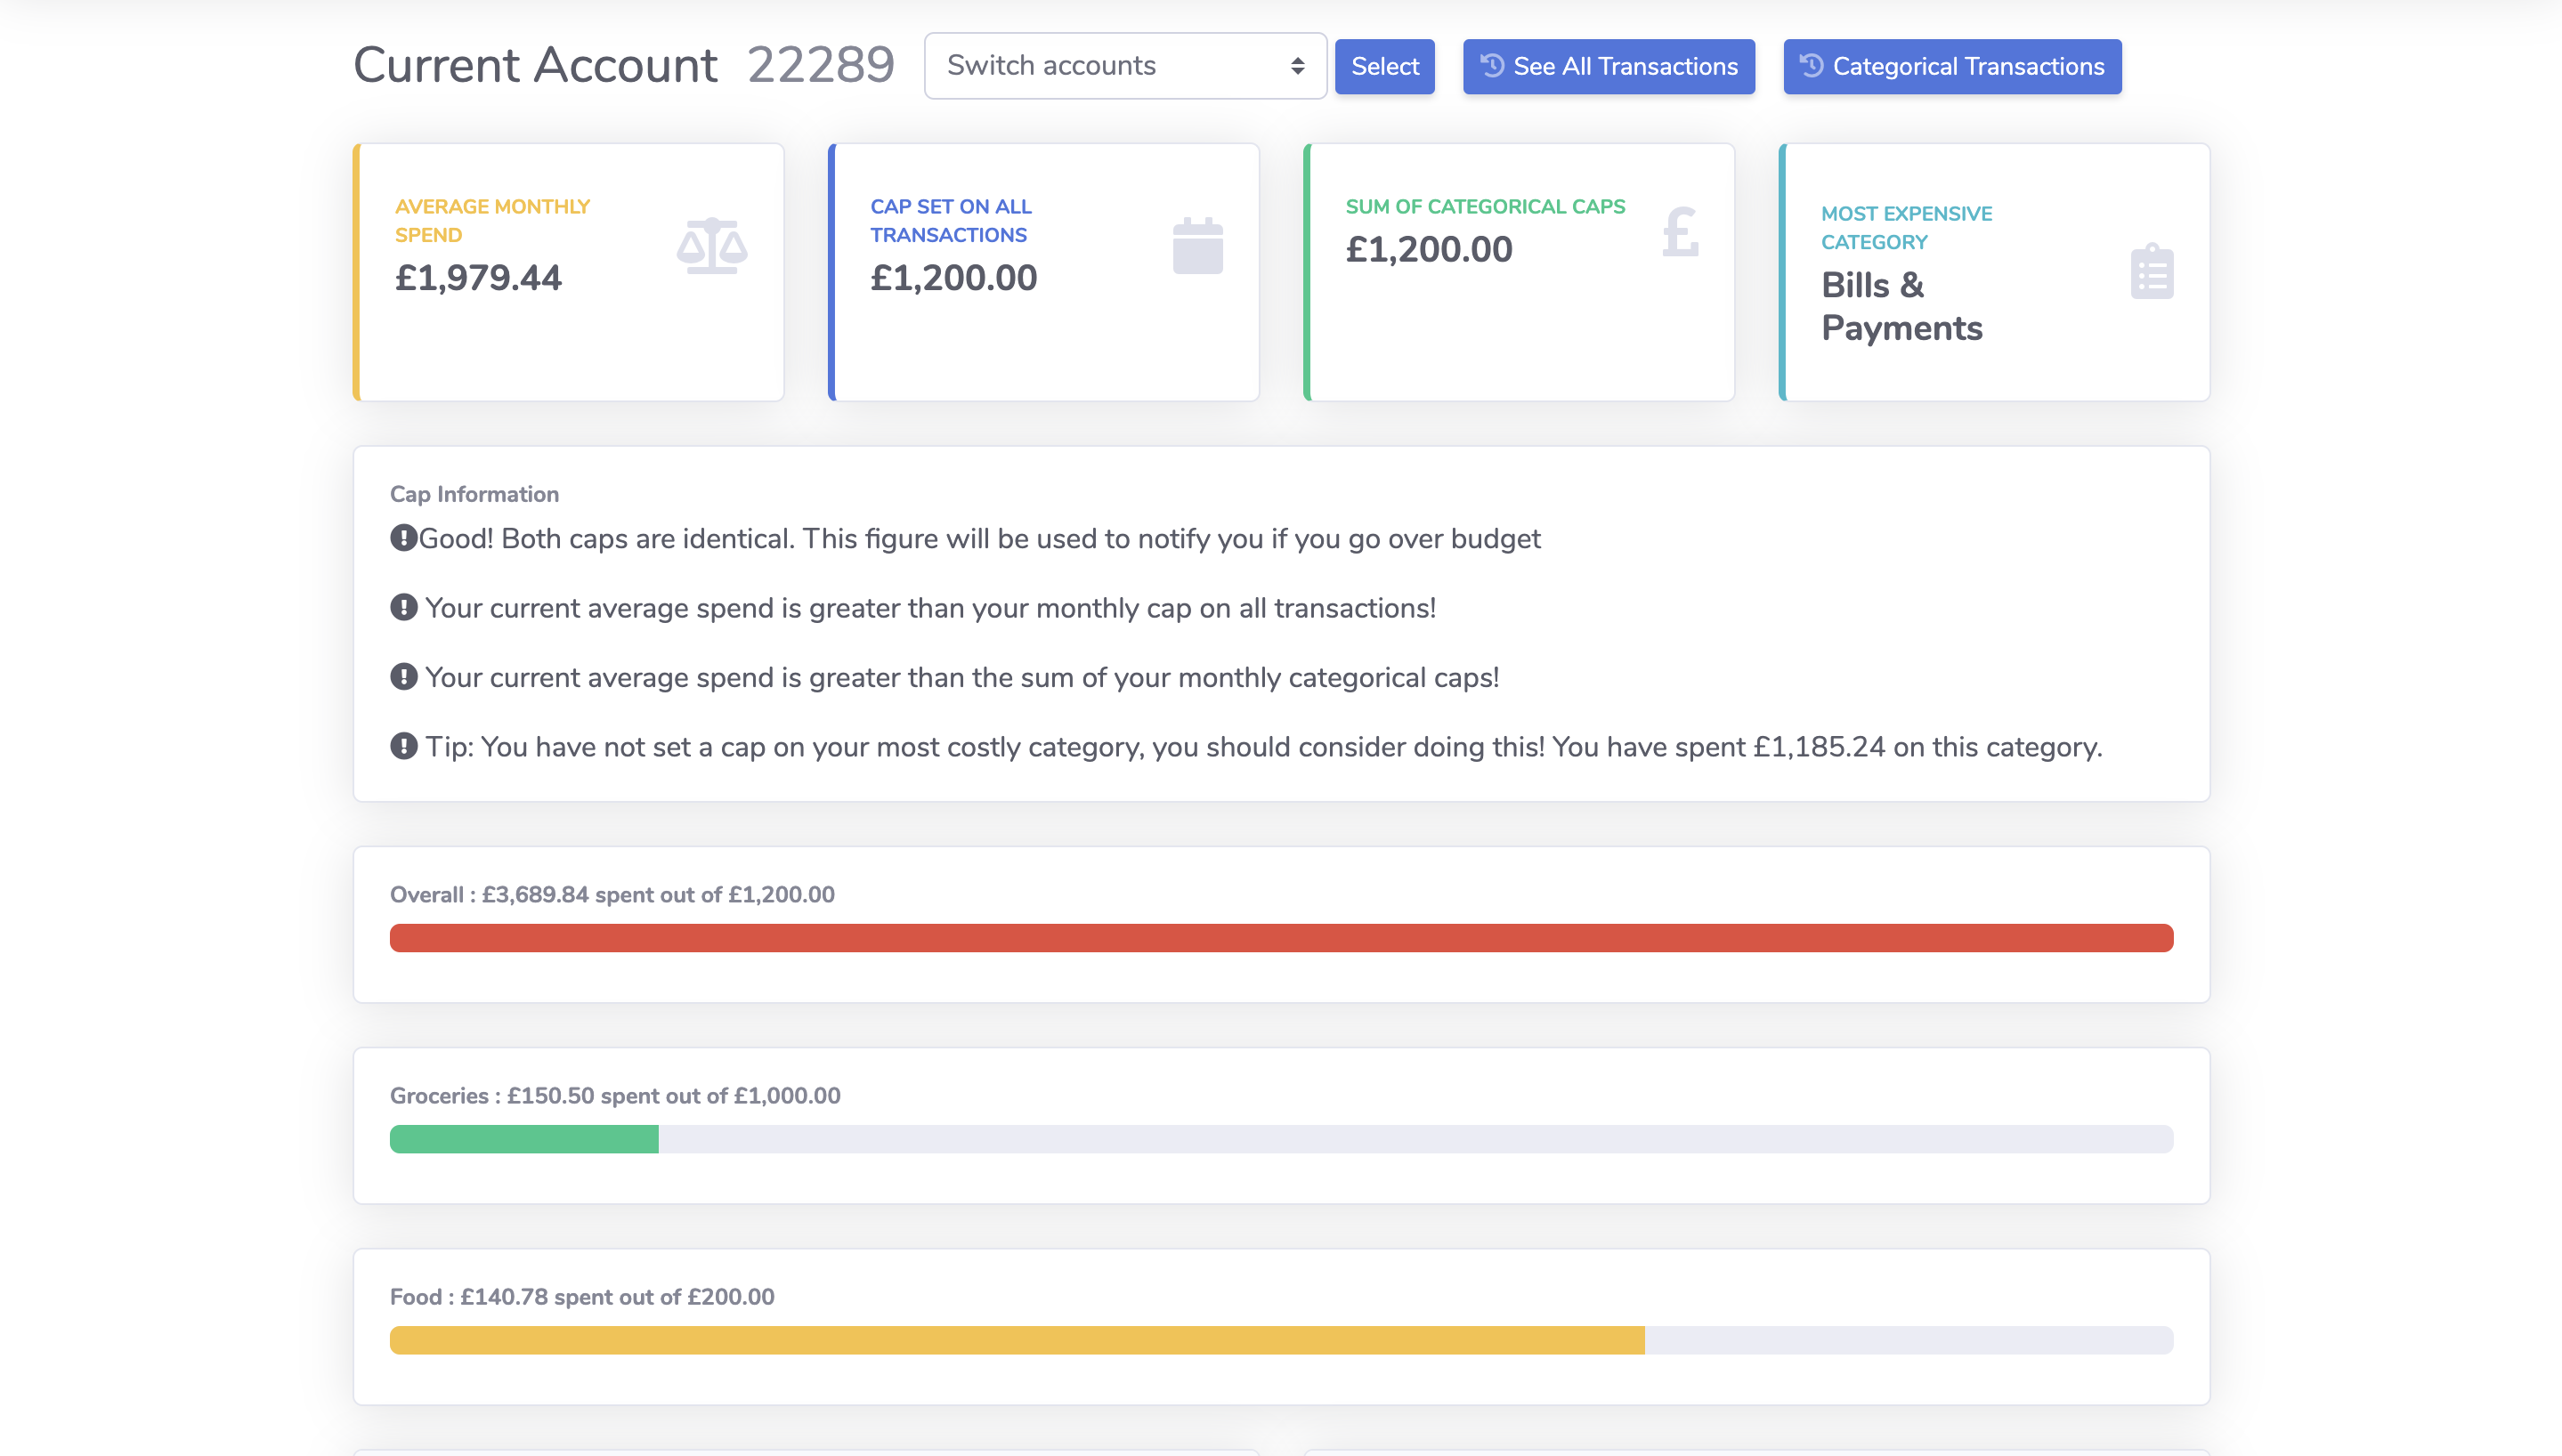
Using our budgeting caps, we can display whether the user is managing
his/her
finances
wisely. We have a caps page which has a list of budgets set for each
category as
well as how
much is spent for each category, if the spending is more than two third
of the
budget, the
bar
will turn yellow, notifying the user that he/she should spend more
wisely,
whilst
exceeding
budget would turn the bar red, therefore signalling that the user has
spent more
than
his/her
set budget. We believe this feature would assist the user in their
financial
management.
9 / 11
9. Data
predictions
On our categorical and full transactions page, we have a line graph
indicating
the
predicted
balance for the user. If the accounts selected are current accounts, it
would
show
the
expected balance for each day up to and including the next billing date.
Since
spending on
current accounts is more predictable, we assume users have a similar
daily
spending
as last
month and take direct debits and salary into account to produce this
prediction.
If
the
accounts
selected are credit-card accounts, it would display the past spending
trend as
spending on
credit card is more random. Instead, we will calculate the amount users
need to
pay
on their
credit cards so they do not need to pay the interest fees.

10 / 11
10. View
transactions in a certain date
range
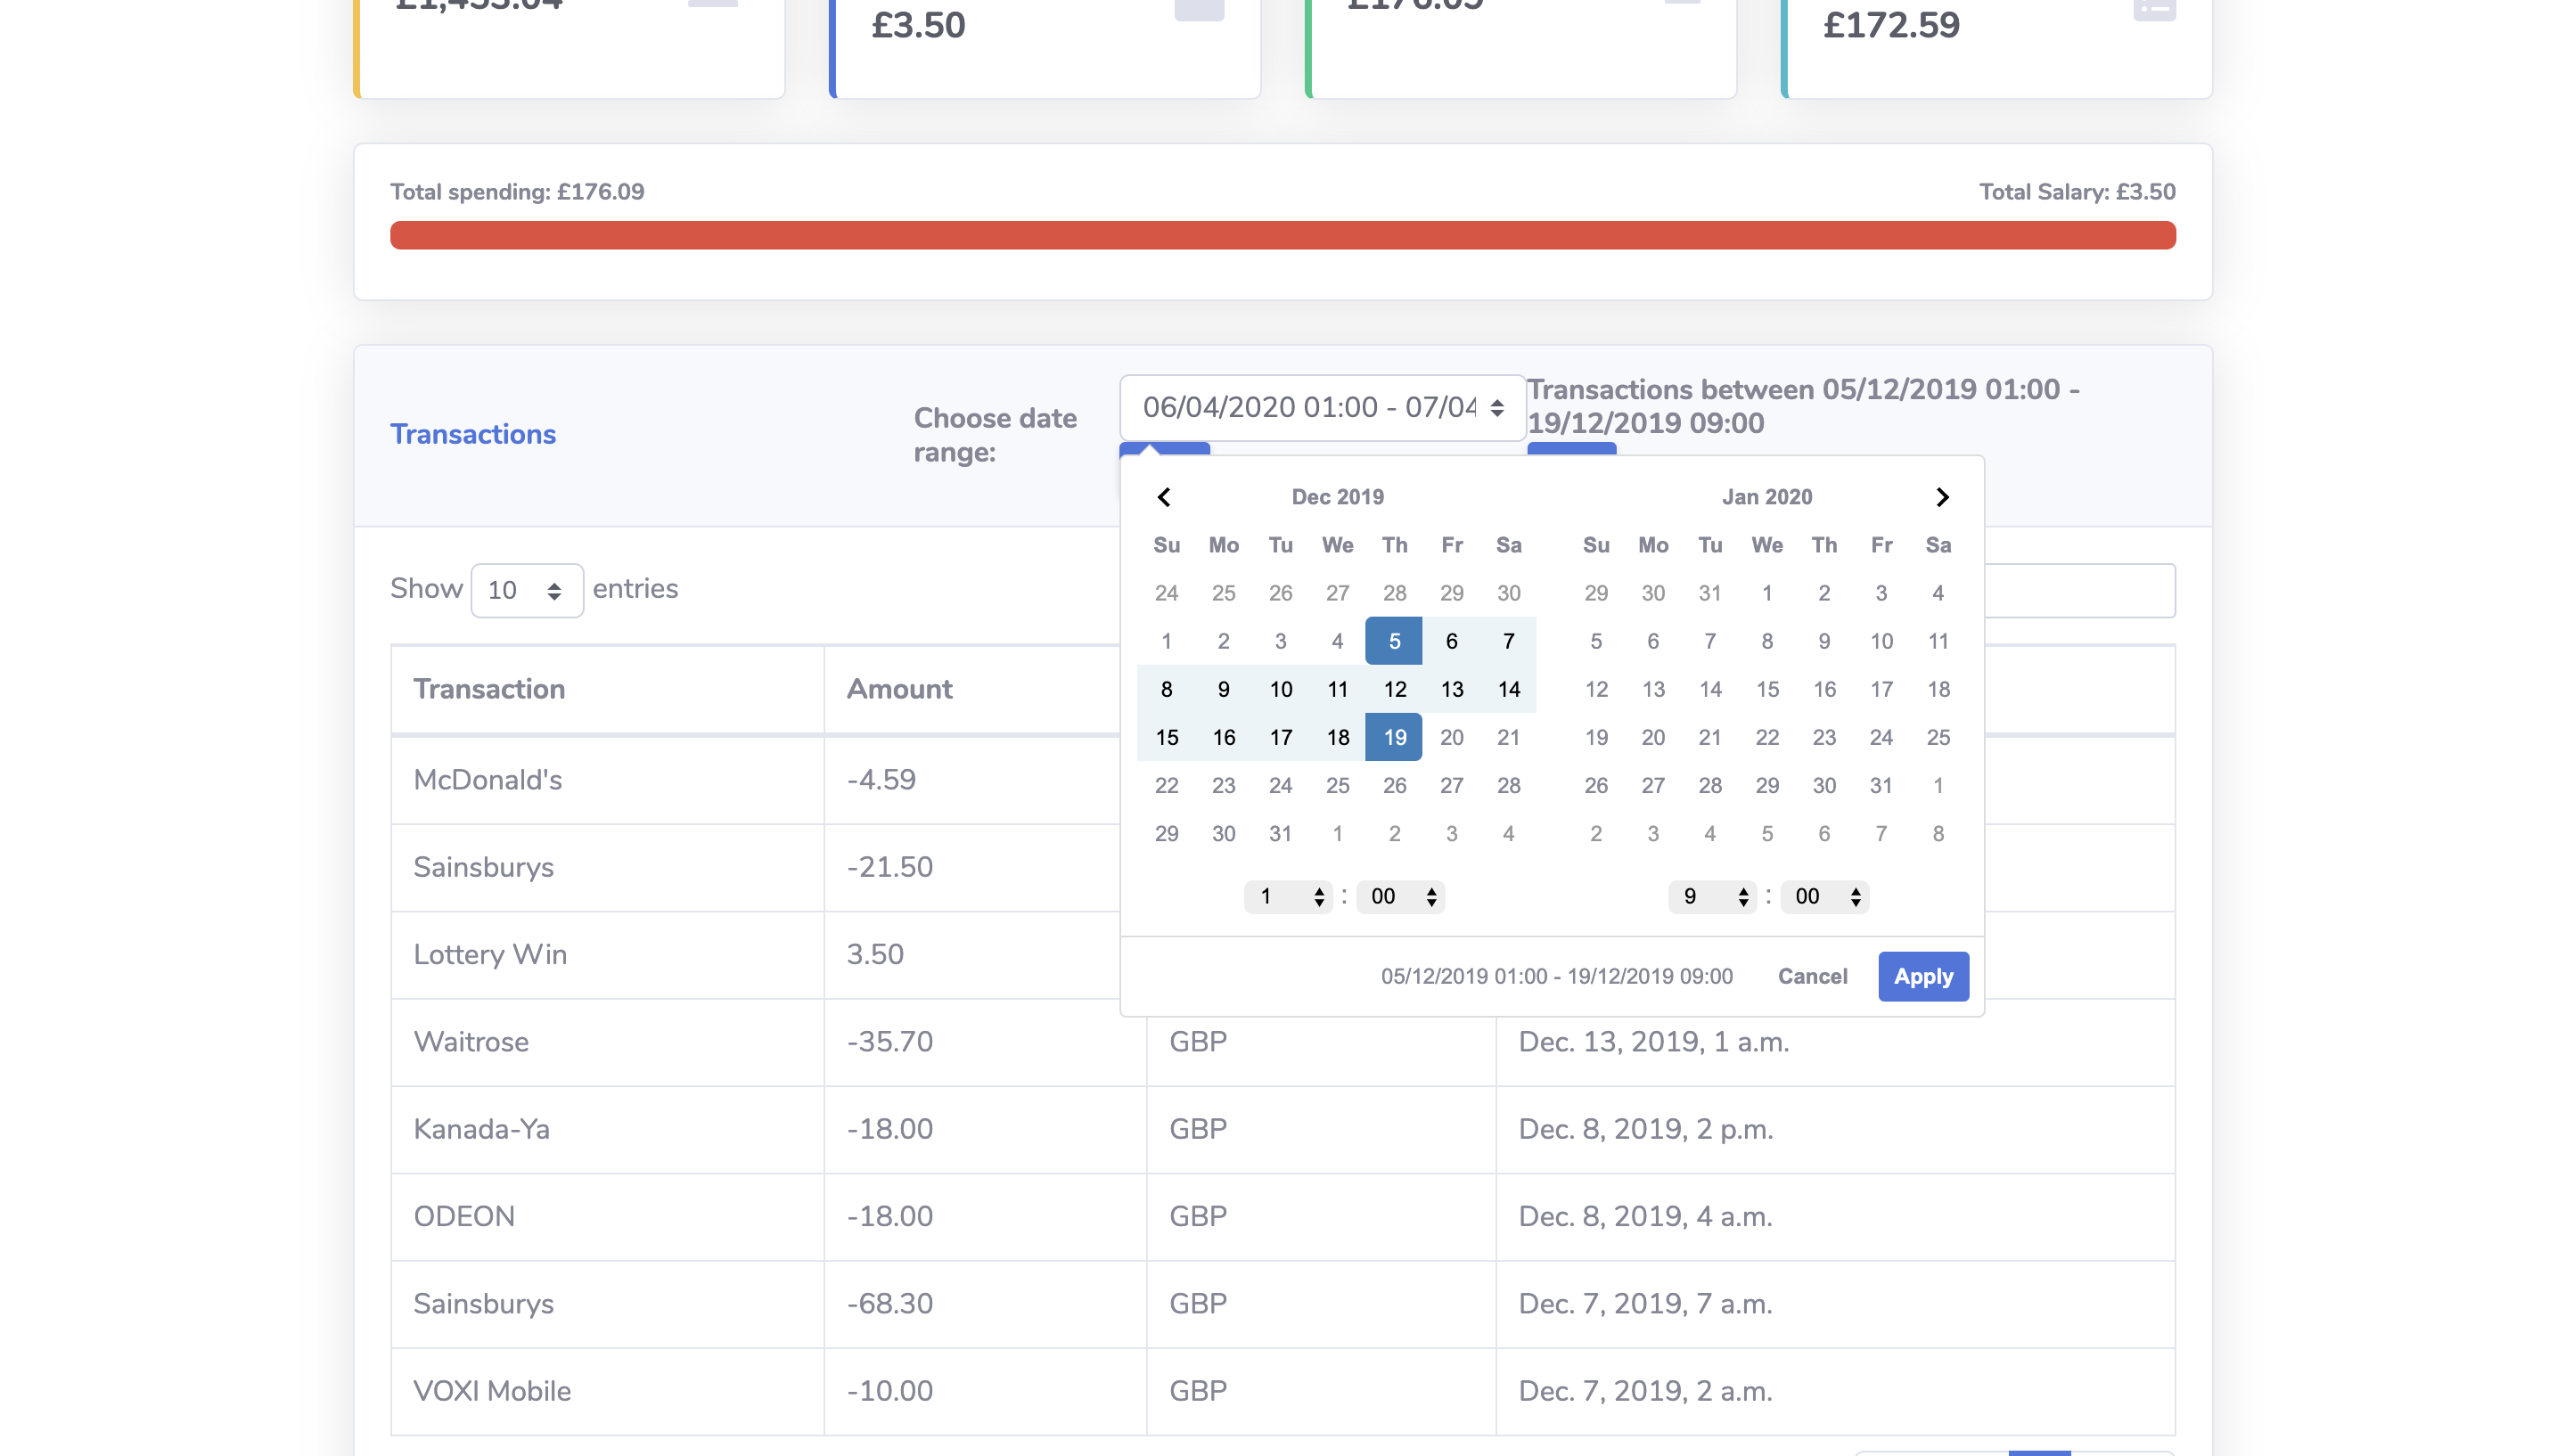
We have implemented a date selection tool using daterangepicker.js. This
allows
the
user to
specify a time range in which they would like to view their
transactions.
11 / 11
11. Pagination and
search
for
tables
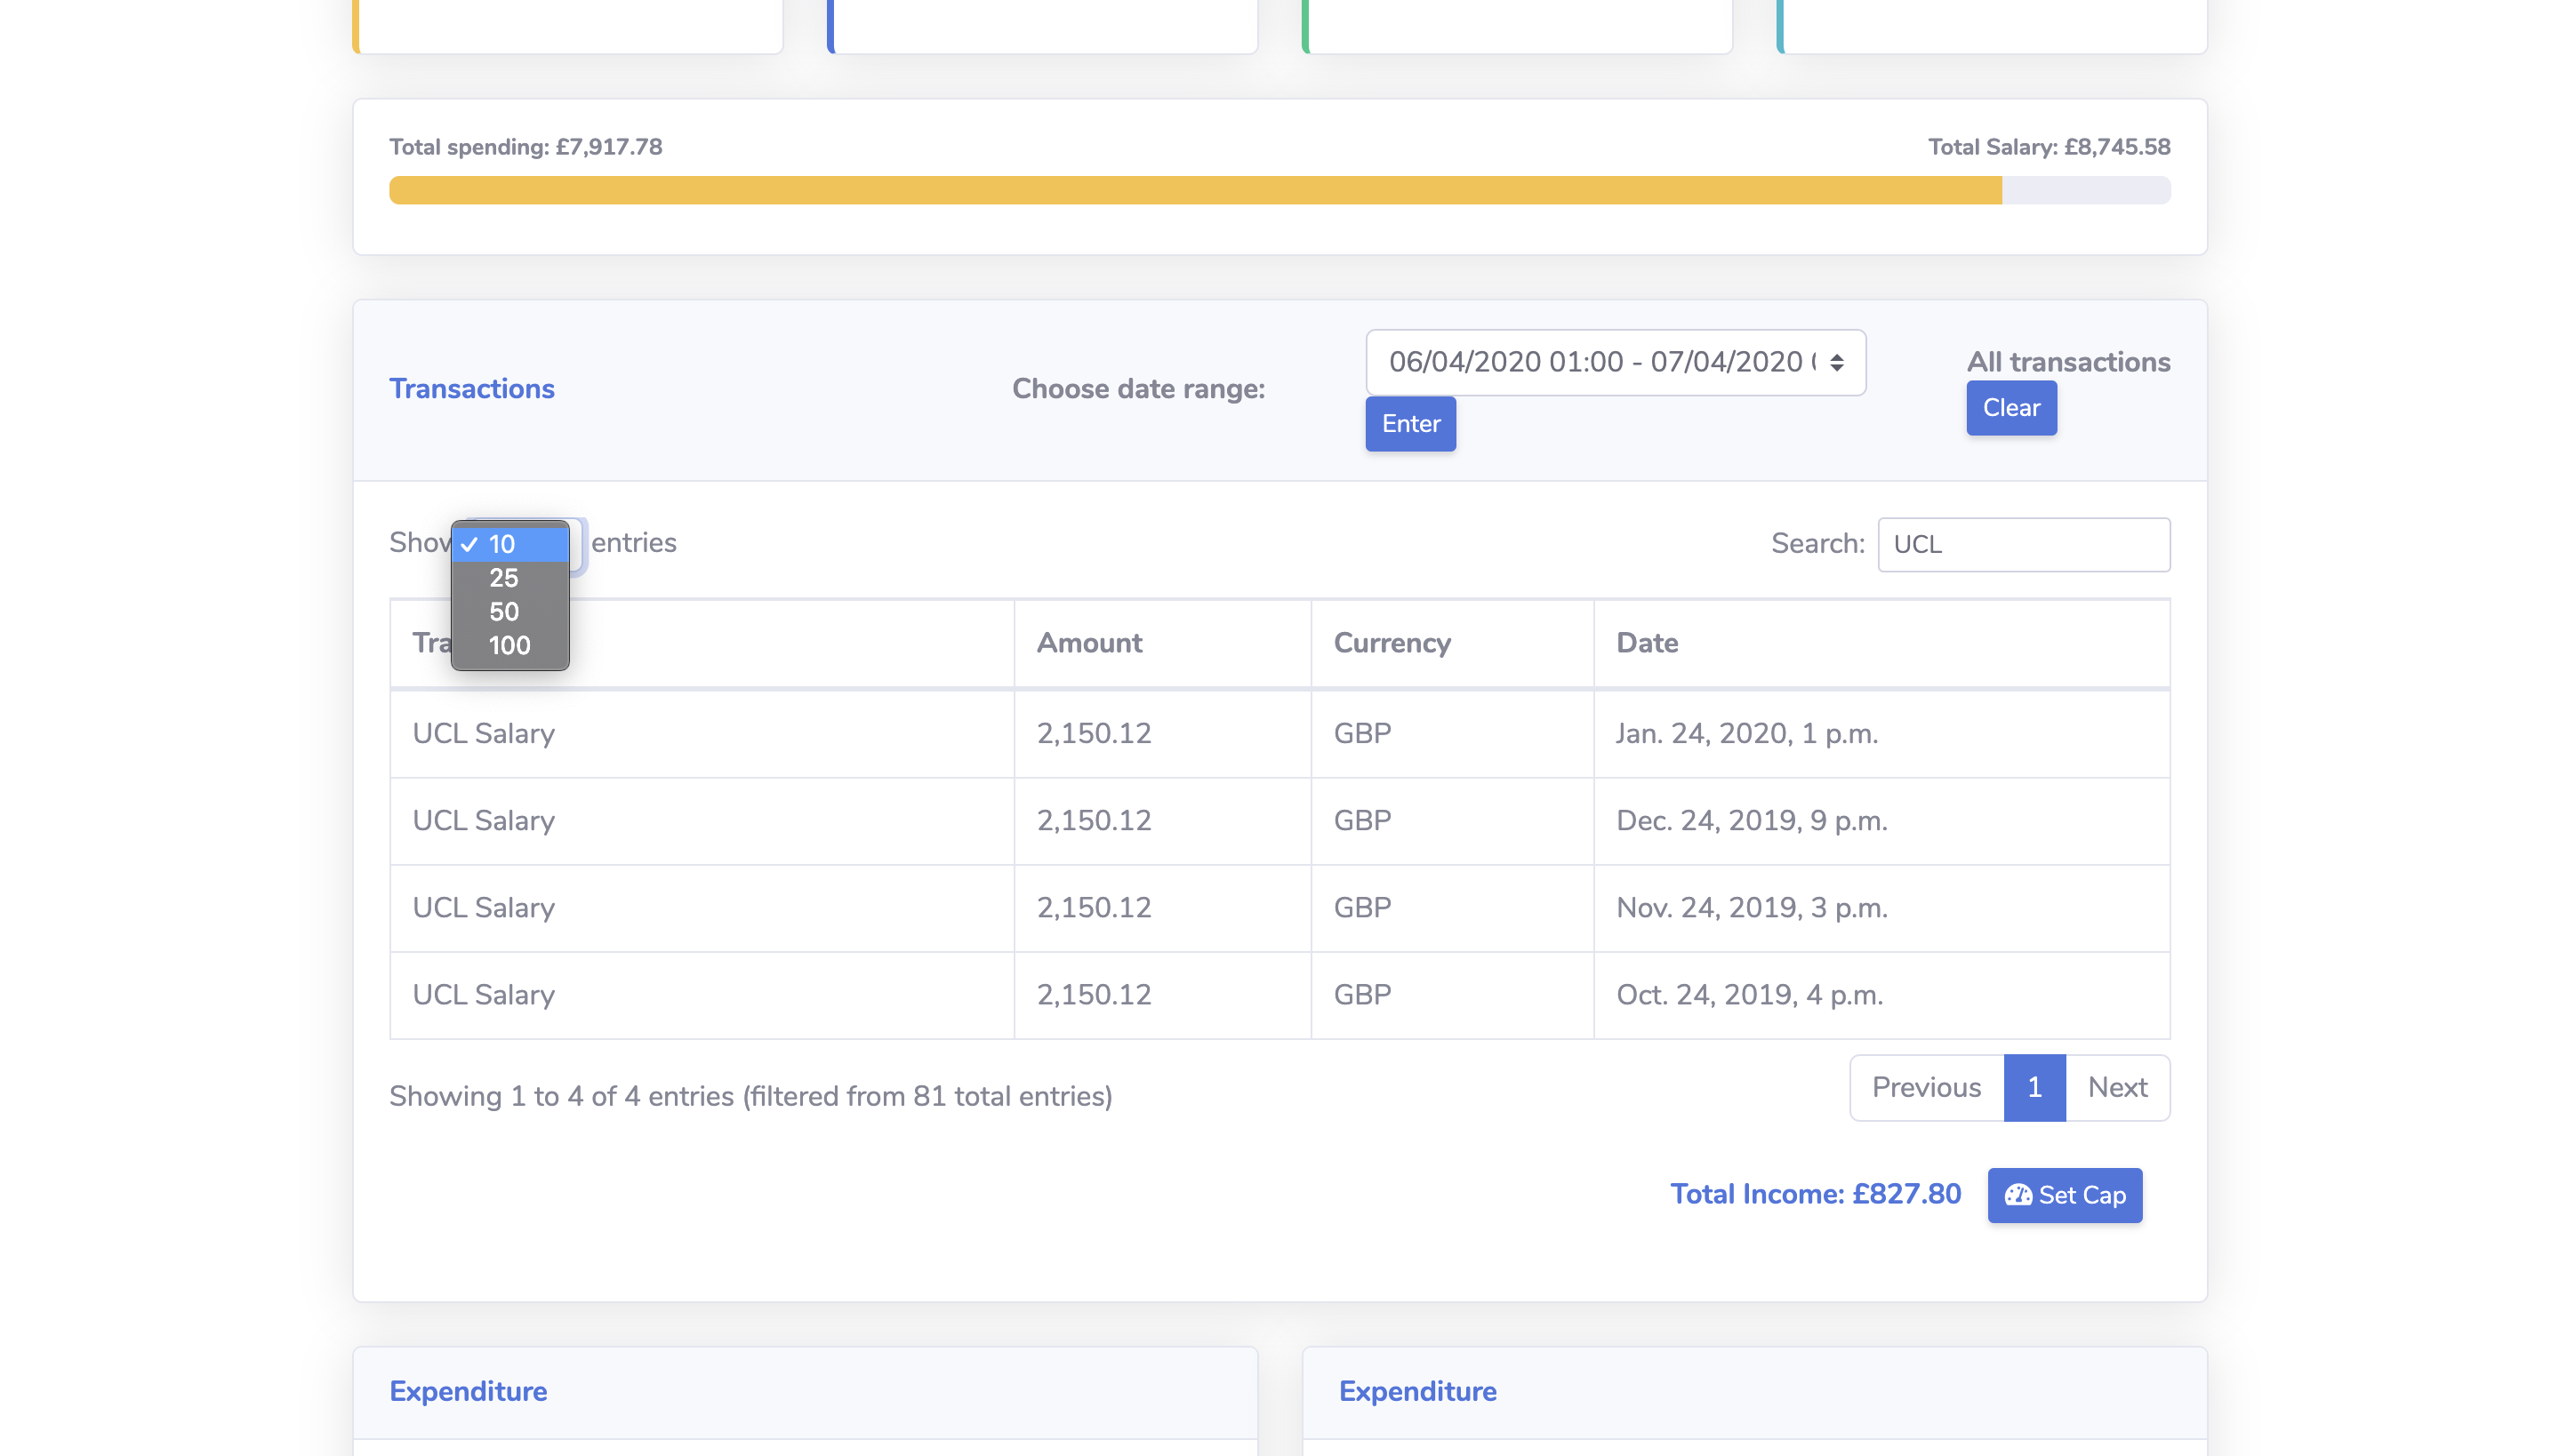
Using DataTable.js, we implemented pagination and search for the tables.
Due to
our
large
set of data, it would make our web app page very long and ugly,
therefore,
implementing
pagination allows the user to go through multiple pages of the table,
reducing
the
clutter
on the web page. It also allows the user to specify the number of
transactions
per
table
page. Using the search function also narrows down the financial
transactions,
this
in turn
allows the user to view transactional data for a particular shop per se.
❮
❯
