IMPLEMENTATION

AUTHENTICATION


Login Process
All authentication methods (login and registration) are handled securely by Keycloak. Currently, our Keycloak database runs within a dockerised container on our linode server. Using a custom realm file, we were able to instantiate roles for each specific type of user on our system. When a user tries to securely login into our system with the keycloak portal, the authentication process is offloaded to Keycloak to check that the username and password is held within the keycloak database. However, by using Prisma as an ORM we can synchronize the data from the “Users” table from the keycloak database to our PostgreSQL database, which is hosted within a separate dockerised container.

Registration
From our Use-case diagram we wanted platform administrators to be able to add new hospital/health board users through our web-interface(front-end) rather than Keycloak. Therefore, the most common method of registering users was to allow them to join by URL. Once a user has been added, the keycloak server is automatically updated, with the user's credentials.

Statistics Page


Line Chart
For a given dashboard most users can navigate to the statistics page where they can view a graph of their overall progress. The score for each standard is stored from a number between 0 to 4. Therefore, the best way to represent this data is to convert each score to a percentage. As a result, we get a line chart with the Score (as a percentage) on the Y-axis and the Time (in Days) on the X-axis.

main line chart

The system makes use of the Line component from the react-chartjs-2 library which is a react wrapper for the Chart.js library. Since Chart.js is a client-side JavaScript library we are required to have a specific format to render the graph. Therefore, we created another react component called LineChart to format the data from our API call to our PostgreSQL to correctly feed it into the Chart.js Line component. Before formatting our data, we use a GET request to /api/responses to retrieve all relevant data for a user. Also, following the Chart.js documentation, we can can utilise the legend selection to filter the line chart when the graph may be too complicated to analyse invidual health and care standards.

Quick Summary

quick summary

Quick Summary section of the statistics page shows a mean of all self-assessments taken for the given dashboard. The section comprises of a Circle Accordion which makes use of the built-in Circle component from react-suite. The process of calculating the average statistic for each health and safety standard is handled on the backend.

Personal Analytics

personal_analytics

Like the quick summary section, personal analytics displays messages depending on the average of all self-assessments taken for the given dashboard. To do this we used the Message and Panel Component from react-suite to list each piece of information respectively. The following cases show which message is displayed depending on the average performance:

Message Average Performance, p
postive summary p ≥ 75%
neutral summary 25% < p < 75%
negative summary p ≤ 25%
Additionally, when a user has not been able to complete a self-report in a week, the following information is concatenated with the other previous messages:

main line chart

PAGE MANAGEMENT


Manage Questions and URLs
Head of departments have access to a page where they can manage questions within a dashboard and edit their URLs:

quick summary

quick summary

Both these pages use PUT requests to their respective API's (api/questions and api/questionURLs) and because they are both different tables this is done quite easily. The query system again shows its utility here as we can pass the dashboard_id in as a parameter to the API in order to recieve the currect set of questions linked to the dashboard. Furthermore the table component itself performs it's own API calls. Each row is linked to a key which is standard practice for Next.js. The key in our system is also the question id which we can use to make a PUT or DELETE request to the api/question[id] endpoint. This efficient system make the codebase much cleaner and understandable.

Viewing dashboards
This page is key in our implementation of the whole system. To access all the proper functionality of all of the main pages of the application, a user must first travel through this page. The page is simple and just involves a GET request to /api/dashboard to fetch all the dashboard from the user's department. Keycloak stores the user's deparment_id so fetching is made simple through a WHERE clause.

quick summary

While this page is simple, each dashboard button is linked to its respecitve dashboard id. Using URL query parameters (e.g *URL*?dashboard_id=*some number*) we are able to pass this ID around to all sub-pages. i.e the self reporting page and statistics page. This way we can pass this ID into the other API calls to fetch the correct questions for the correct dashboard


The view page also comes with the search filter. Of course as the website scales, the number of dashboard may increase to a level where many pages are required. Our team has implented this feautre to make user expiienve much easier, espically for admins as they are able to see all the dashboards for all the departments and hospitals. The search components makes use of the event loop applying a filter to the API response whenever the input field is edited; adding or removing buttons visible to the user.

Admin Pages


Admin Manage Page
Eventhough User Management comes in built within the Keycloak admin console we have expanded on the an admin page where they are able to create health boards, hospitals and other admins

manage Admin


As standard practice this table is a component with each cell having it's own API calls to create new records within the system. This page uses API endpoints for creating users (POST /api/users), and fetching data such as hospitals or health boards (GET /api/hospitals, GET /api/health_boards) through the API for administrators.

SELF-REPORTING


Questions
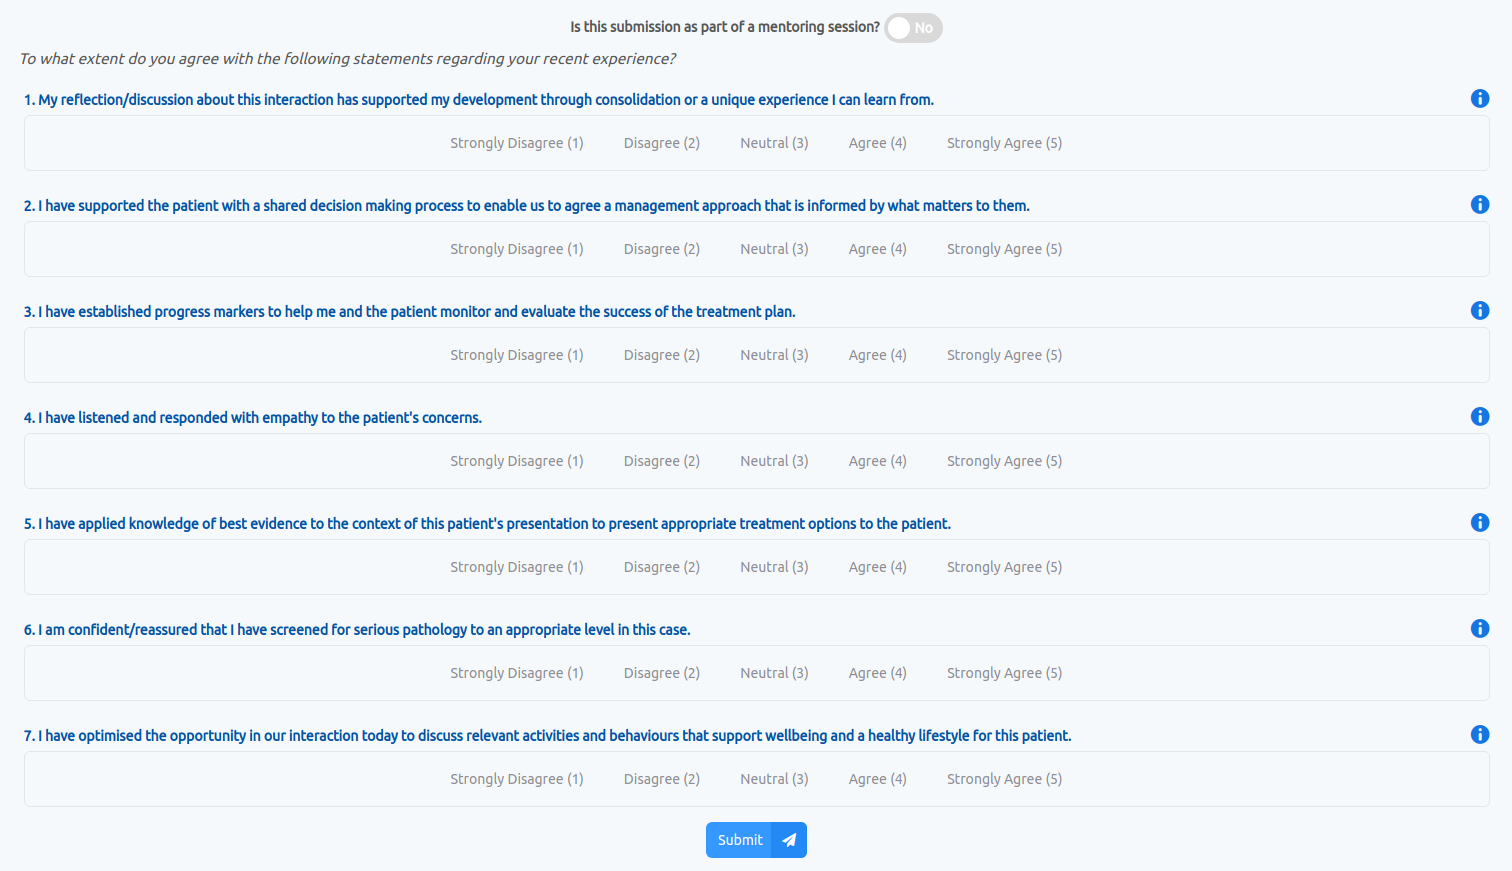
This is the main function of the web-application. The self-report page asks users if they are engaging in a mentoring session. It provides a series of Likert Scale questions relating to the set standards, each with corresponding training URLs:

self report


It uses a component-based design, with LikertScale, and LikertScaleQuestion, and Info components (information buttons). As stated before, the correct questions need to be fetched from the correct dashboard. This is done as explained previosly by using URL query params in the GET request to the /api/questions API endpoint. Furthermore correct validation is provided using REACT states where an AlertDialog component is created as the validation logic is required. The page also uses a POST request to /api/responses to save the responses to the database.

ERROR HANDLING


Error Pages
Our system needed to be versatile. This means handling every bad request, incorrect query, unknows URL in a suitable manner the user is able to understand.

error page


Fortunately NEXT.js comes built in with a system to create custom error pages. Every status code excluding error 404 can be handled creating the file /pages/_error.js. This page replaces the default NEXT.js error page with our own custom one that we can use to mantain the same UI theme. This functions takes the error status code as a prop and uses it to display the correct error. However Error 404 is not handled in this file and the same process is applied by creating another file /pages/custom404.js
System Errors
As states before if the some unknown error appears in the backend or the user has filled in incorrect information this is handled using REACT states. An AlertDialog component is created to be able to be used in the whole system. Taking in error codes as props and using the message key aquired from API responces, we are able to display the correct message to the user depeneding on the error.