User Interaction 1 - User Interface Add-Ons
Interacting with the graph prototype
For the first part of out prototype, our team decided to begin by sketching some of ways in which the user can interact with the graphing tools. Thus, in the sketches below, one can see the steps the user should take in order to see the data gathered in the past week and how the graph should look like:
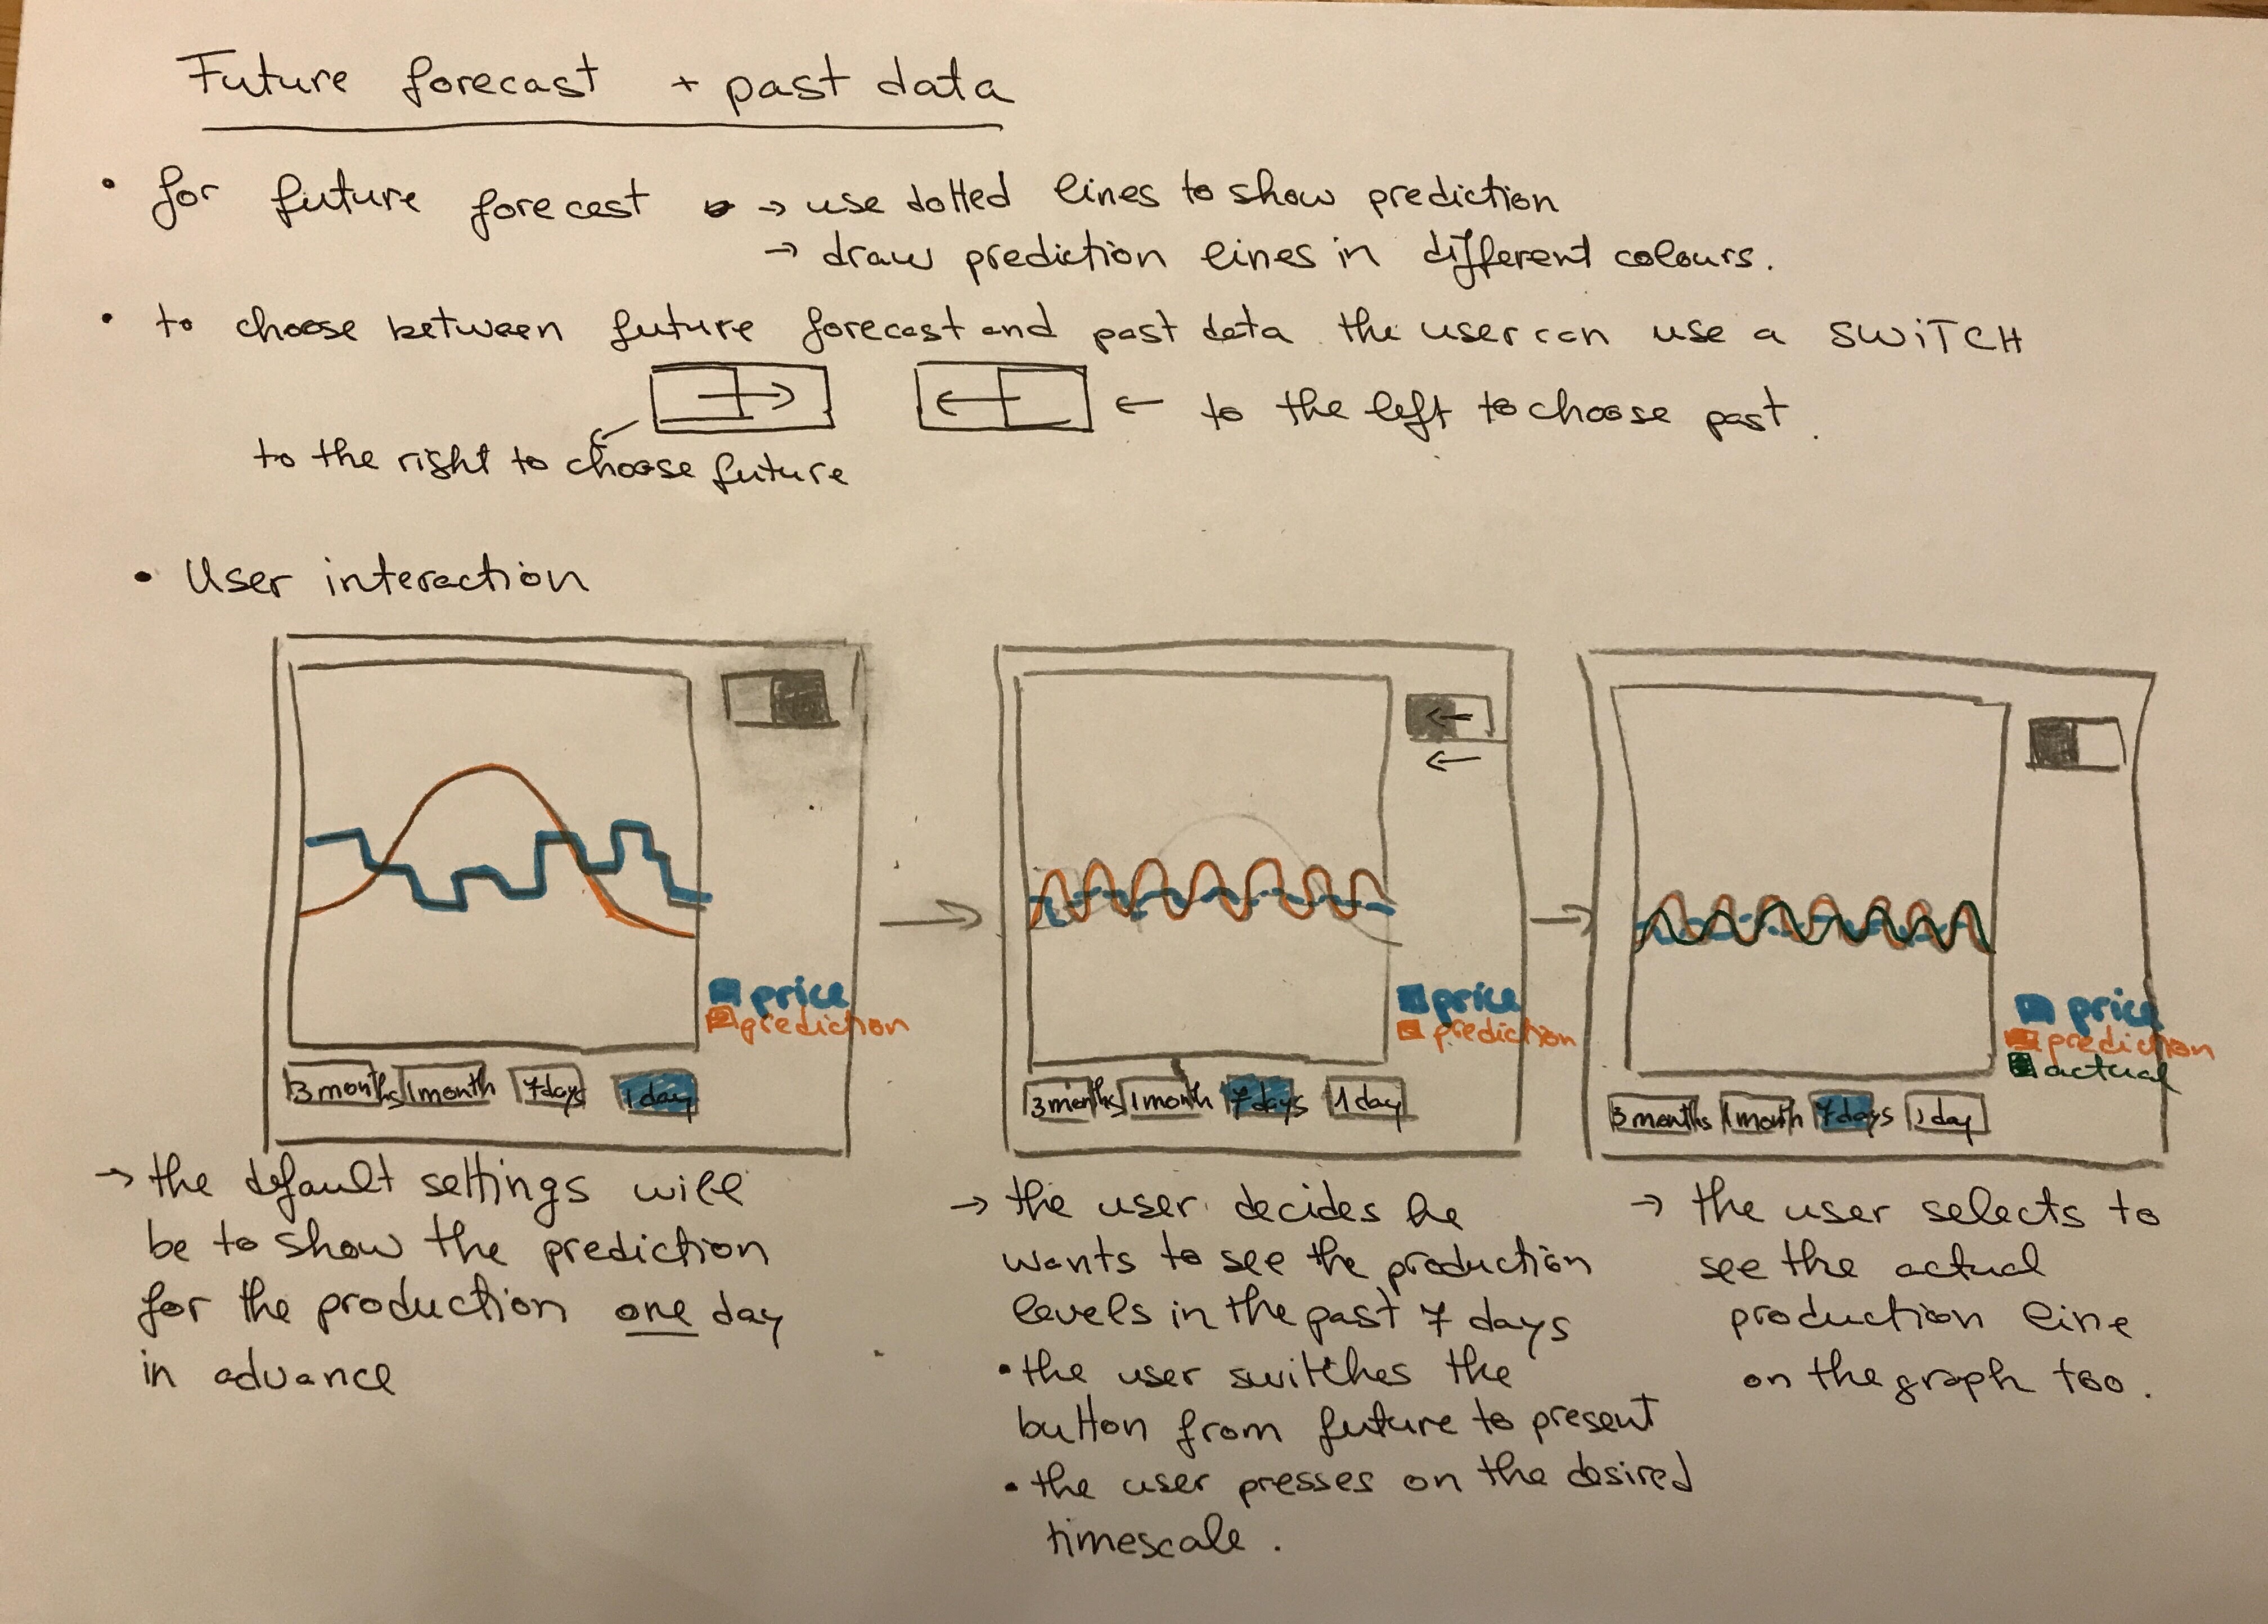
Chart.js
After changing the design of our initial sketches, we decided to add a "Remove" button for the Actual Production line instead of using a check-box. This could later be changed, as too many buttons could make the UI harder to navigate.
We used the library Chart.js to implement the interactive Prototype of the graph. The user can now click the "Add Actual Production" or the "Remove Actual Production" buttons to show or hide the Actual Production line and the "1 hour" button to show the Revenue and Price Prediction for the next hour. For now, just this button is implemented and can be clicked multiple times to show a further prediction. Nevertheless, the current prediction lines are plotted using randomized data, which is due to be replaced with a proper dataset at a later stage of the project. One of the main aims is to also improve the accuracy of the prediction lines using machine learning algorithms.