|
- 2 pages [1]
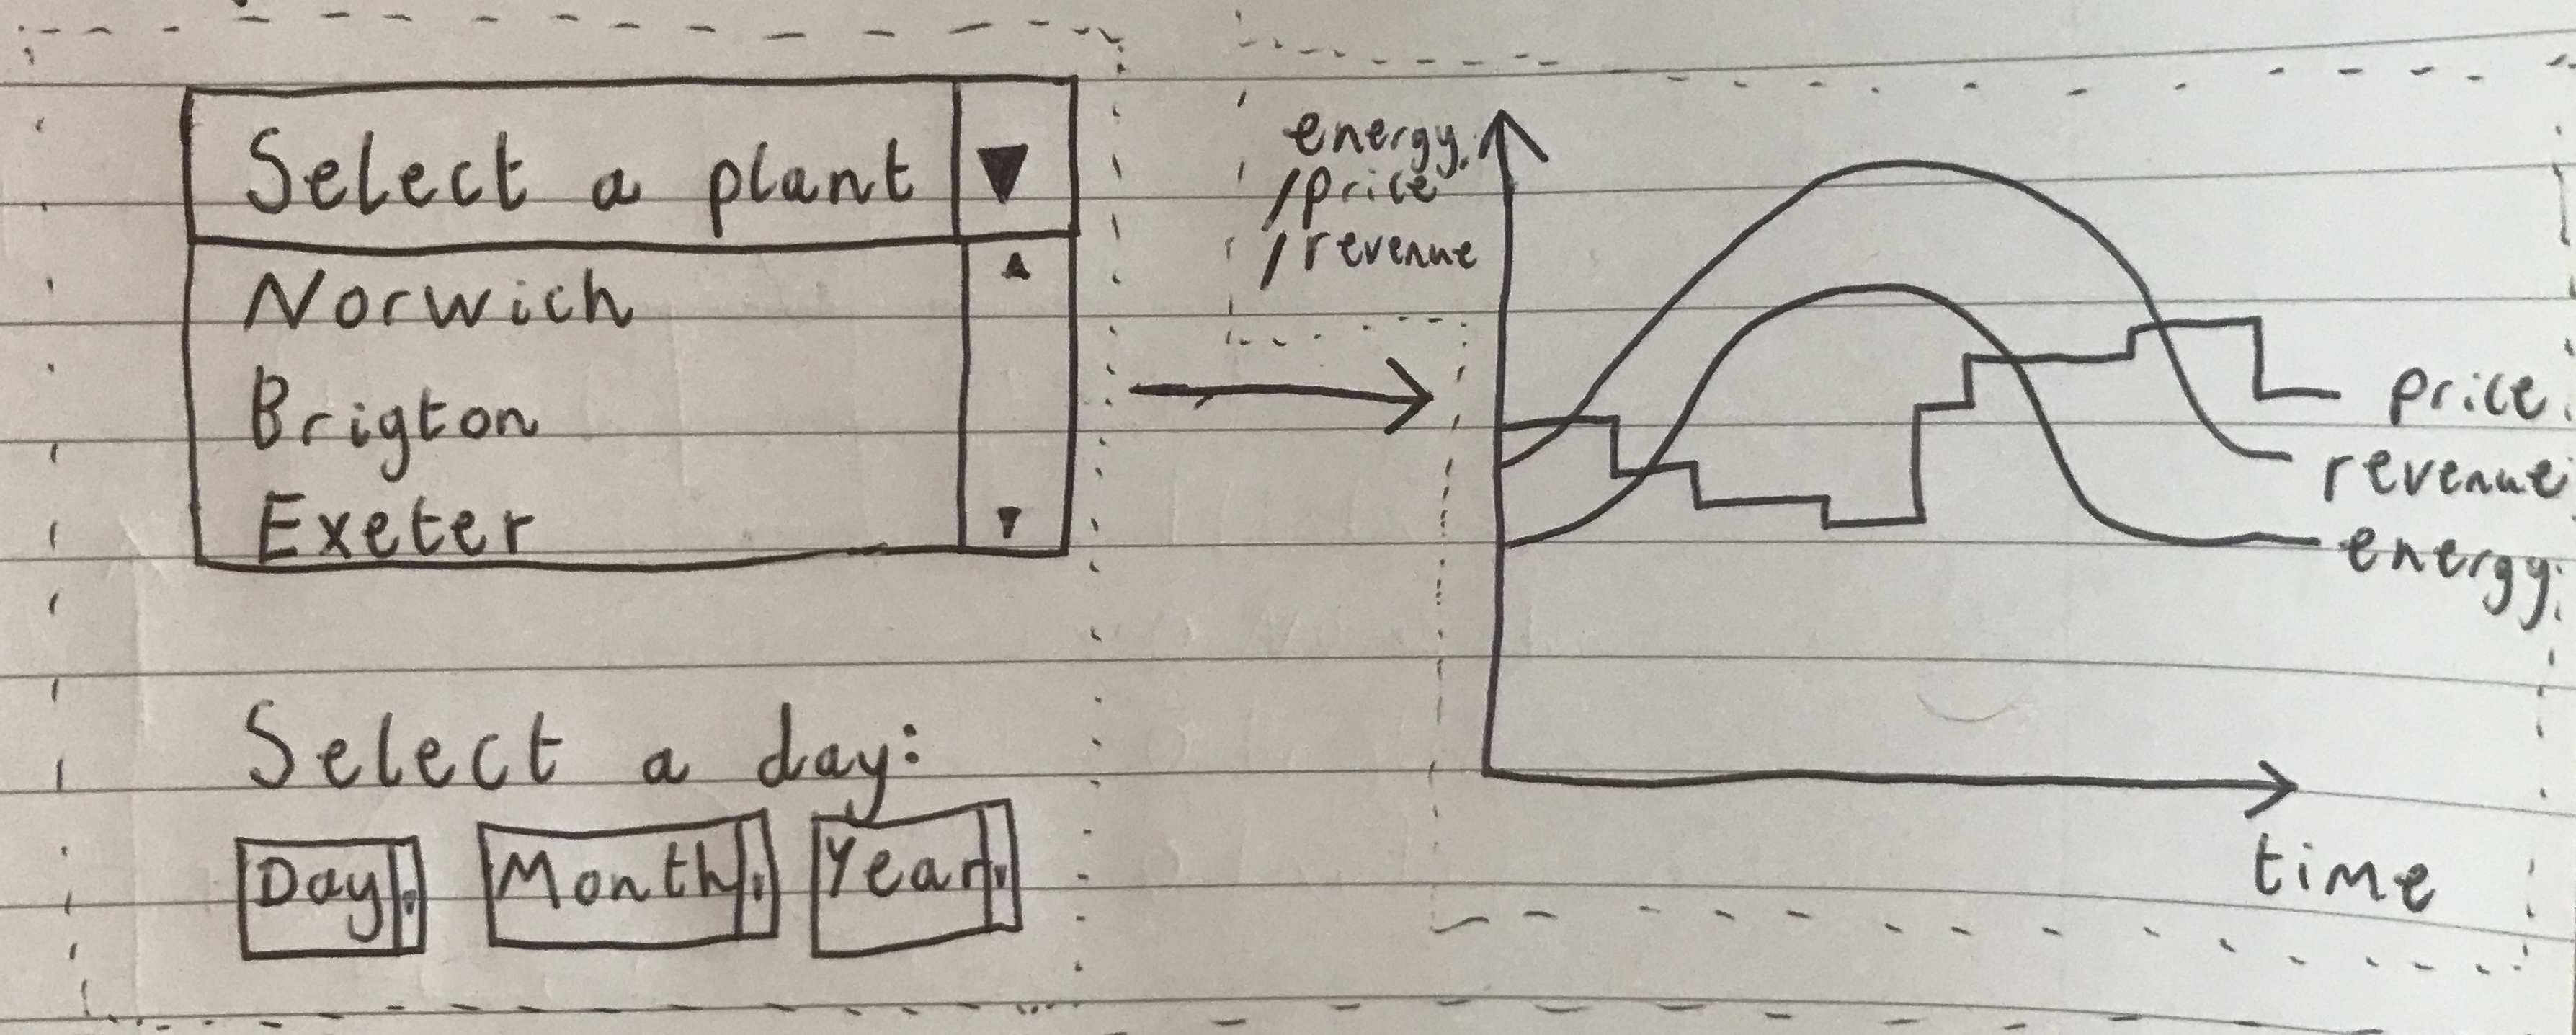
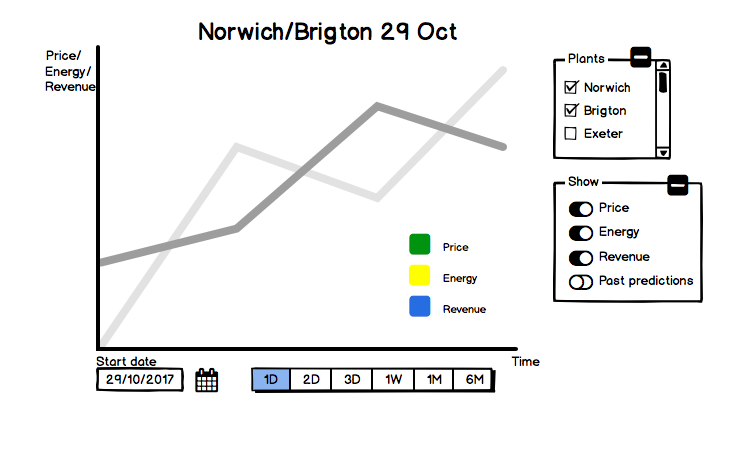
- Non-interative graph
- Each plant has own graph
|
|
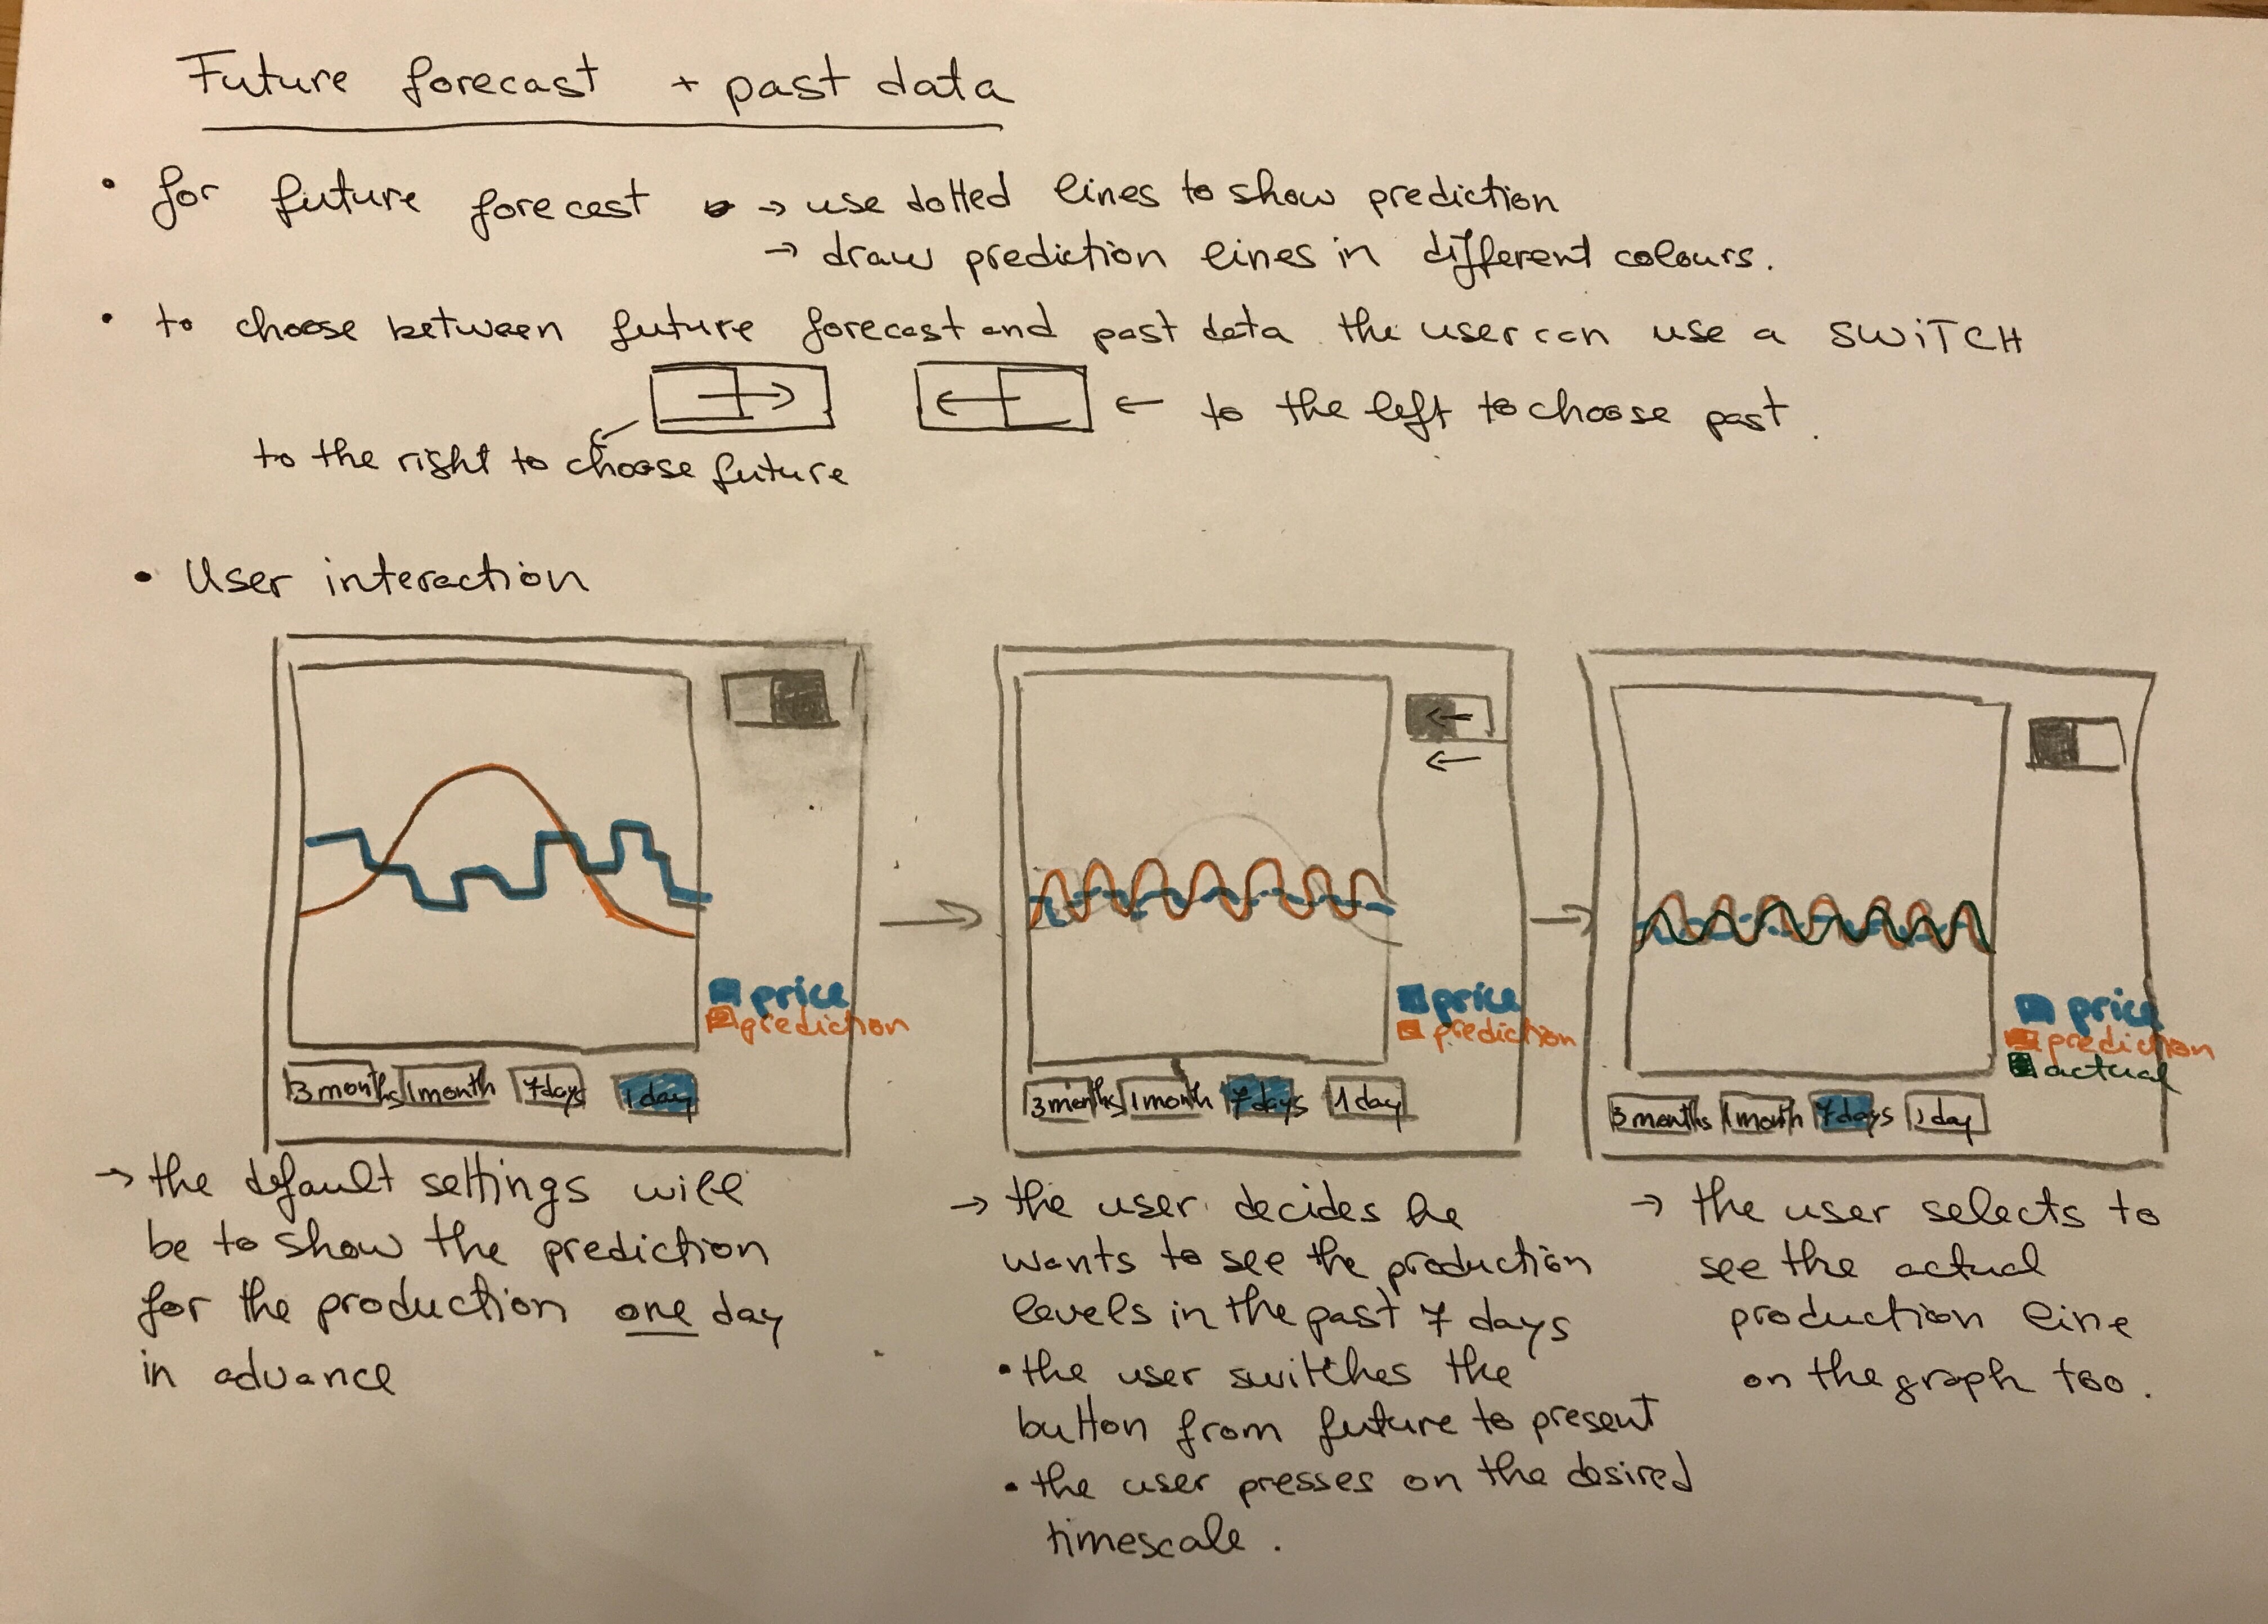
- Prediction button to switch between past actual data and future predictions
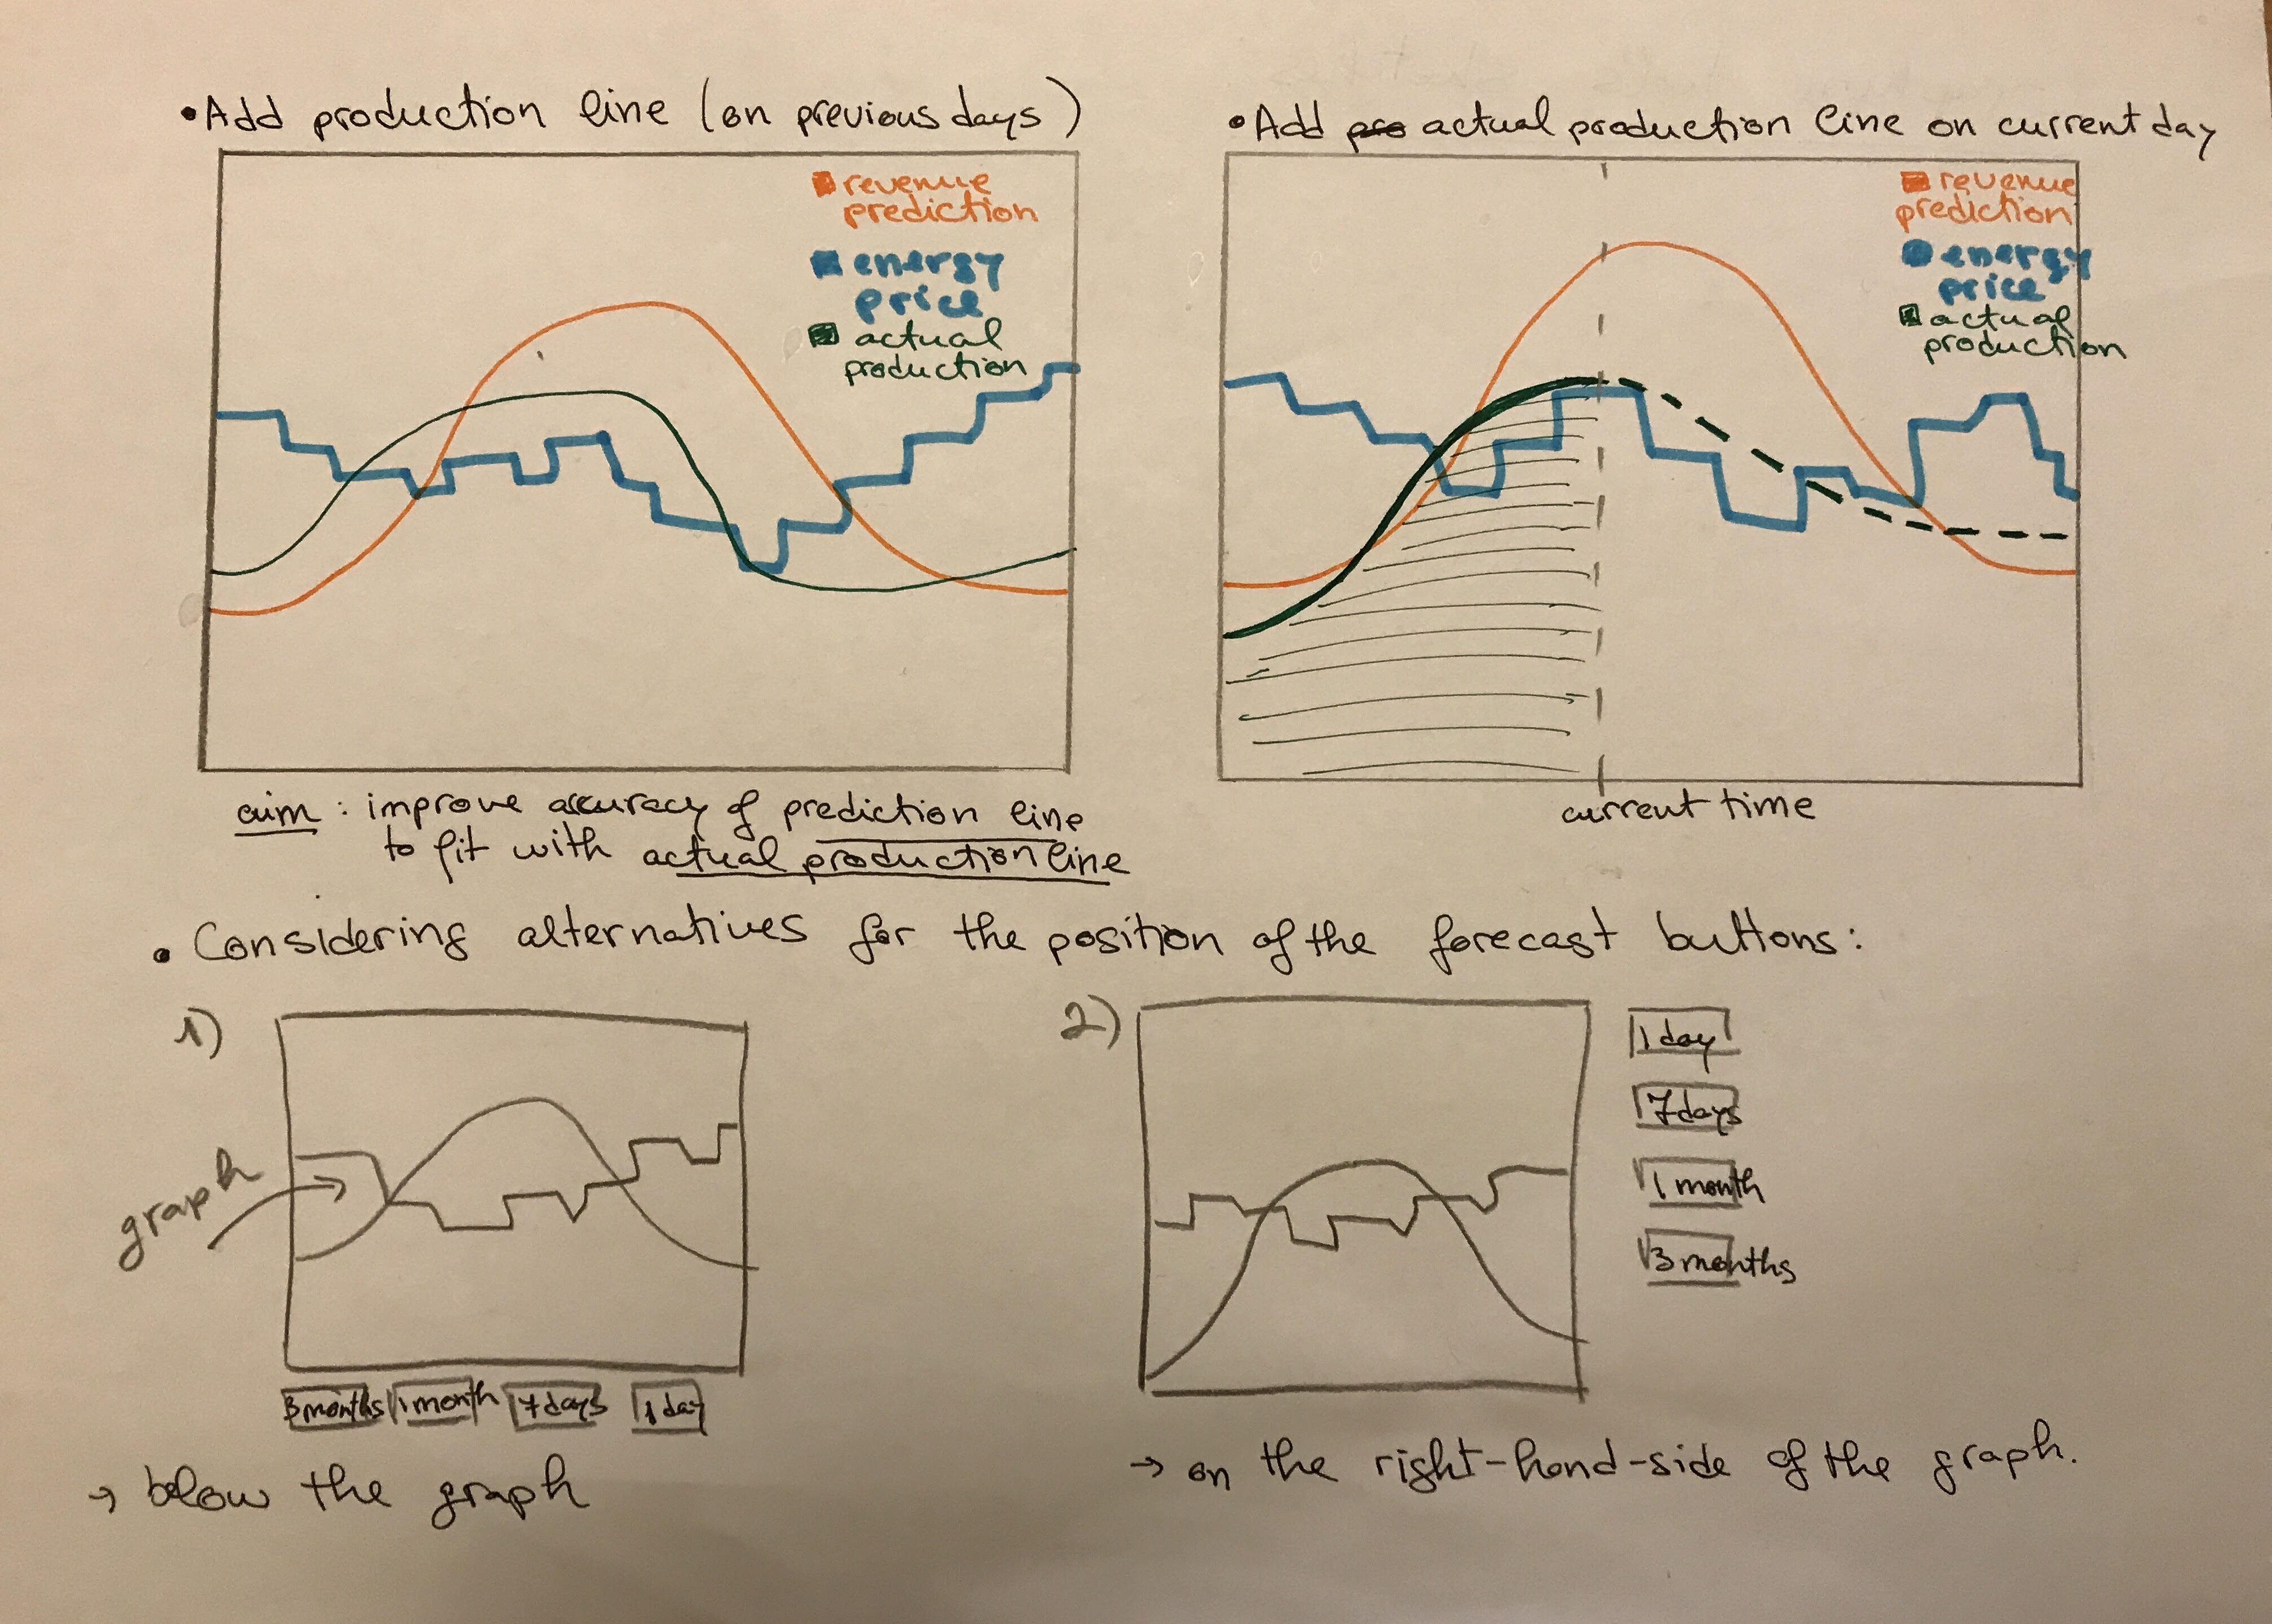
- Buttons to alter timeframe
|
|
- Prediction line toggle to show and hide the prediction data for previous days
|
|
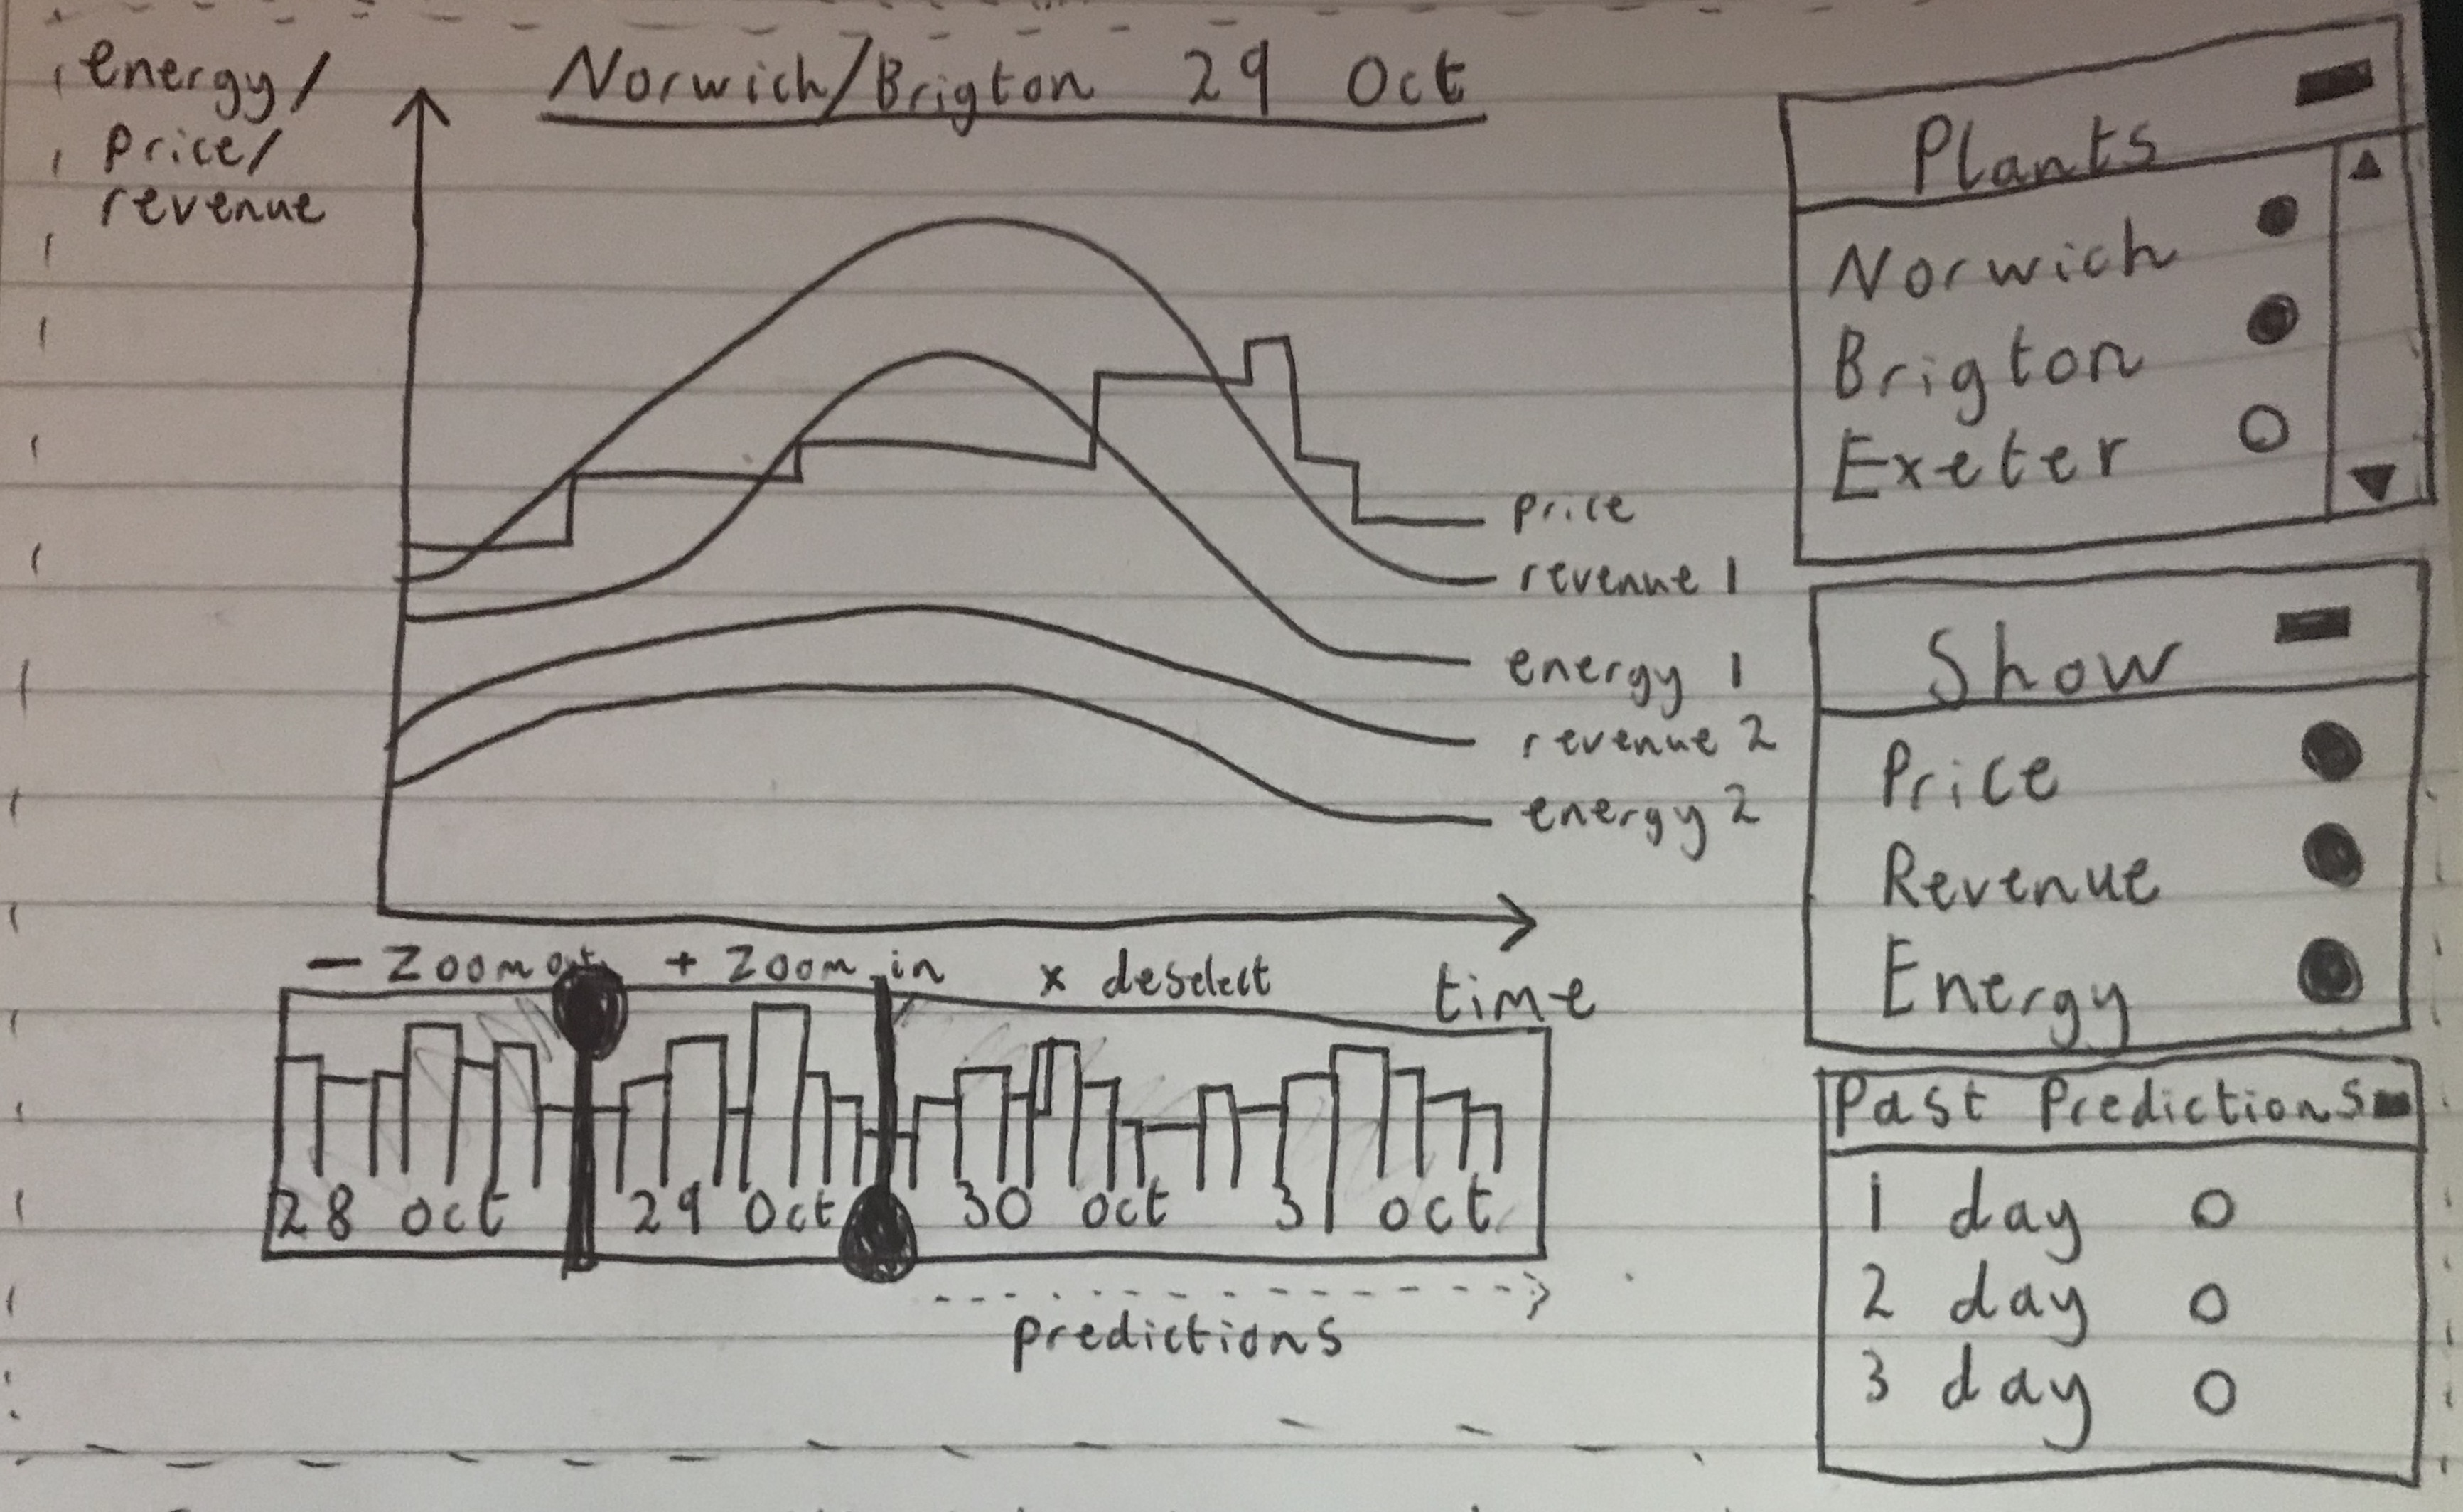
- Simiplifies timeframe with timeline selection
- Ability to add multiple plants making comparisons easier
- Flexibility on showing past predictions
- Graph lines togglable and option boxes collapsable to
prevent cluttering [6]
|
|
- Merged toggles in 1 field box
- Replaced timeline with more intuitive buttons (as requested by user feedback - see evauluation)
|
|
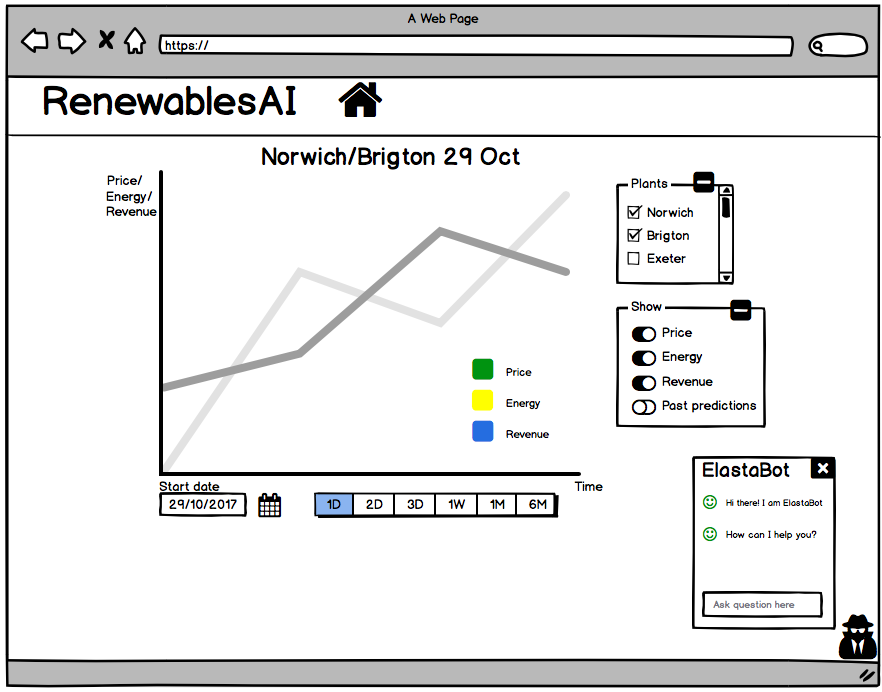
- Wireframe with graph and bot to show the overall layout of the web application [3]
|