Backend Implementation
Our Implementation documentation can also be read at: Implementation documentation.
System Monitoring Implementation
Overview
EcoMeter includes a key feature of system monitoring, which involves a comprehensive process of information collection, data extraction, and live data calculation. The system monitoring feature is implemented by extracting relevant information from system files, parsing and processing the raw data, and then dynamically displaying the results to users in an easy-to-understand format.
Collecting System Information
-
System and Process Information
- Kernel Information -
/proc/version - Total processes / Running processes -
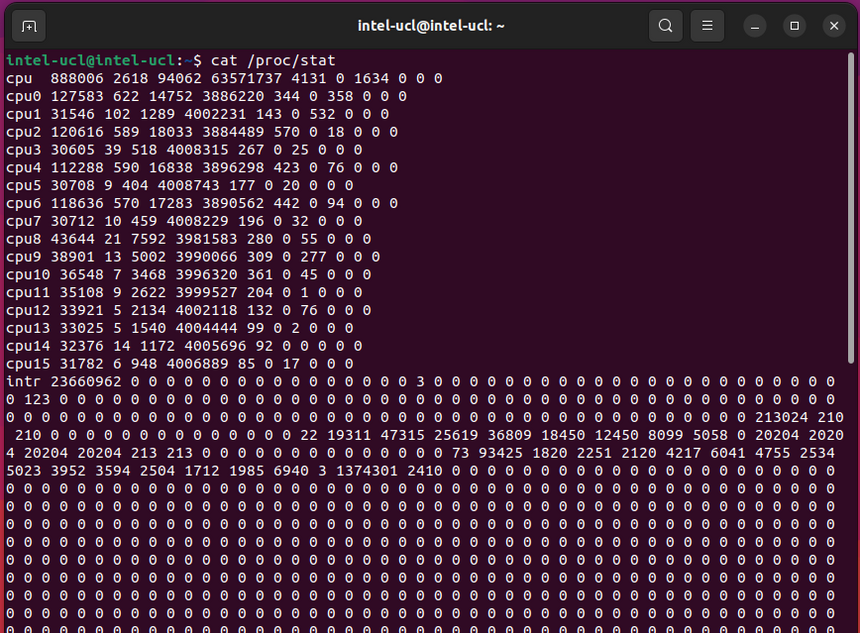
/proc/stat - Up time -
/proc/uptime - Memory utilisation -
/proc/meminfo - CPU utilisation -
/proc/stat - Process ID -
/proc/[pid]where pid is in any directory having an integer for its name - CPU utilisation -
/proc/[pid]/stat - Command -
/proc/[pid]/cmdline - Operating System - The operating system name is contained in /etc/os-release , which is a text file that contains information about the operating system distribution that is installed on a Linux system [4].
- CPU Temperature - The CPU temperature data is collected from
/sys/class/thermal/thermal_zone0/temp, which is a system file that provides the current temperature reading of a thermal sensor on a Linux system [5].
System and process information is mainly derived from /proc virtual filesystem, which provides a mechanism for the Linux kernel to expose information about the system and its processes to user-space applications [1]. Each file or directory within /proc represents a different aspect of the system or a running process, and can be leveraged to obtain information of the system required.
System information that obtained from /proc include:
Information of process with [pid] that obtained from /procinclude:
Energy and Power Usage Information
Energy usage data is extracted by utilising the Intel “Running Average Power Limit” (RAPL) technology, which is a feature available in modern Intel processors that allows the processor's power consumption to be monitored and controlled [3]. The /sys/devices/virtual/powercap/intel-rapl/intel-rapl:0/energy_uj file is part of the RAPL framework and reports the total energy consumption of the processor.
Other System Information
Data Parsing and Extraction
After learning about the above filesystems, we then use a set of utilities to extract and parse the raw information that we have collected.
- PROC(5) - linux manual page. [Online]. Available: https://man7.org/linux/man-pages/man5/proc.5.html. [Accessed: 17-Mar-2023].
- Itornaza, “CPP-system-monitor/readme.md at master · itornaza/CPP-system-monitor,” GitHub. [Online]. Available: https://github.com/itornaza/cpp-system-monitor/blob/master/README.md. [Accessed: 17-Mar-2023].
- “The linux kernel,” Power Capping Framework - The Linux Kernel documentation. [Online]. Available: https://www.kernel.org/doc/html/next/power/powercap/powercap.html. [Accessed: 21-Mar-2023].
- “os-release(5) — Linux manual page,” OS-release(5) - linux manual page. [Online]. Available: https://man7.org/linux/man-pages/man5/os-release.5.html. [Accessed: 21-Mar-2023].
- The Linux Kernel Archives. [Online]. Available: https://www.kernel.org/doc/Documentation/ABI/testing/sysfs-class-thermal. [Accessed: 21-Mar-2023].
The primary responsibility of the util class SystemParser is to parse the relevant information from the /proc filesystem. As mentioned earlier, the /proc filesystem contains a wealth of information about the running processes and the system itself, for example
To extract only the necessary data from the lines of information, we utilise the SystemParser class, which allows us to filter the essential system data and present it to the users in a more meaningful format.
The class Command has a static method exec(), which is utilised to execute system commands and obtain their stdout results. The Command class works in conjunction with SystemParser to gather essential data from the system, particularly data that does not require parsing.
Live Data Calculation
-
CPU Utilisation
With help of SystemParser, we can easily get the total amount of time that the CPU has spent in all states total_jiffies as well as the amount of time that the CPU has been active active_jiffies. From this information, we can, with a little effort, determine the current level of CPU utilisation, as a percent of time spent in any states other than idle by the following formula:
live_utilisation = total_jiffies_difference / active_jiffies_difference
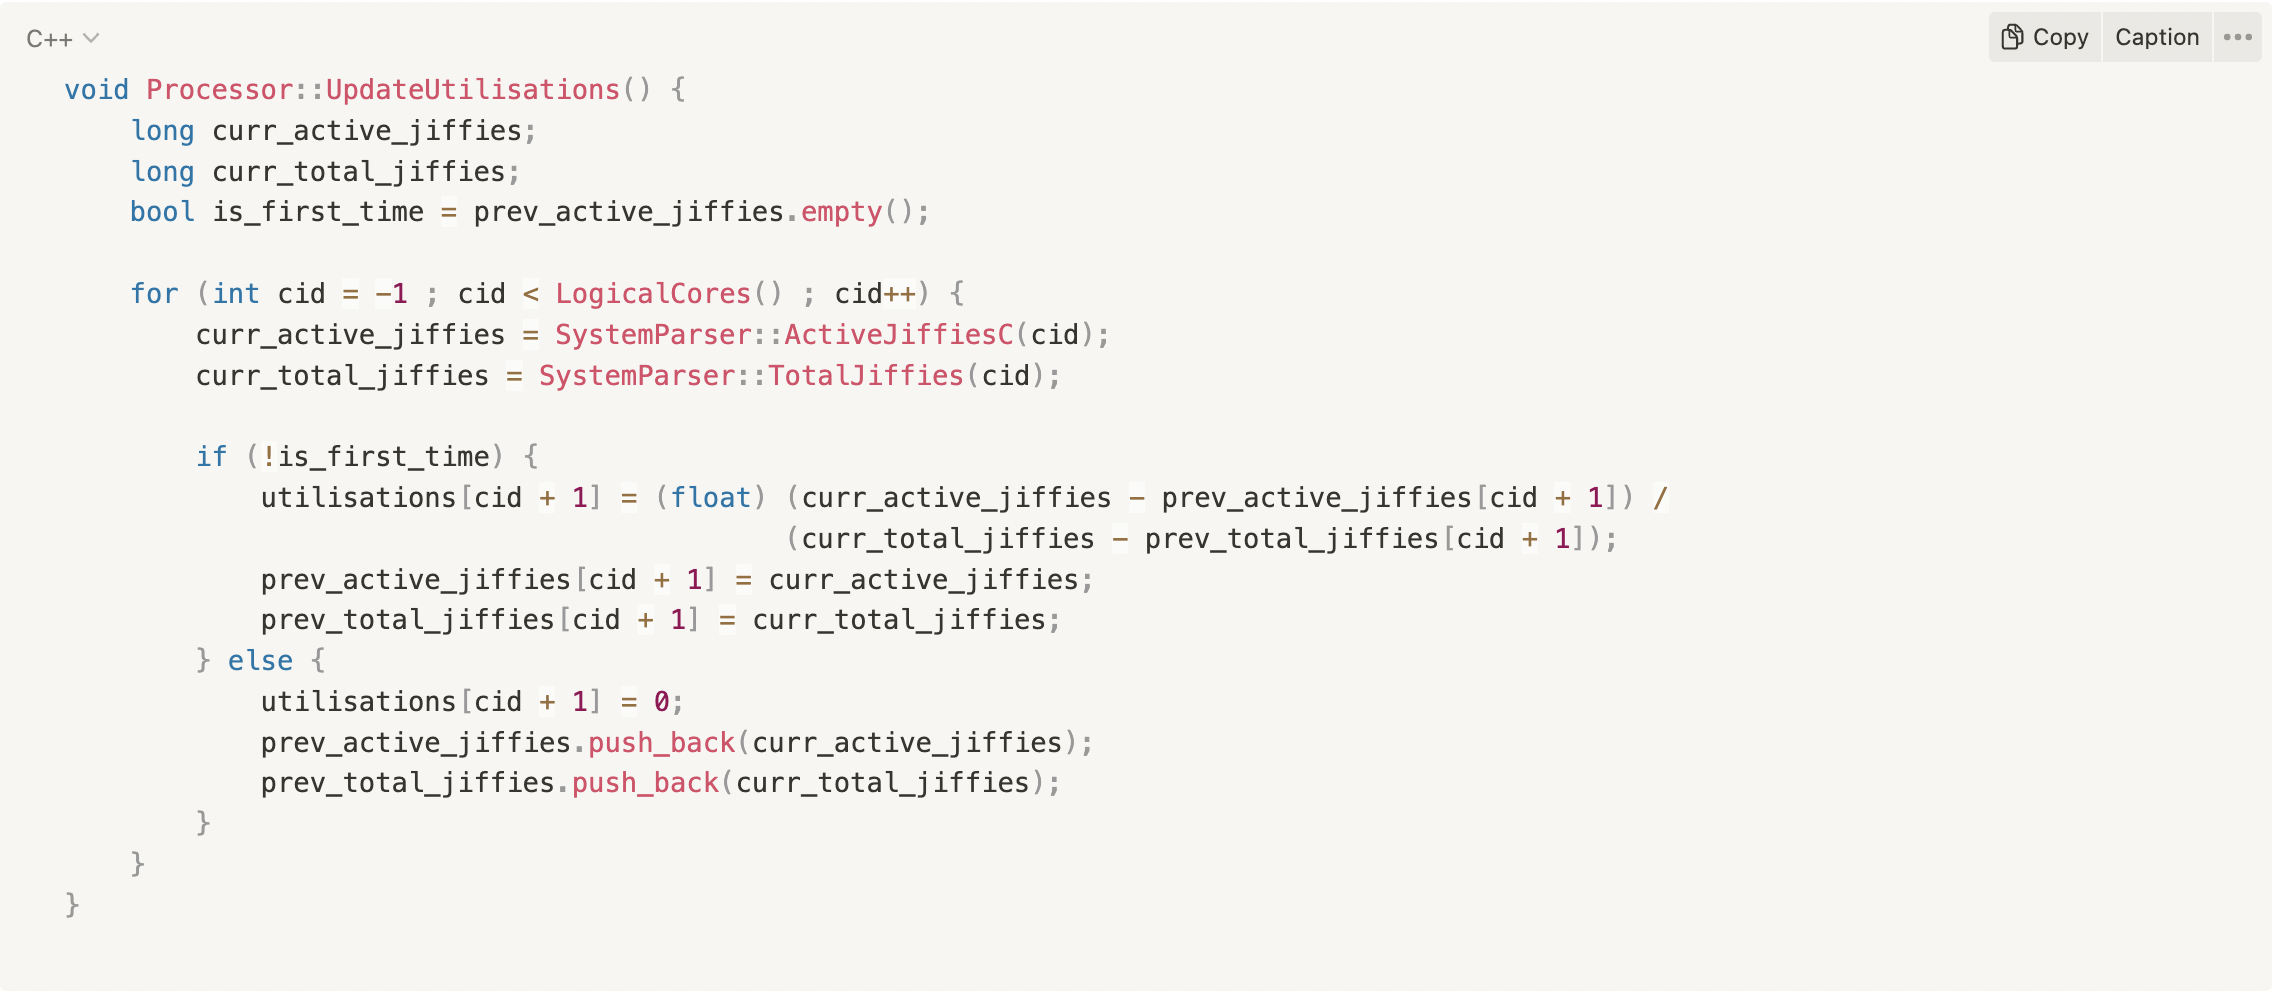
This works for updating real-time utilisation of every CPU core over a short period (one second in our case). To implement this, we continuously read the total_jiffies and active_jiffies of each core and calculate the utilisation over one second using the the following variant formula:
live_utilisation = (curr_active_jiffies - prev_active_jiffies) / (curr_total_jiffies - prev_total_jiffies)
Process CPU Utilisation
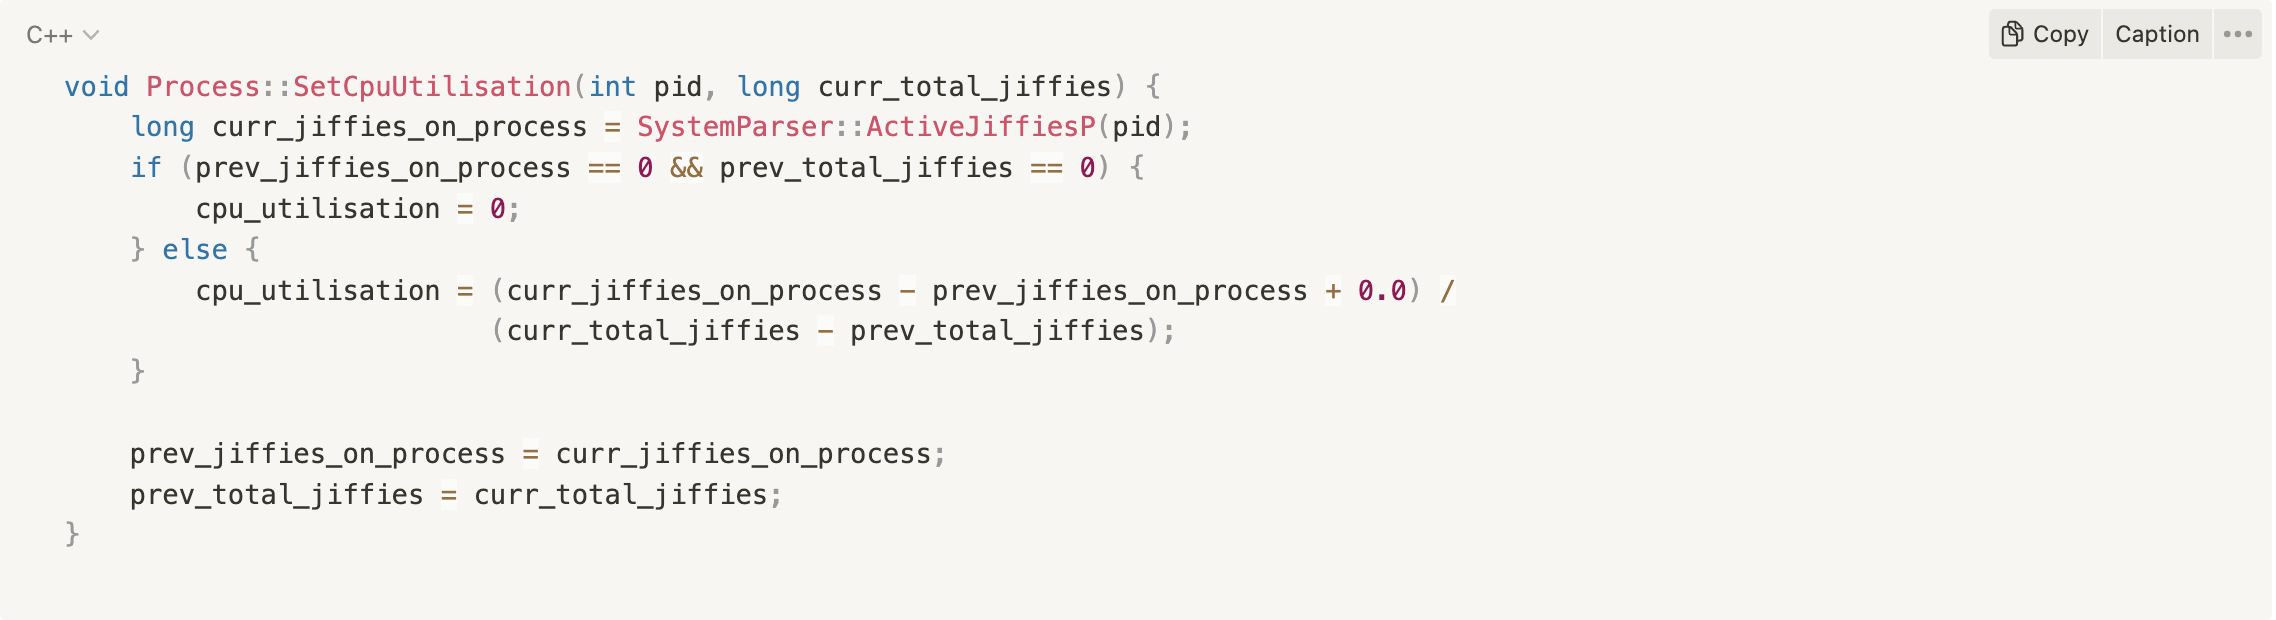
Similar to the method for calculating system CPU utilisation, we extract the amount of active times that CPU has spent on performing a process every one second, and calculate the real-time CPU utilisation of that process using the following formula:
cpu_utilisation = (curr_jiffies_on_process - prev_jiffies_on_process) / (curr_total_jiffies - prev_total_jiffies)
Energy and Power Usage
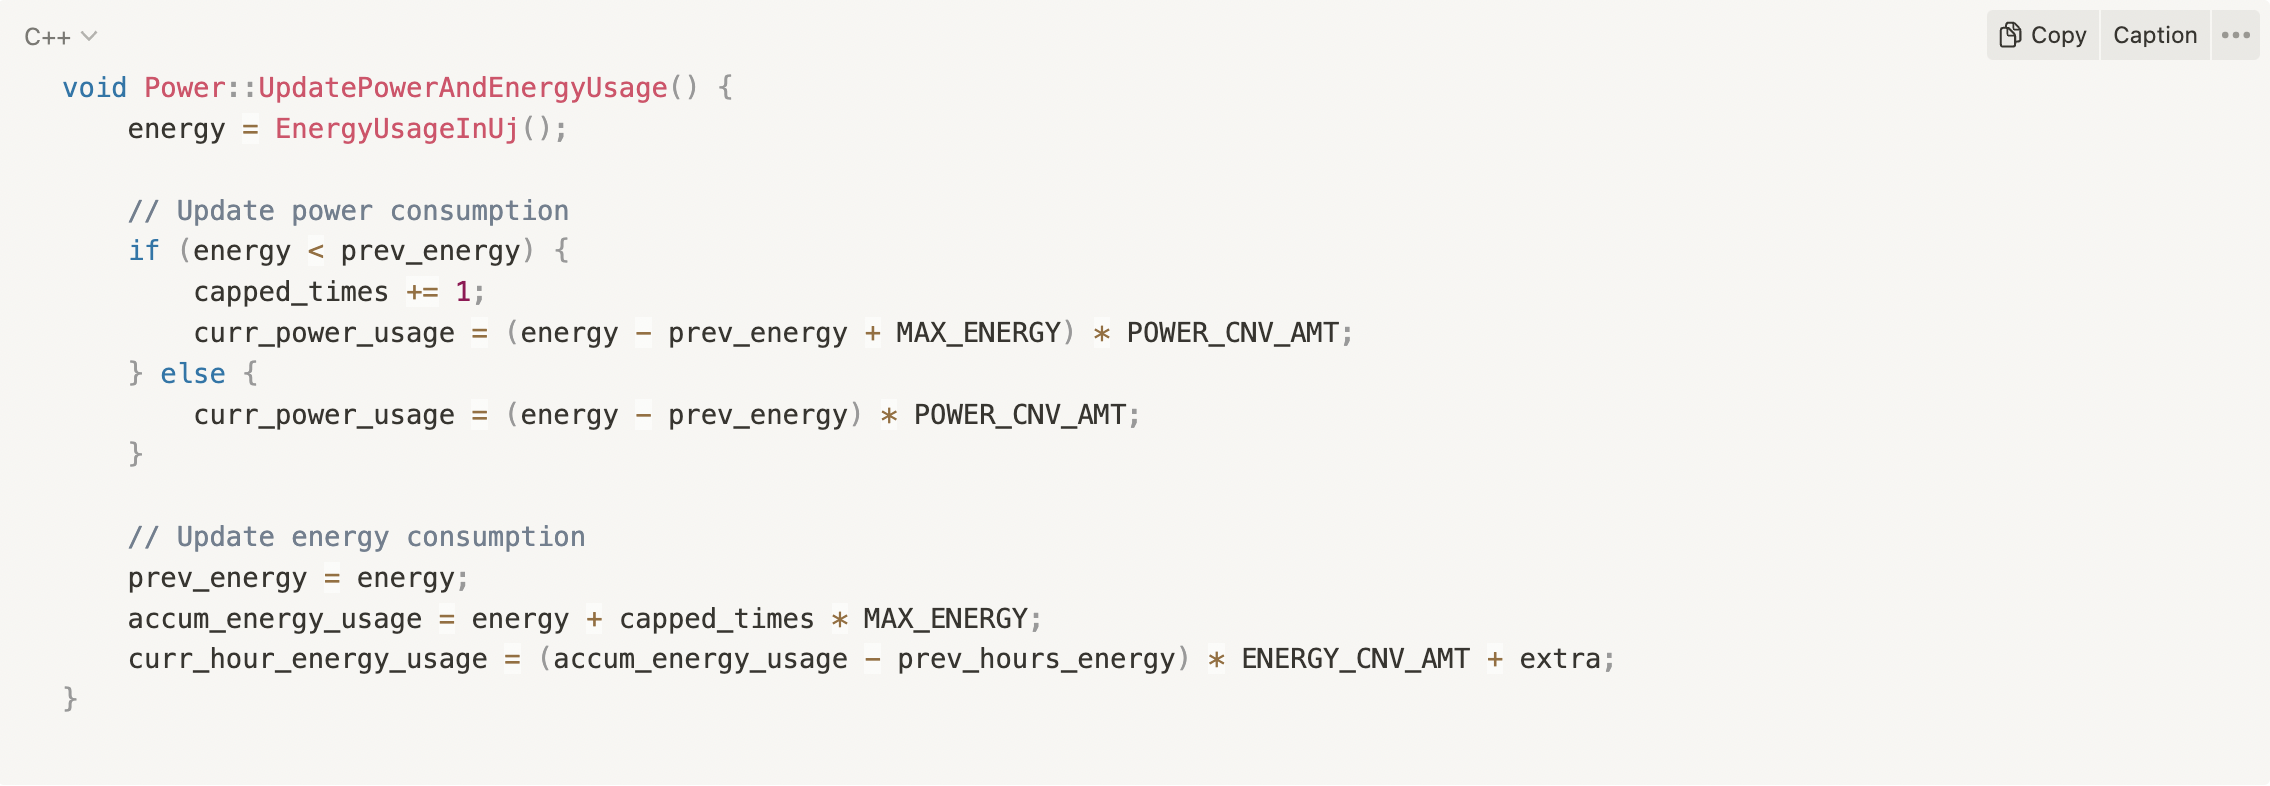
The data we collected from the RAPL framework is the total amount of energy consumption in microjoules (µJ) since the system is booted. By periodically sampling the energy consumption value and calculating the difference between consecutive readings, the power consumption of the processor over a given time interval (one second in our case) can be estimated using the formula:
power_usage = energy_usage_difference / time_difference (x conversion_amount)
To accurately determine the hourly energy consumption, our system takes into consideration various factors such as the possibility of system shutdowns and reboots, as well as the range of the energy counter. We achieve this by continuously updating the energy consumption data over a short period and monitoring any changes in the counter. Additionally, we have designed an algorithm that can detect when the energy counter has been reset to zero, keeping track of the number of times this has occurred. The hourly energy consumption is calculated using a formula that takes into account the current energy reading as well as any previous readings that were recorded in the current hour but during the last system boot, represented by the variable "extra".
curr_hour_energy = (energy_counter + capped_times x cap - prev_hours_energy) (x conversion_amount) + extra
Power Mode and CPU Scheduling Implementation
Overview
Energy optimisation is implemented by allocating processes to appropriate CPU cores.
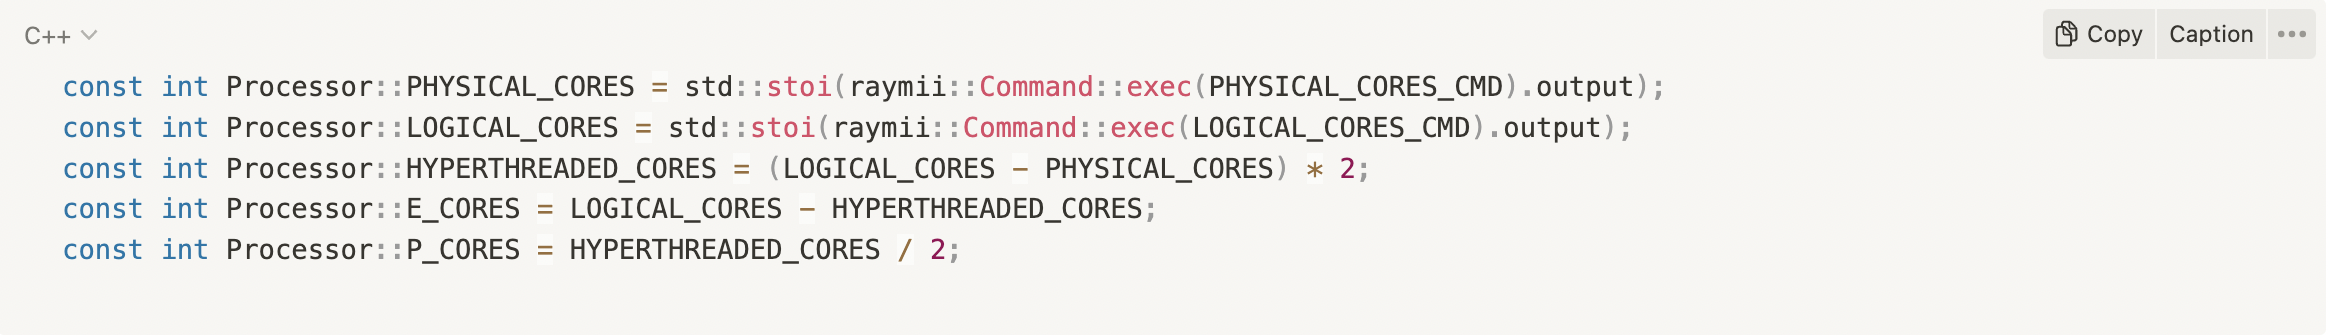
Identification
To bind processes to CPU cores in order to optimise energy consumption, we begin by identifying the Performance cores (P-cores) and Efficiency cores (E-cores) on our Intel 12th Gen processor.
We also identify the high-performance processes to be optimised by checking if its CPU utilisation is above or below certain bound.
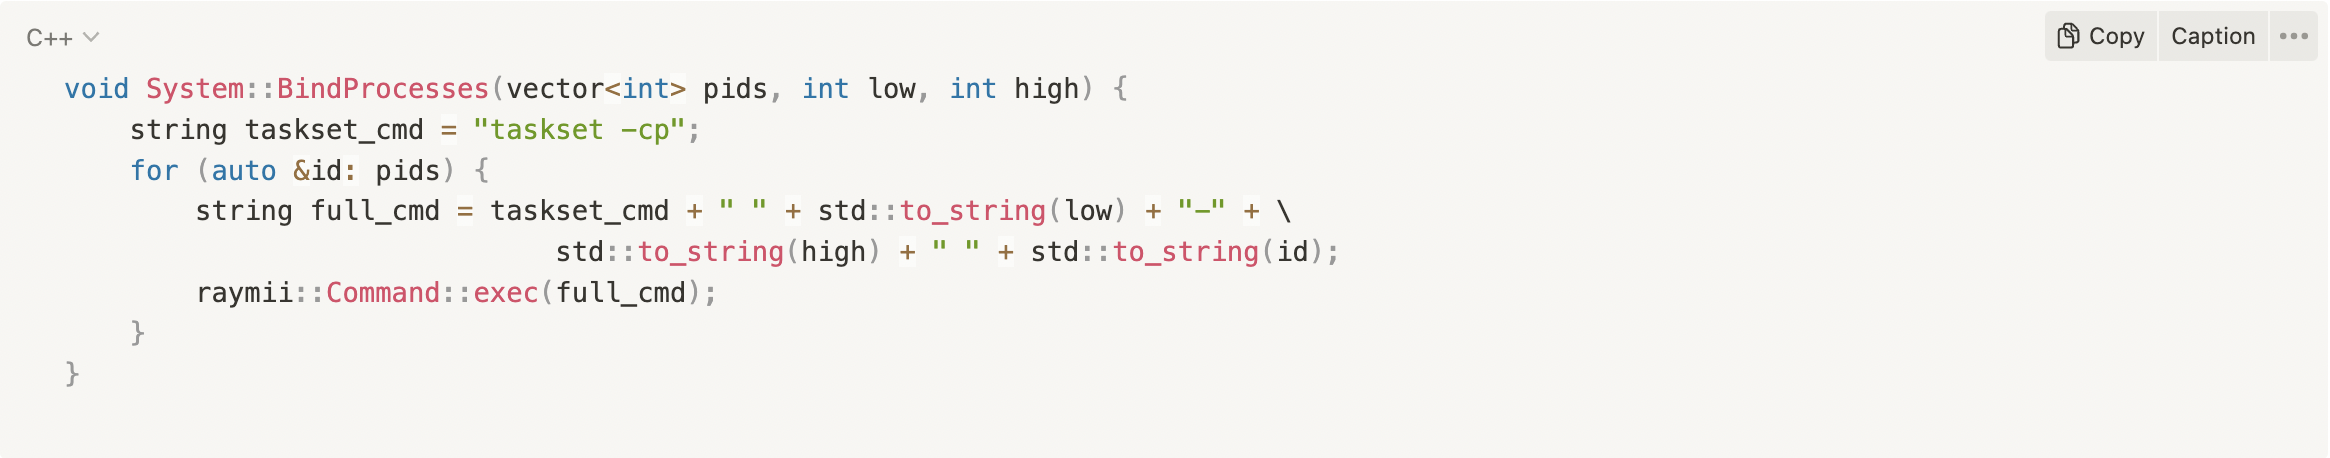
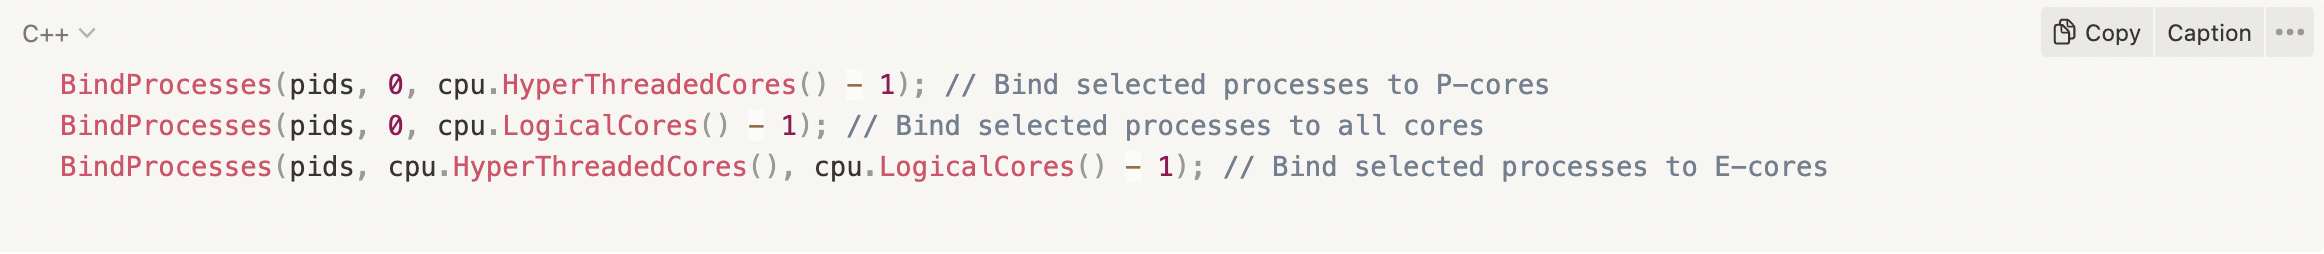
Binding
Given the processes that need to be optimised and CPU cores allocated, we use Command to execute taskset commands to implement CPU reassigning.
Automate Optimisation
The automation would be similar to a “black box” idea, in which the user is not directly involved but would receive updates on its functioning. This can be achieved through an algorithm that continuously searches for idle CPU cores, and identifies any suitable background tasks that can be assigned to them. The allocation of tasks to either P-cores or E-cores would depend on the specific requirements and usage patterns of the application. By efficiently utilising the available resources, this automated approach can optimise energy consumption and enhance system performance. This feature has not yet fully implemented, but we will keep working on it based on this proposed ideas in the near future.
Data Storage Implementation
Overview
A set of energy consumption data is stored in the user's local machine, which will be used to generate insightful report charts.
Log Files Path
The log files would be created and stored in a user local directory where persistent application data can be stored. The specific location is determined by using Qt’s QStandardPaths::AppDataLocation.

CSV File Structure
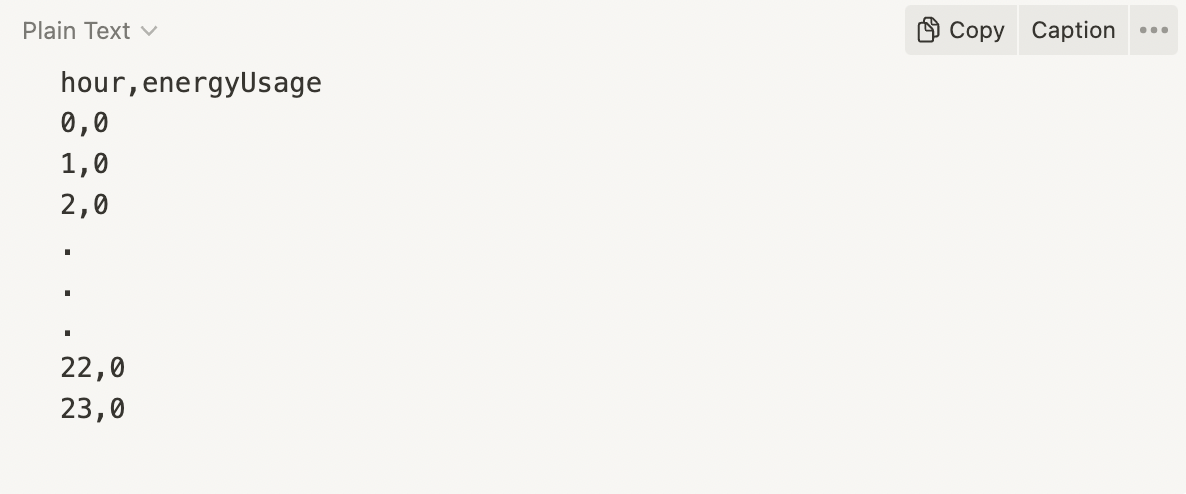
Hours log file (hours_usage.csv) contains two columns - hour and energy usage in Wh. It records the amount of energy consumption drawn in every hour in a day.
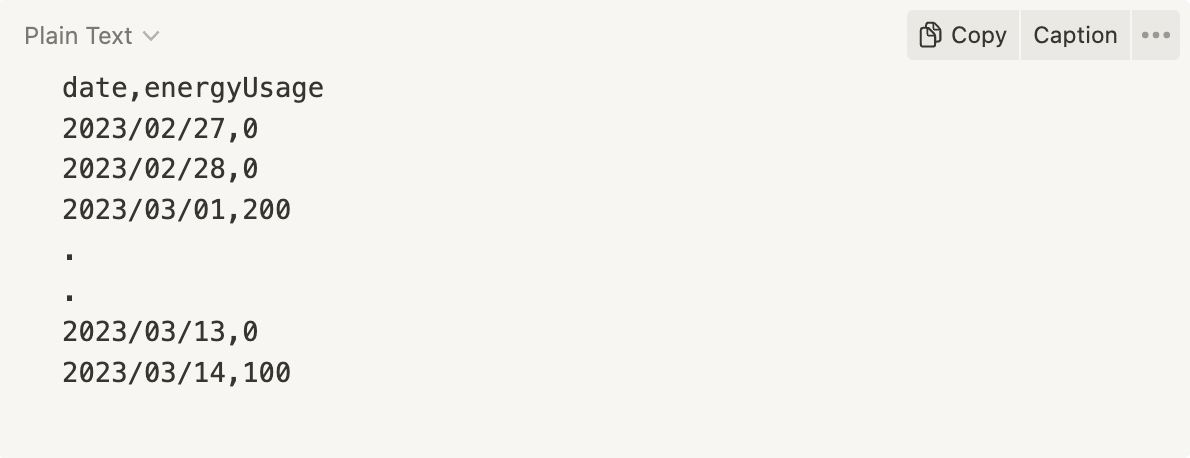
Days log file
(days_usage.csv) contains two columns - date and energy usage in Wh. The date is formatted as YYYY/MM/DD and the file stores the total amount of energy usage drawn in a day.
Data Access and Update
The PowerDAO class provides a comprehensive set of methods for accessing and updating data that is stored in the log files, making it a vital component of the data storage layer. As the sole class responsible for interacting with the data storage layer, it serves as a protective shield, preventing other classes or components from accessing or modifying the log files directly, thereby ensuring data integrity and security.
Frontend Implementation
Tools and Dependencies
Data Refreshment
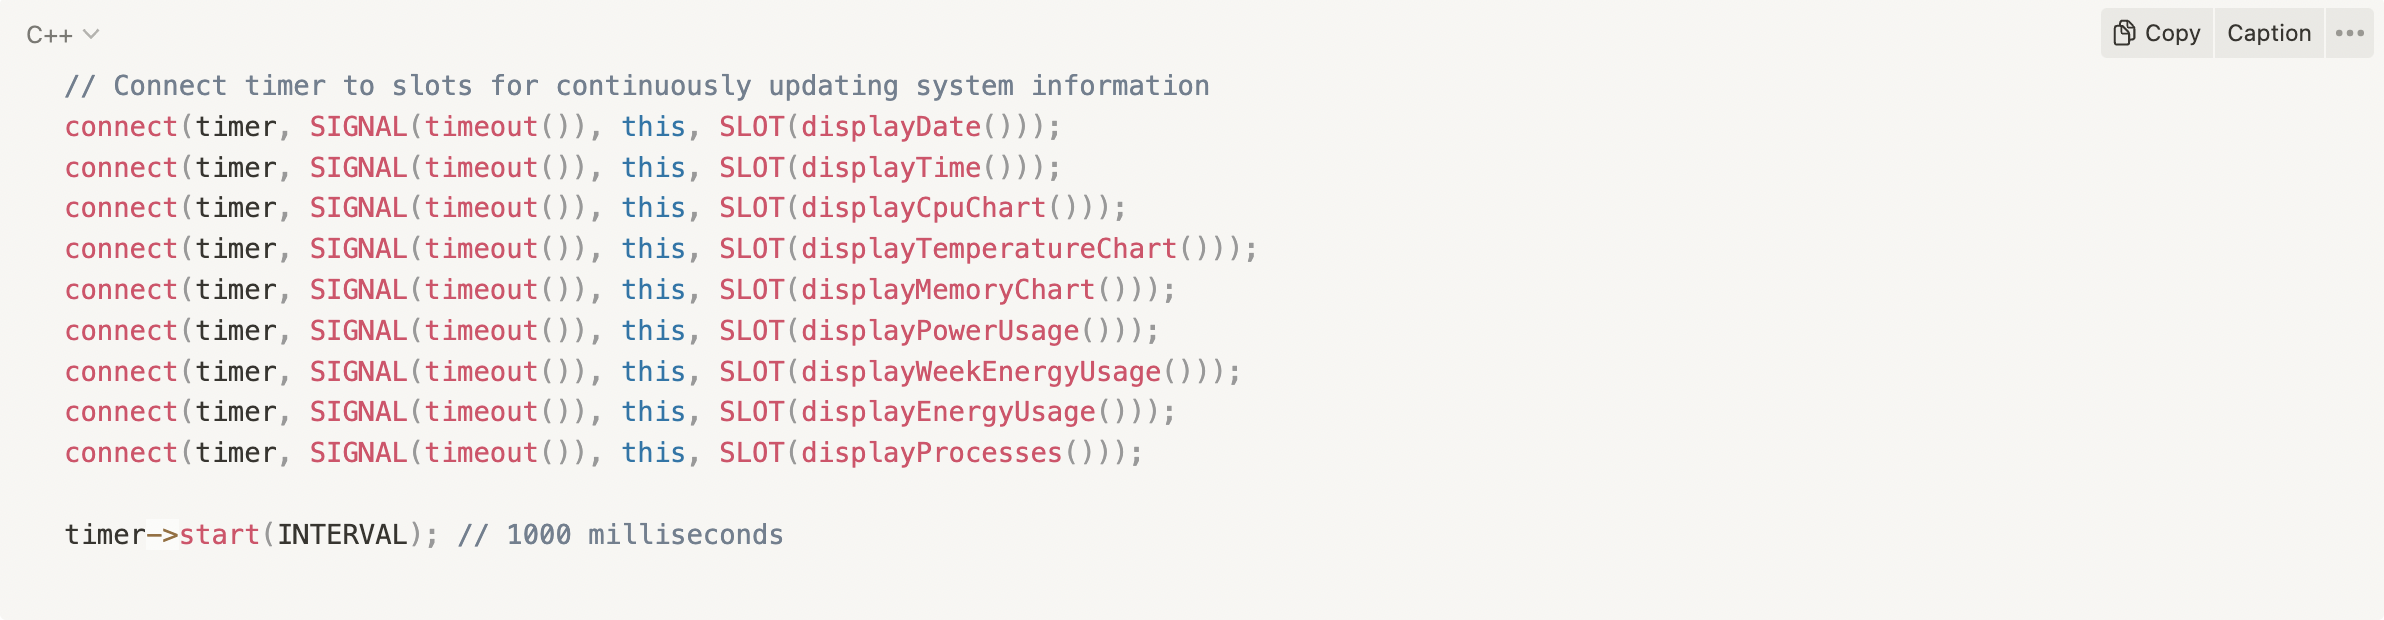
Qt provides the connect() function to establish a connection between the timer object’s timeout() signal and various slots that will be executed whenever the signal is emitted. It enables the application to continuously update various system information on a user interface over the given interval (one second in our case).
Live Data Display
Overview
The real-time system information including power usage, energy consumption, CPU and memory utilisation would be clearly presented to users.
Power Usage and Energy Consumption
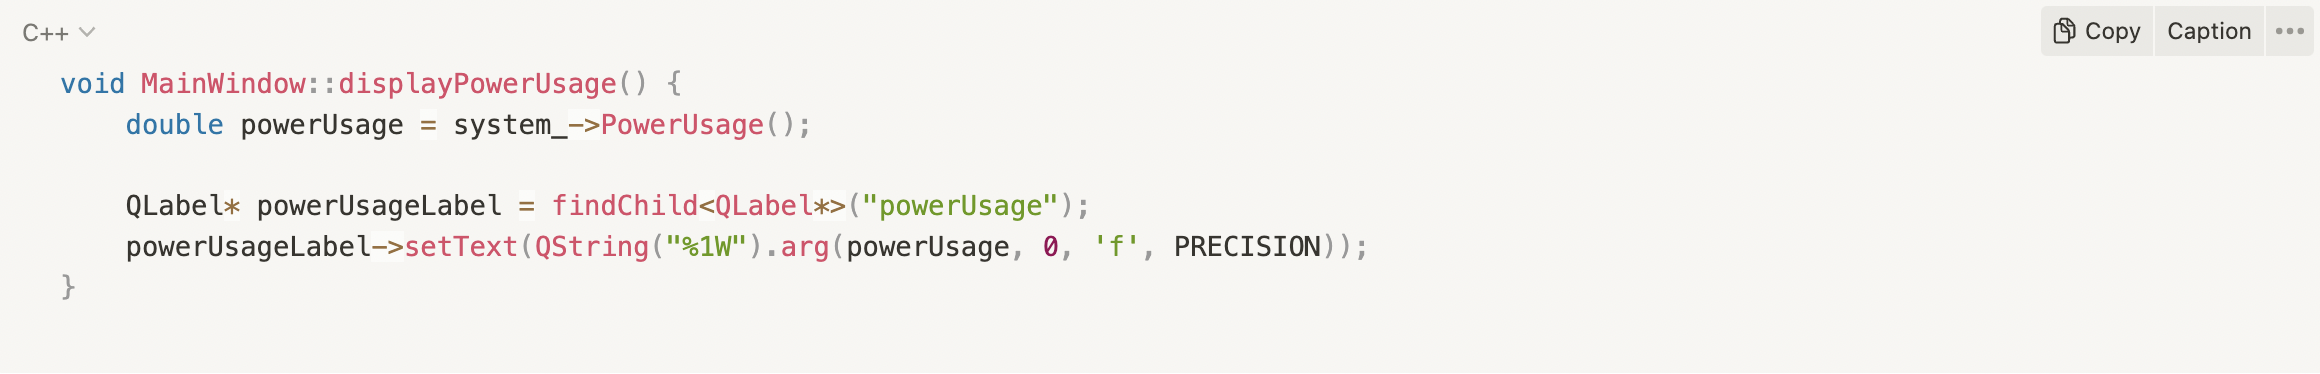
The estimated power usage and energy consumption of the system are displayed as a numerical value with its corresponding unit. For example, 12.3 W or 45.6 Wh.

CPU and Memory Data
We demonstrate the CPU information and memory usage through donut charts, which visually represent the percentage of resources being utilised. For example,
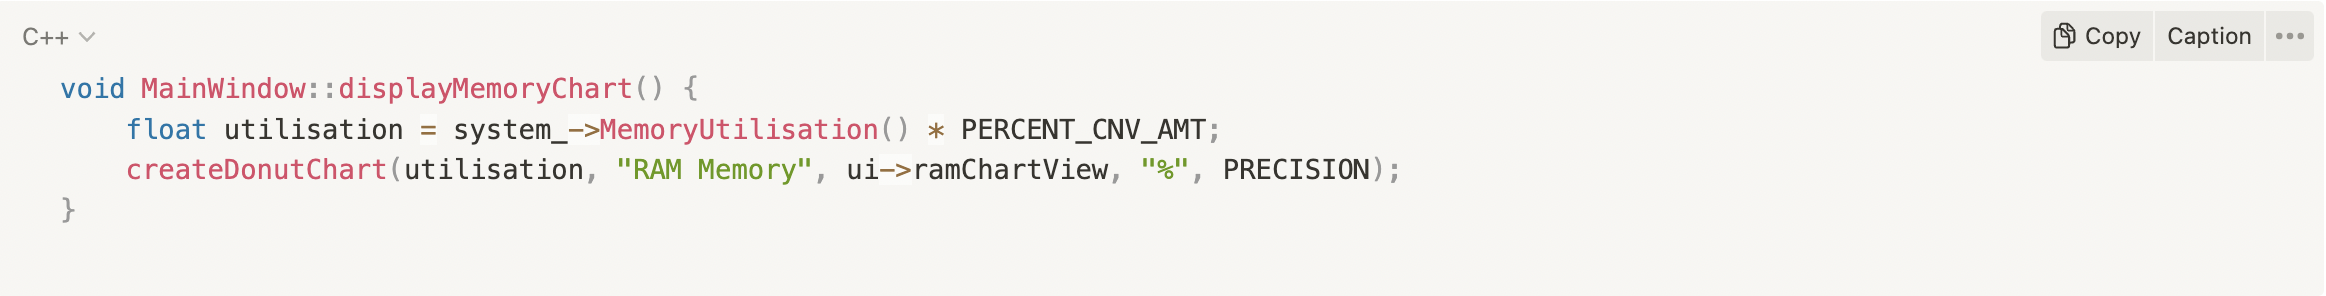
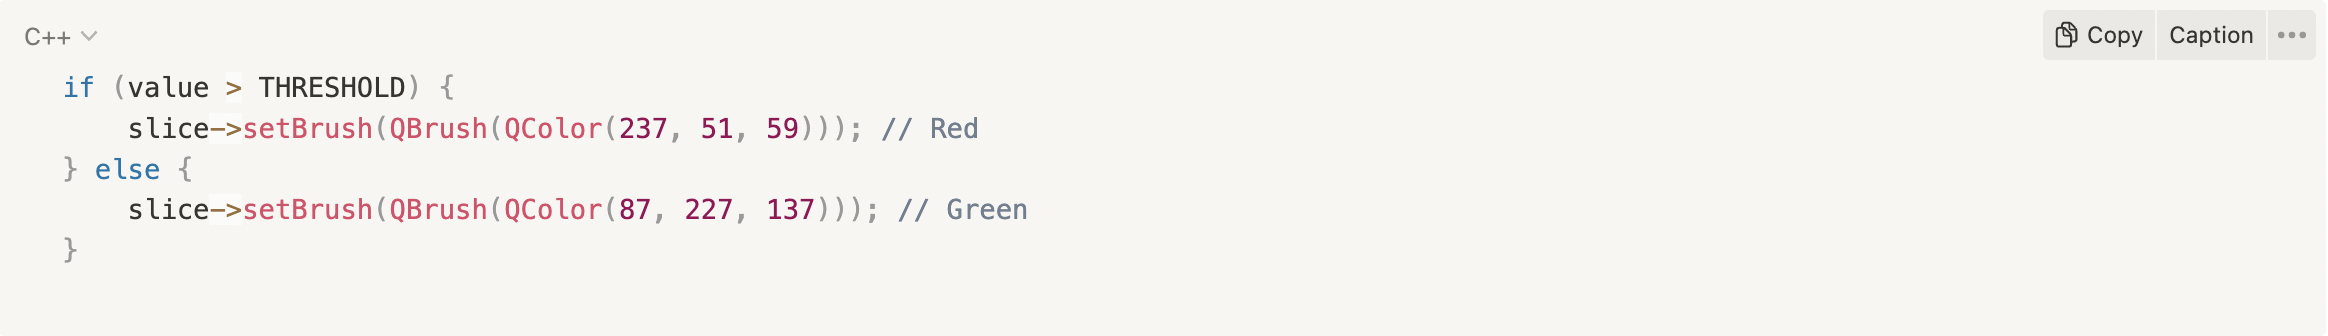
Plus, to make the charts even more informative, we implemented a color-coding scheme for the donut charts. Specifically, the CPU and memory donut charts will be colored in green if their resource usage percentage is below a certain level, indicating that the system is running efficiently. However, if the usage percentage exceeds this threshold, the charts will turn red, alerting the user to potential performance issues or resource constraints.
Process
The processes table is sorted in descending order based on CPU utilisation, which means that the processes with the highest CPU usage are listed at the top of the table. This sorting order helps users identify which processes are using the most CPU resources and potentially causing performance issues on their system.
Energy Report Graphs Generation
Overview
EcoMeter would generate a couple of energy report charts, which are implemented using Qt alongside its Chart modules.
Hourly and Daily Energy Usage Chart
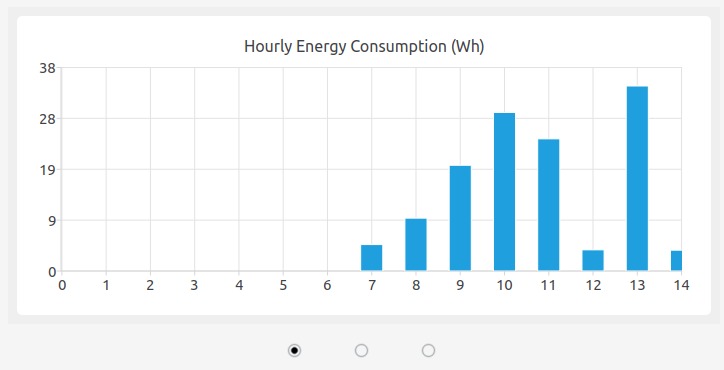
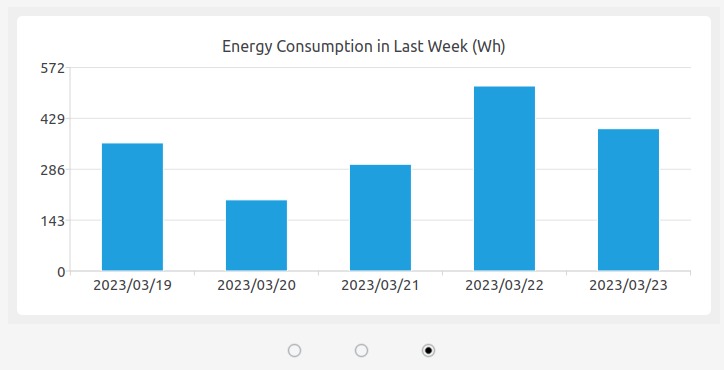
To provide users with a comprehensive overview of energy consumption patterns, we generate bar charts that illustrates the energy consumed in each hour of the current date as well as used in the last week. The charts identifies peak energy consumption hours and days, which can help users optimise their energy usage and reduce their overall energy costs.
Accumulated Energy Usage Chart
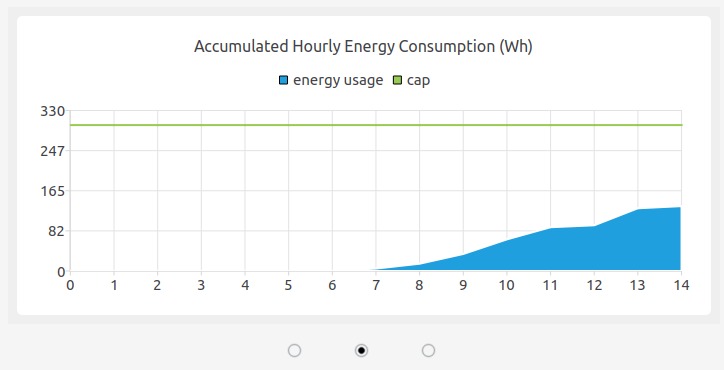
In addition to the bar chart that displays hourly energy consumption, we also provide users with an area chart that shows the cumulative energy usage over the course of a day. This chart allows users to see the overall trend of their energy usage and identify any significant changes or anomalies.
To help users manage their energy consumption effectively, we also include a cap line in the same chart, which represents the user's daily energy usage target. This line provides a clear and concise visual reference for users to see if their energy usage exceeds their target, enabling them to adjust their energy usage habits accordingly.
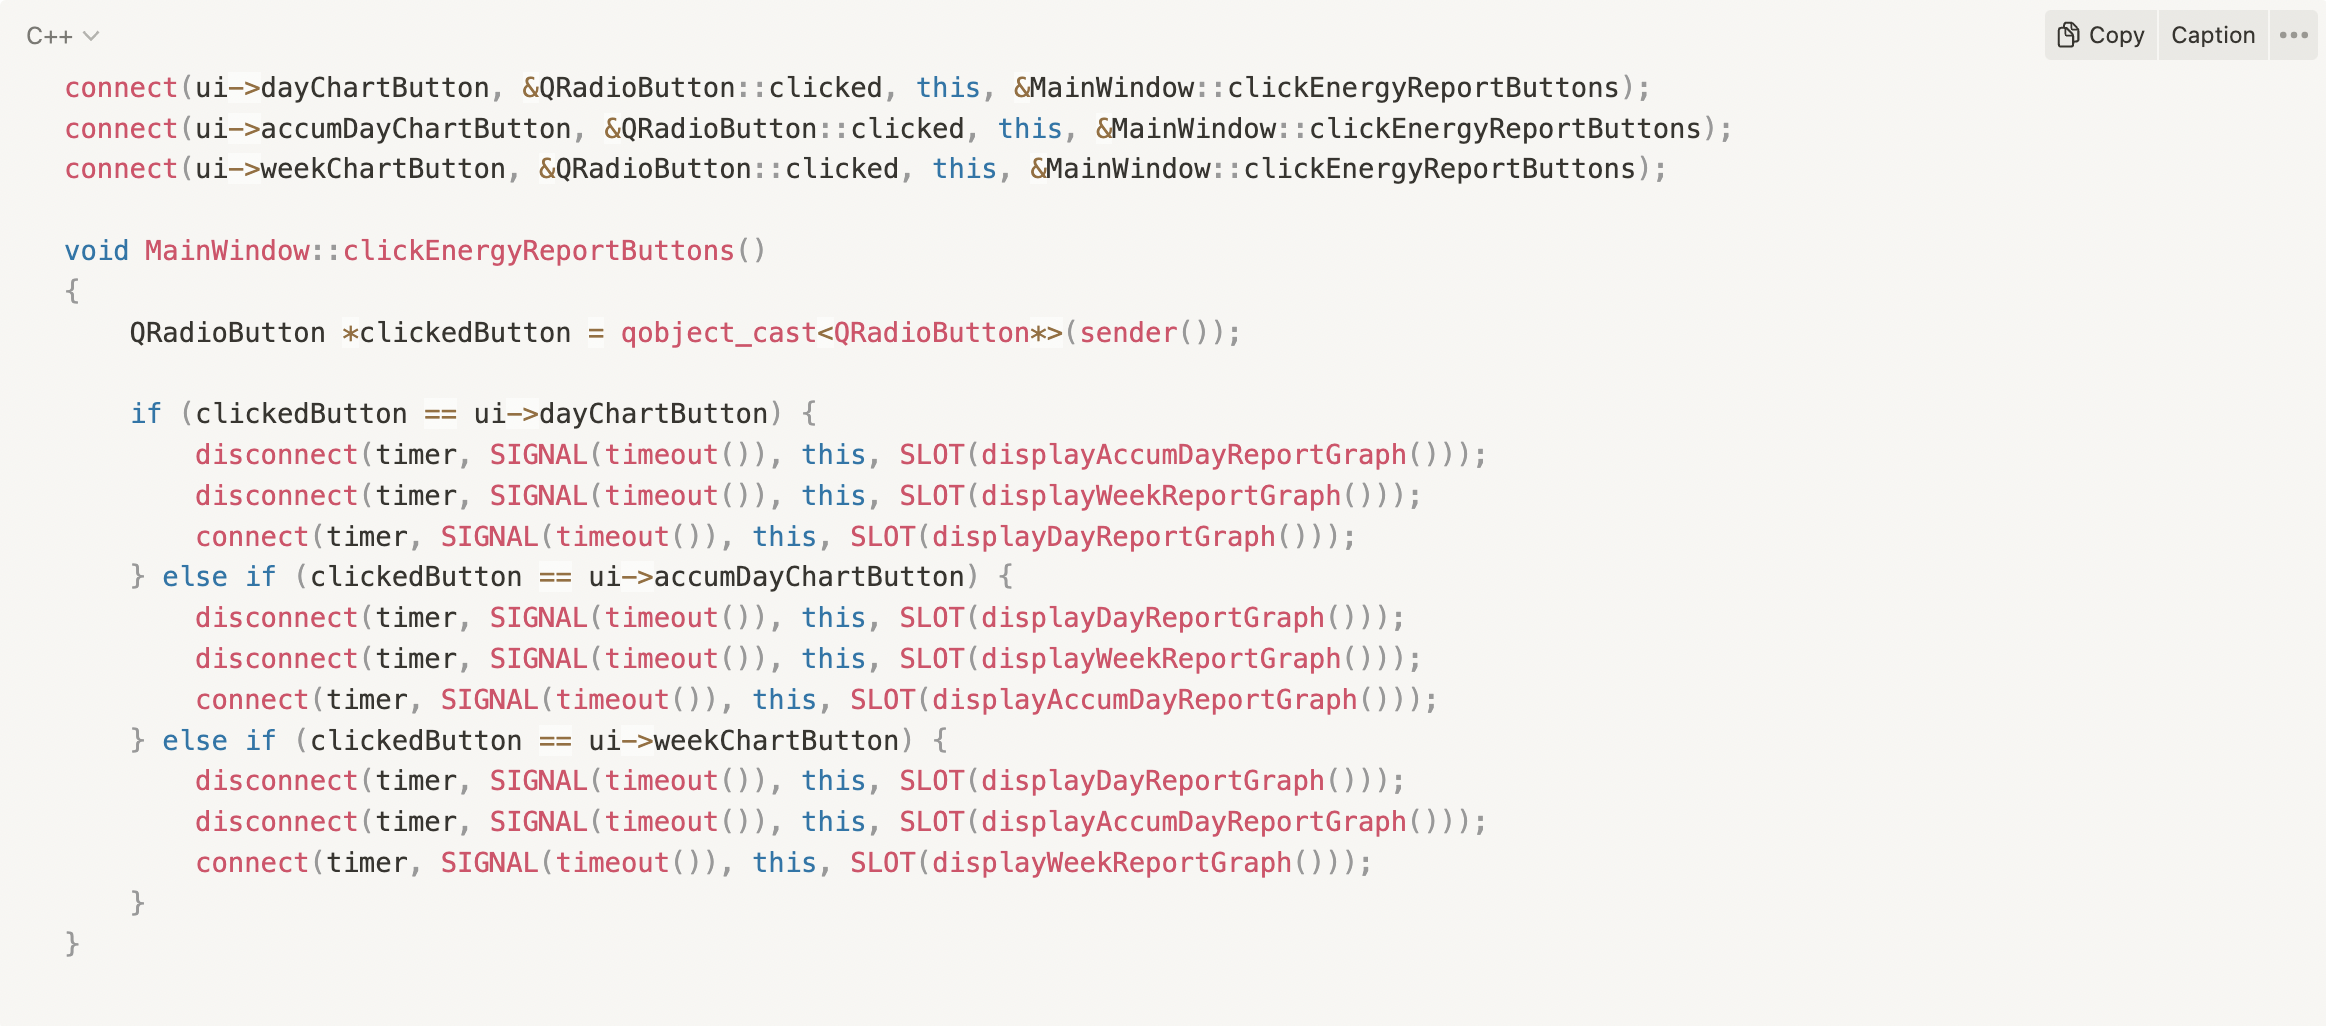
Switch between Charts
To implement the feature of switching between different report charts, we continuously monitor whether the user has clicked on any of the corresponding buttons, and connect the chart-generating slots to the timeout() signal to update the data periodically. This approach ensures that the charts are always up-to-date and accurately reflect the latest data, while also allowing users to switch between different chart views seamlessly.
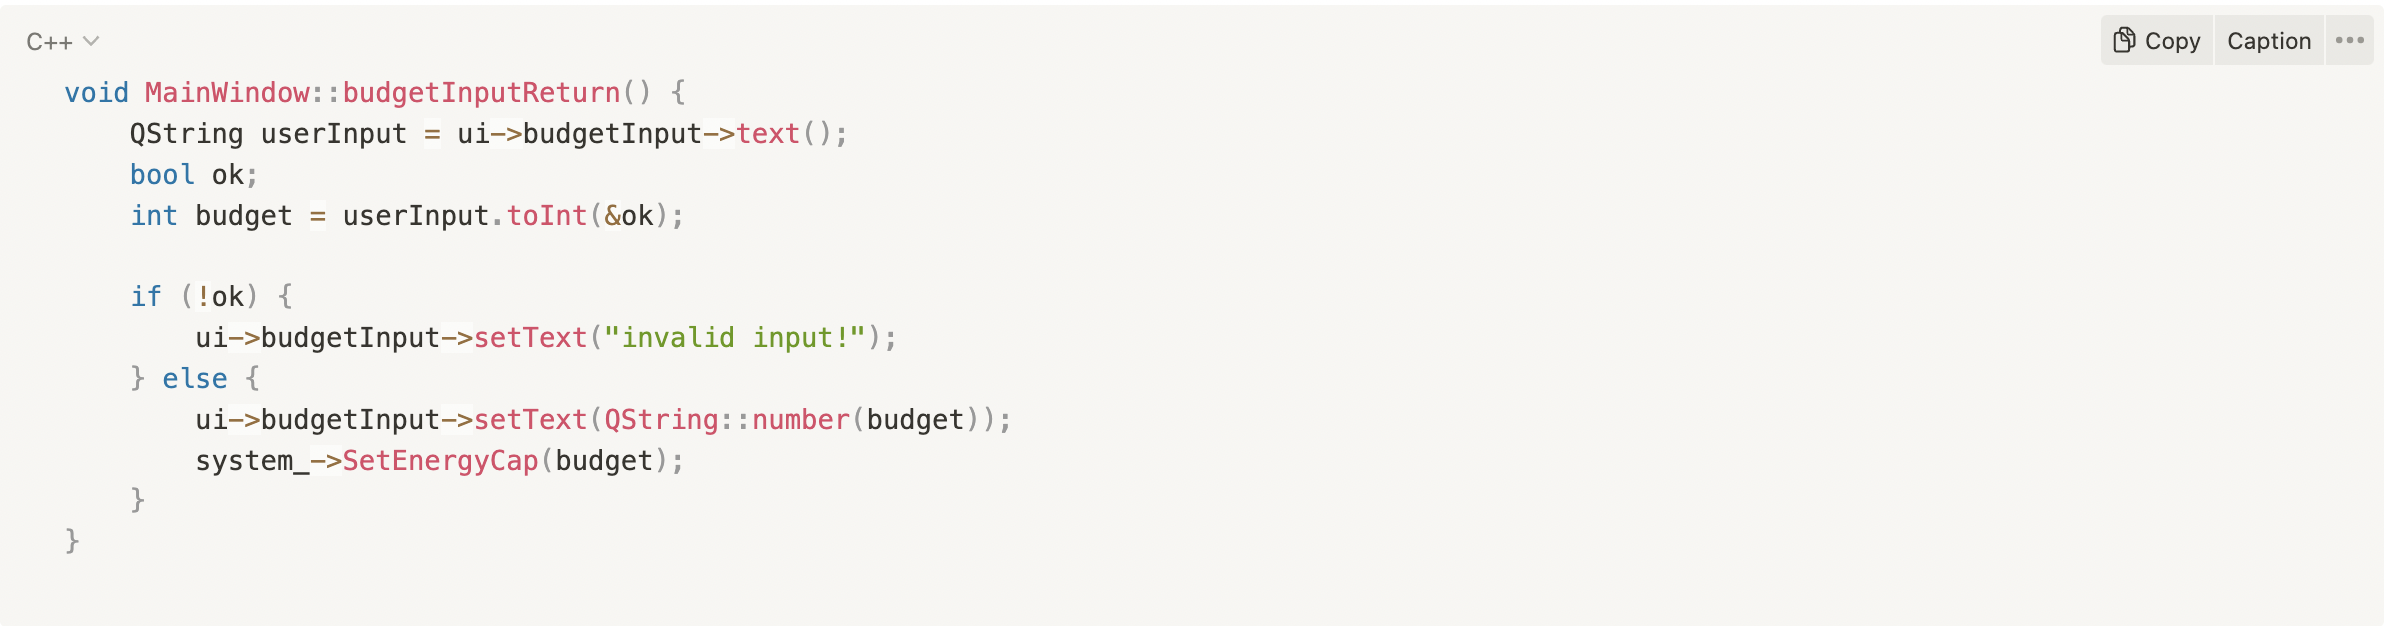
Daily Energy Cap Customisation
Users are allowed to enter their own target on daily energy consumption, which would be displayed in the Accumulated Energy Usage Chart. The program would check if the input value is valid or not, and gives some appropriate prompts.
Power Mode Selection
Power modes, including Max Turbo, High Performance, Power Saver, and Auto, are implemented as separate buttons, each bound to a click event that triggers the corresponding function. This approach enables users to easily switch between different power modes, depending on their needs and preferences. By providing this level of flexibility and control, we empower users to optimise their energy usage and extend the lifespan of their devices, while also reducing their overall energy consumption and environmental impact.
References: