Testing Strategy
Our testing documentation can also be read at: Testing documentation.
Testing is a crucial aspect of software development; it is essential to ensure that a system functions correctly and meets the end-user's requirements.
There are several methods of testing softwares, including unit testing and integration testing. However, in the case of our application, these traditional methods may not yield meaningful results. One of the primary purposes of EcoMeter is to provide our users with real-time data on system resources and energy consumption. Therefore, the application must be tested using appropriate techniques.
In this regard, we chose to conduct Functional Testing and User Scenario Testing to assess the main services of EcoMeter.
Additionally, we utilised other testing methodologies to ensure the overall quality and reliability of EcoMeter. These include Compatibility Testing and User Acceptance Testing.
Functional Testing
Functional testing is a crucial software testing method that verifies whether a software system adheres to the functional requirements, which in our case, involves testing the real-time data displayed by our application against the same readings on other reliable monitors existing in the markets.
Compatibility Testing
Compatibility testing ensures that EcoMeter is compatible with various hardware and software configurations.
User Scenario Testing
By conducting User Scenario Testing, we were also able to test the EcoMeter under various conditions that our users may encounter.
User Acceptance Testing
User acceptance testing involves testing the EcoMeter with a group of representative users to ensure it meets their requirements and is easy to use.
By utilizing these testing methodologies, we ensure that EcoMeter is of the highest quality and reliability, and meets the expectations of our users.
Functional Testing & User Scenario Testing
Tools and dependencies:
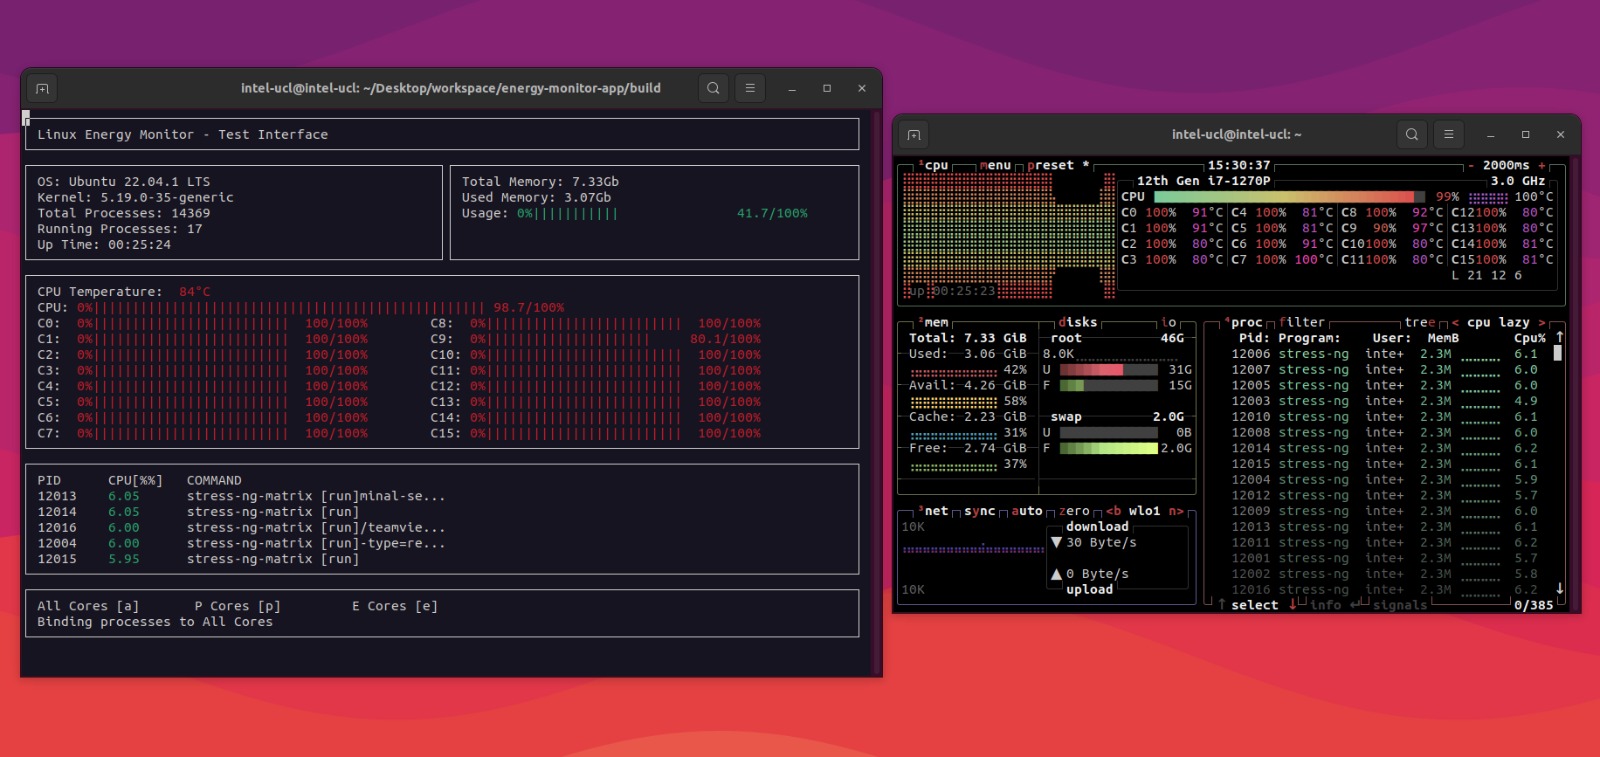
Ncurses and C++ - We created a text-based user interface that displays all the essential system information we gathered. This interface makes it easy and clear to conduct the comparison testing, as it provides a simple and intuitive way to view the data collected from our application.
btop - We have been comparing EcoMeter to btop, a reliable system resource monitor that displays usage and statistics for processor, memory, and processes.
power meter - It is a monitoring device for measuring power and energy consumption of our testing desktop.
screen recorder - We utilise Ubuntu built-in screen recorder to record the readings of both monitors over a period of time.
Testing Live System Data:
Methodology
To evaluate the accuracy of our collected system information, we conducted a comparison test by running a set of applications and processes to simulate different usage scenarios. We recorded the system information readings from both EcoMeter and the btop monitor as well as the power meter, over a period of one minute for each use case. In total, we collected 60 readings for each use case. After recording the data, we compared the readings to identify any discrepancies or differences.
Metrics
We used this testing method specifically for the following metrics:
- General system information: up time, kernel, operating system
- Memory: total memory, used memory, utilisation
- CPU: temperature, utilisation (of each core)
- Process: pid, CPU utilisation, order
- Power: live usage
Use Case 1: Idle
The purpose of this use case is to simulate a scenario in which the system is powered on but not actively being used. By testing this scenario, we can evaluate the accuracy of EcoMeter when the system is in an idle state.
Use Case 2: Work
To simulate a "work" scenario, we opened and closed applications such as Firefox Web Browser, TeamViewer, and Visual Studio Code. By doing so, we could evaluate the performance of EcoMeter when the system is under a moderate workload.
Use Case 3: Gaming
By conducting stress tests, we can simulate a scenario in which the user is playing resource-intensive games. This allows us to evaluate the accuracy and efficiency of EcoMeter under heavy system load.
Results
During the comparison testing of the above use cases, we found that the values displayed on both btop and our energy monitor application were similar. EcoMeter correctly identified the system's uptime, kernel version, and operating system type. It reported our testing device’s total memory of 7.33 Gb, the same as btop’s reading; we also observed a small error of +/- 0.01 Gb in the used memory readings. For CPU utilisation and process information, the readings of both monitors are similar, with a small error of +/- 2%. The ID and order of displayed processes are also accurate. It is noted that sometimes there was a noticeable difference in the readings of percentages, as our monitor responded faster than btop, which had a delayed reaction to the readings (can be found in the readings of up time). We did observe a relatively large error in the CPU temperature readings, which could be attributed to a number of factors, such as differences in the used sensors or variations in the thermal environment of the system during the testing. Lastly, we found that the error in the readings of live power usage from EcoMeter and the wall power meter was within 1-4 watts.
Our system monitoring service met our expectations, although there is some room for improvement in overall performance.
Testing Energy Consumption:
Methodology
To generate more accurate and representative data, we conducted stress tests to create an amplified workload on the system, resulting in increased energy consumption. These tests allowed us to easily observe the readings and assess the accuracy and reliability of EcoMeter under high-pressure situations. In addition to stress testing, we also stimulated a set of use scenarios that may impact the performance of the application.
Use Case 1: Consecutive Use
We simulate a scenario in which a user typically uses their desktop computer for at least a whole hour at a time. We recorded the readings of energy consumption drawn in an hour from both our monitor and the wall power meter, and tested for five times.
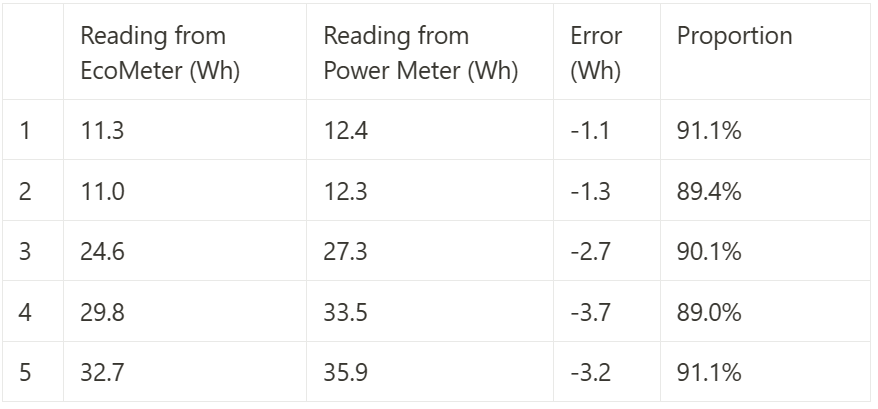
Based on the gathered data, we found that there is some variation between the readings from our monitor and the power meter. However, the proportion of the monitor reading relative to the power meter reading is consistently high, ranging from 89.0% to 91.1%. This suggests that the monitor may be slightly overestimating the actual power consumption, but the difference is relatively small (which is because EcoMeter mainly monitors energy usage drawn by CPU). This result met our requirements and expectations.
Use Case 2: Reboot in an Hour
In this use case, we simulated a scenario where a user shuts down the system and reboots it within an hour. To test this, we started the system at the beginning of an hour (at ${h_1}$:00). Then, after running the system for 20 minutes, we recorded the readings of energy usage and turned off the desktop (at ${h_1}$:20) and left it in the power-off state for another 20 minutes before booting it up again (at ${h_1}$:40). Finally, we recorded the energy consumption at the end of the hour to see if the total usage was accurately stored.
After testing for a couple of times, our application is regarded as reliable for monitoring hourly energy consumption in this use case when users may shut down the system within an hour.
Use Case 3: Reboot in other Hour
In this use case, we simulated a scenario where a user shuts down the system and reboots it in a different hour. To test this, we started the system at the beginning of an hour (at ${h_1}$:00). Then, after running the system for 30 minutes, we turned it off (at ${h_1}$:30) and left it in the power-off state for another 60 minutes before booting it up again (at ${h_2}$:30). We recorded and compared the readings of hourly energy consumption from both monitors at ${h_1}$:30 (total energy usage in ${h_1}$) as well as end of ${h_2}$ (total usage in ${h_2}$).
After testing for a couple of times, we observed that EcoMeter successfully records precise amounts of energy consumption in both hours.
Other Cases
We also evaluated the accuracy of total energy consumption by testing use cases when a user typically shuts down the system before sleep and reboots it in the morning another, and when the system is consistently powered on for several days.
The testing results suggested that EcoMeter is able to handle all these edge cases and would present reliable data to our users.
Testing CPU Scheduling:
Methodology
We assessed the functionality of switch between different power modes by observing the changes in system resource usage, i.e. utilisation of each CPU core and processes information. In order to better visualise and measure these changes, we also utilised stress tests that helped to produce a more pronounced workload on the system.
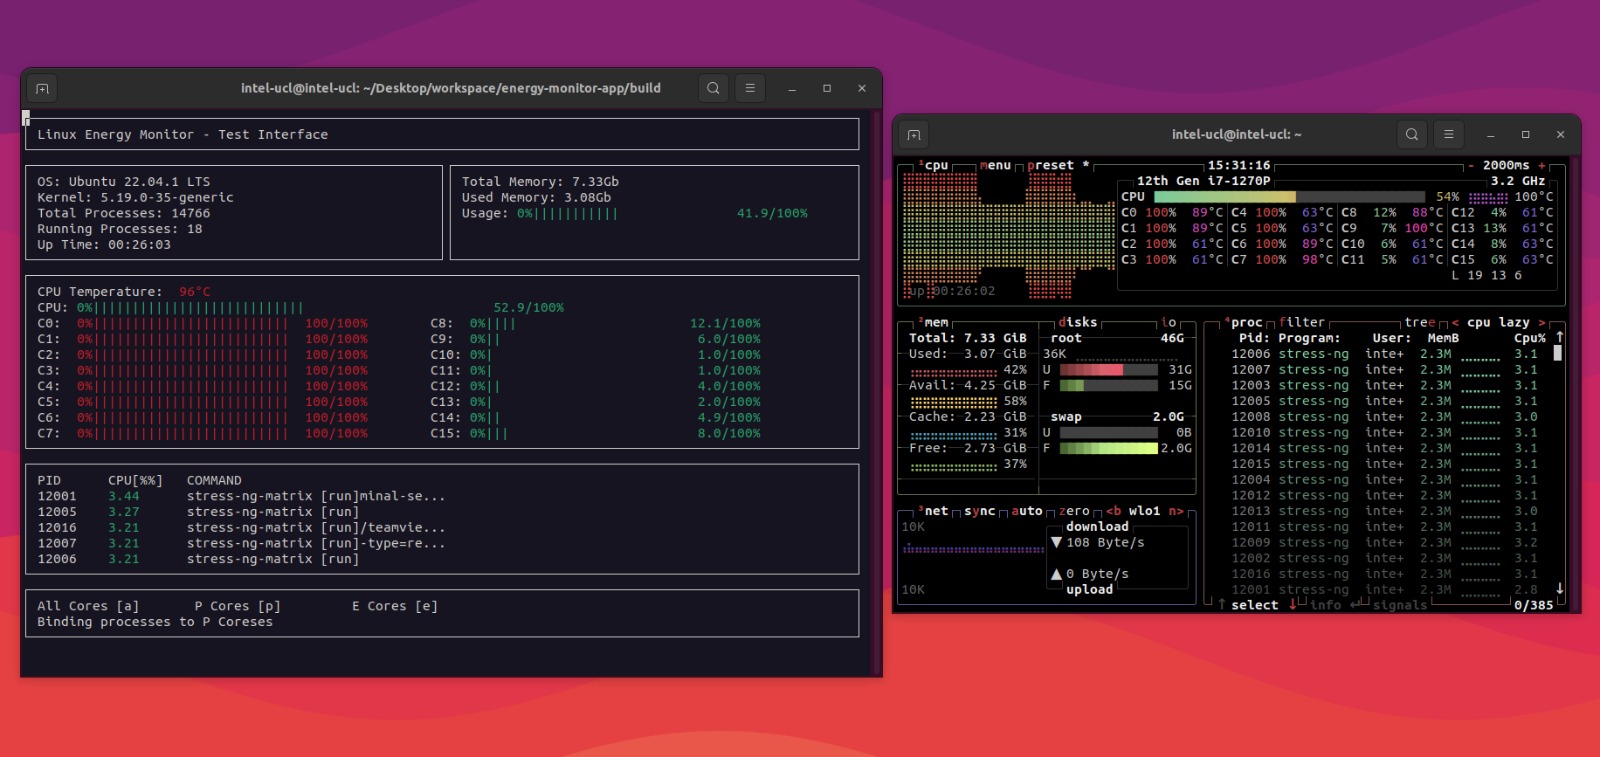
Bind to Performance Cores
By pressing key ‘P’ (switch from all cores to P-cores), a noticeable drop in percentage of the Efficiency cores could be seen.
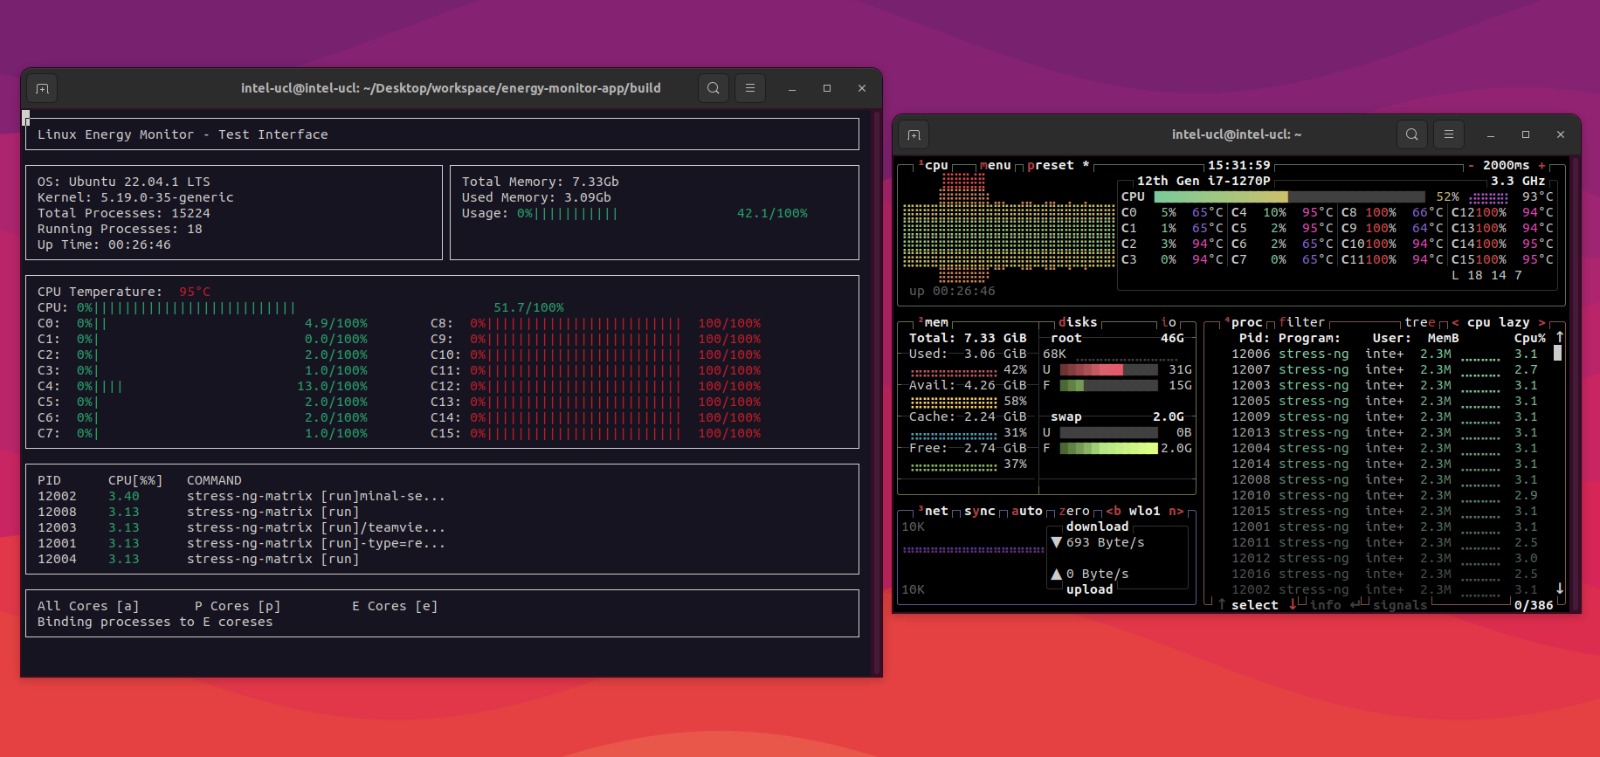
Bind to Efficiency Cores
By pressing key ‘E’ (switch from all cores to E-cores), a noticeable drop in percentage of the Performance cores could be seen.
Bind to All Cores
By pressing key ‘A’ (switch from E-cores to all cores), all cores are back to process processes.
Conclusion
Overall, EcoMeter performed well and provided reliable data for system analysis and optimisation.
Compatibility Testing
Compatibility testing is an essential part of software testing, which aims to ensure that the developed application is capable of running on various hardware and systems. In this project, our application was thoroughly tested on different Linux desktop devices with Intel 12th Gen processor, as specified in the requirements. Typically, the majority of the development work was done on the Ubuntu 22.04.1 LTS operating system, using an Intel NUC 12 Pro Kit (NUC12WSKv7) with i7-1270P processor as the primary hardware platform.
To ensure that EcoMeter meets the compatibility requirements, several key points were considered during the testing process. These include:
Functional features:
- System Information Monitoring
- Switch between different Power Modes
Non-functional features:
- Windows Form Size
- Text Size
- Table and Chart View
- Color
- Readability
During the testing process, all functional features of the application were verified to be working as expected, and the user interface was clear and easily readable on all devices tested. Based on these results, we can conclude that the compatibility testing was successful.
User Acceptance Testing
Overview
To gain a deeper understanding of how well EcoMeter meets the necessary requirements and to identify potential areas for improvement, we recruited four individuals with specific user profiles to test our product and provide feedback.
Testers:
Olivia Chen
Brandon Kim
Sophia Patel
Xavier Nguyen
These four testers are all our potential users, who are seeking for tools to monitor their system resources and energy consumption.
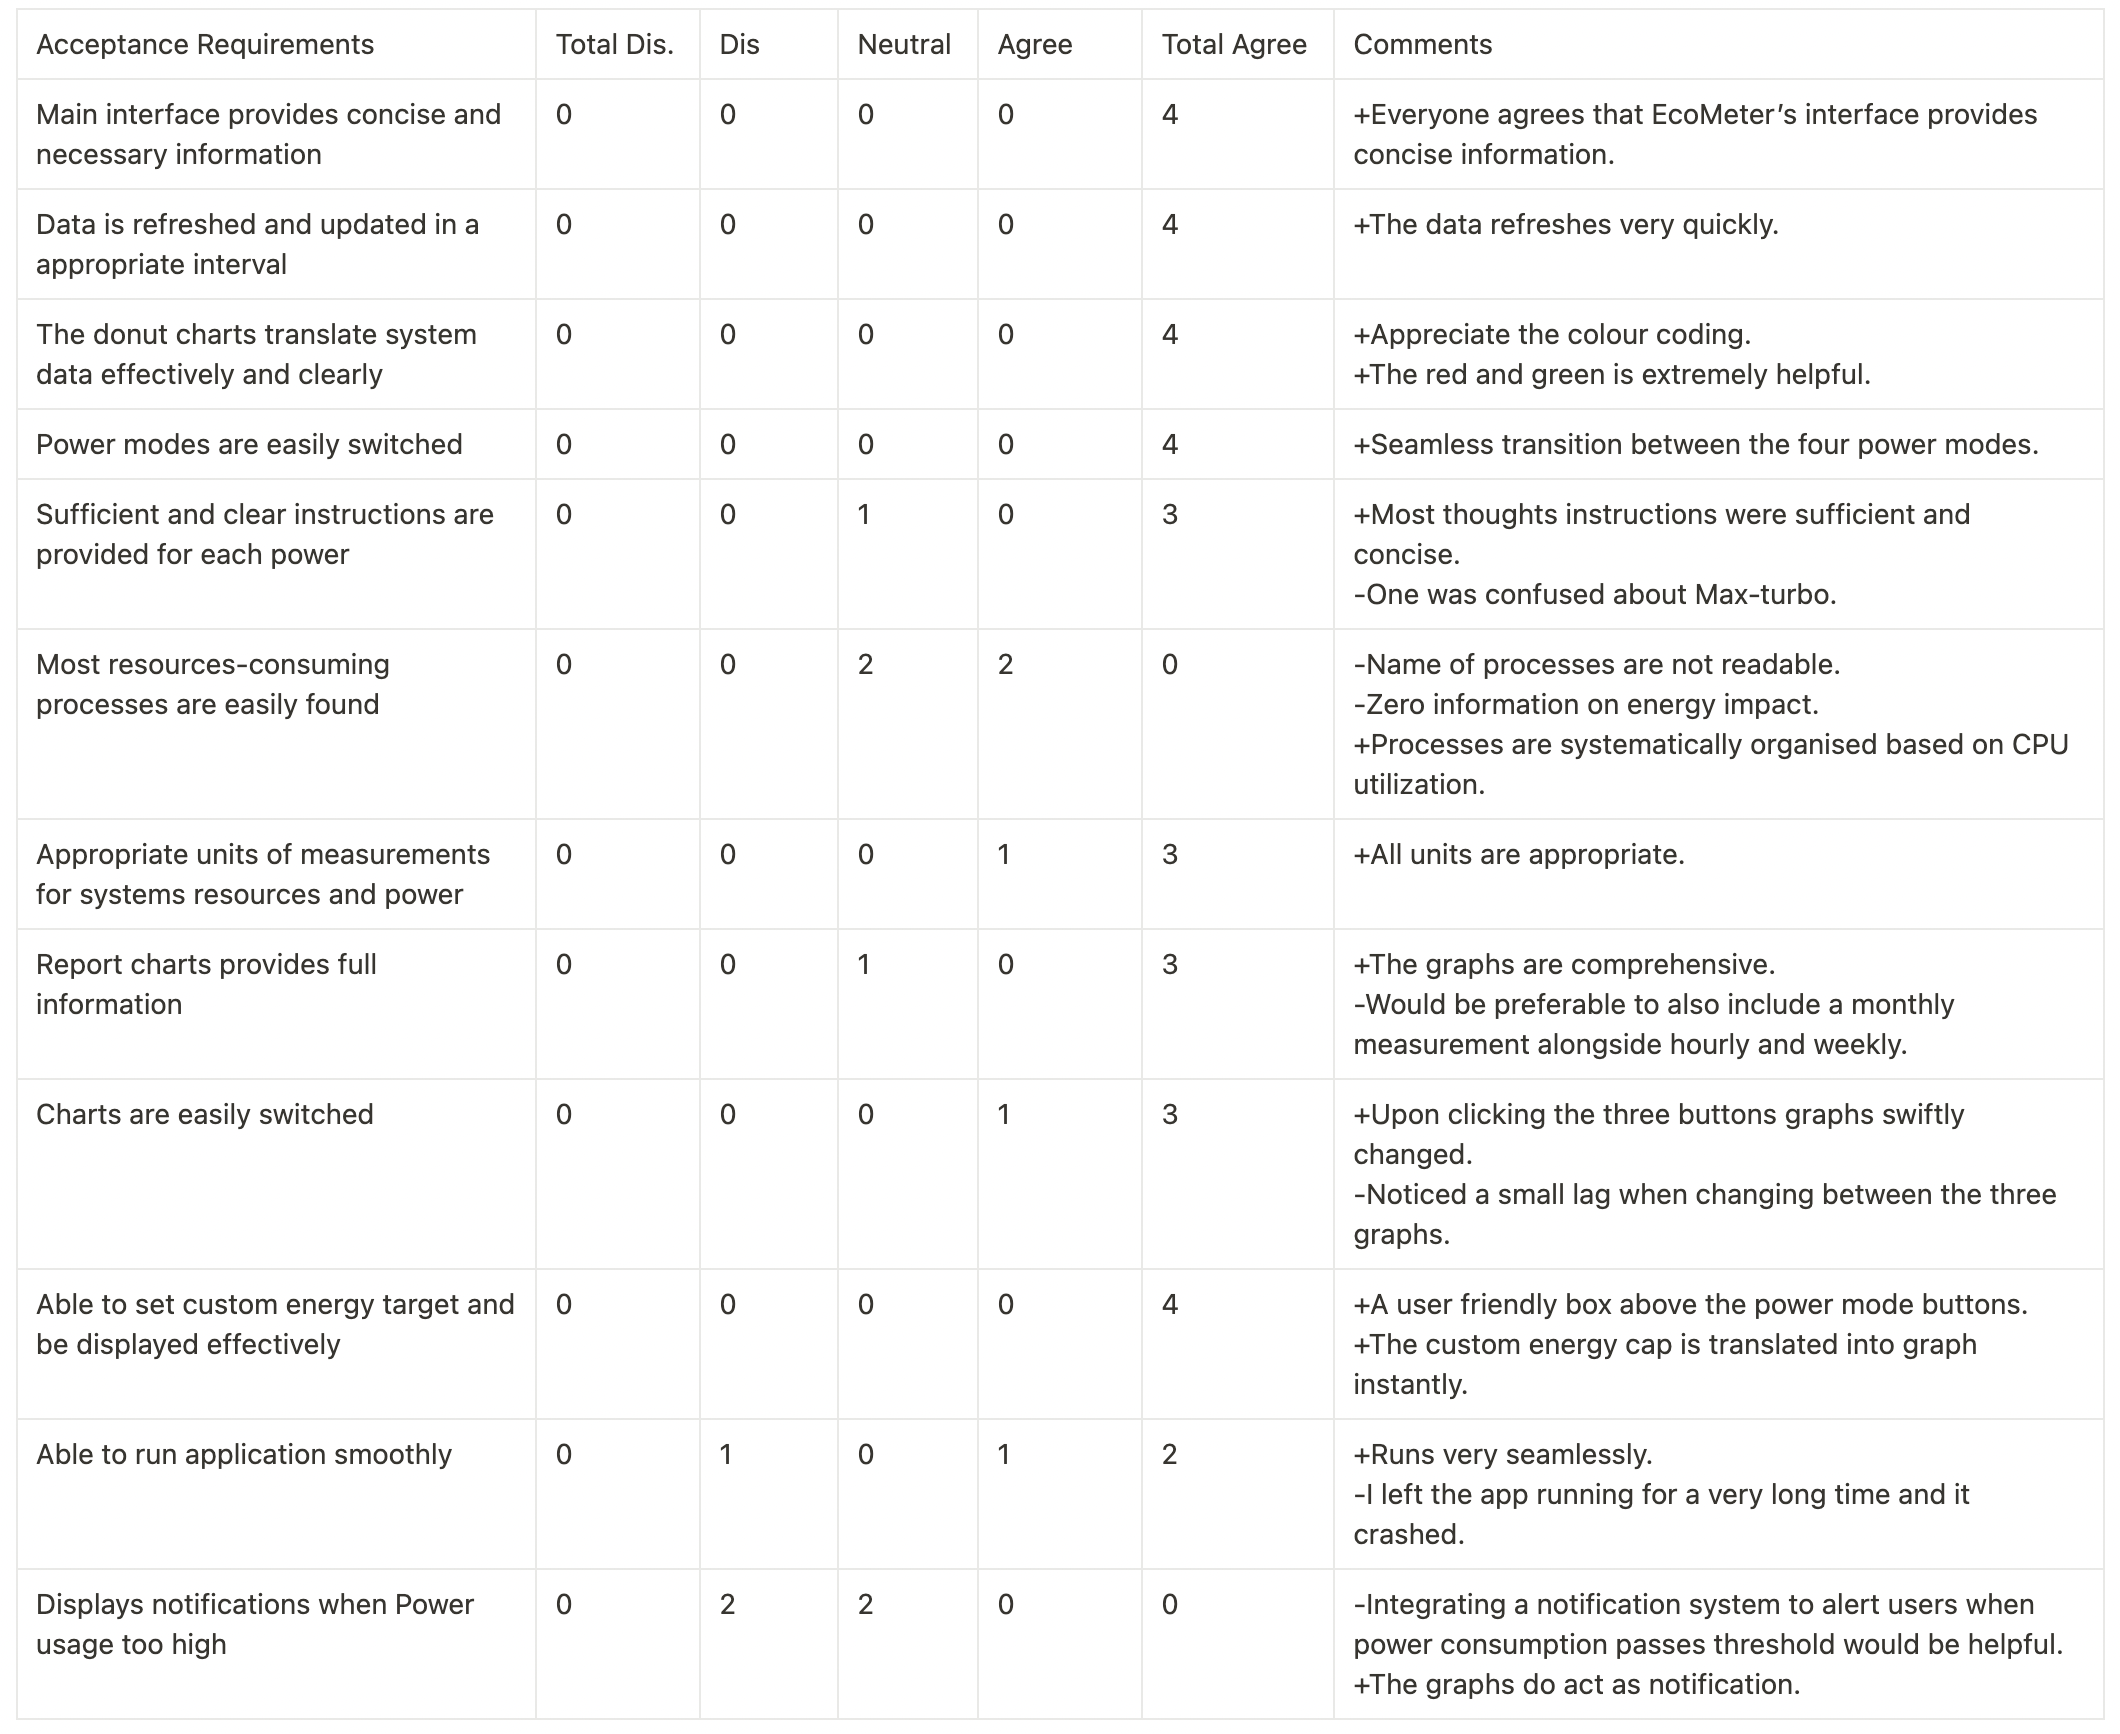
Test Cases
We conducted four distinct test cases with the selected users. In each test case, the users were asked to rate the acceptance requirements using a Likert Scale and provide custom comments for each requirement.
Feedbacks