Architectural Diagrams
Project Overview Diagram

As shown in the diagram, our project attempts to collect data from multiple data source to produce a city pollution app for London. This the basic overview of how technologies are used within our project, with a Node JS API being used to query the data sources and saving the queried results into a MongoDB database. The smartphone makes requests and gets responses from the API in JSON/XML format and this is passed onto the smart watch where data is shown in visualisations for the user.
Example Update Process
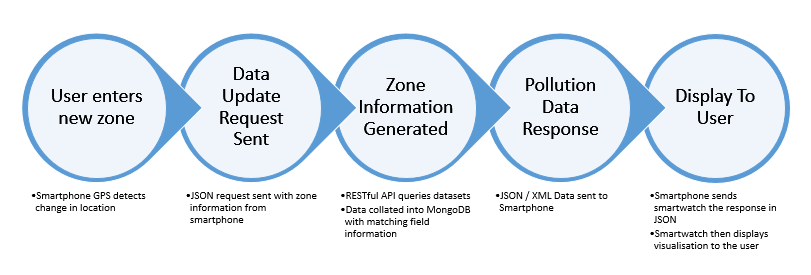
Here is a simple example of what we envision the data update process to be for our app with the interaction between technologies.