City Data Visualiser

Description
The City Data Visualisation Project comprises of 2 elements:
NodeJS Server API
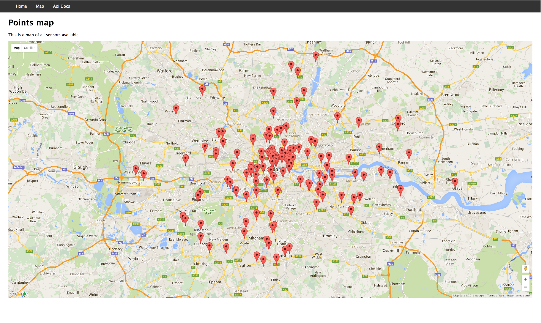
Combines data from three data sources and stores in API
Multiple Data Requests
-
Request all data from the API
-
Request data a certain distance from a particular point
-
Request the nearest data for particular pollutant types
Smartwatch & Smartphone Visualisation Application
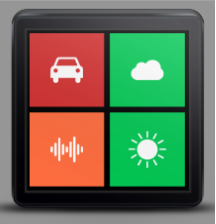
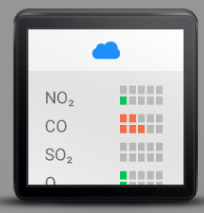
User-Friendly UI
-
Colour Coded Visualisations
-
Scaled Format for Data Values
Four different visualisation data types
New data requested upon location change
Showcase
For an overview of our application, please view our overal system video