Map
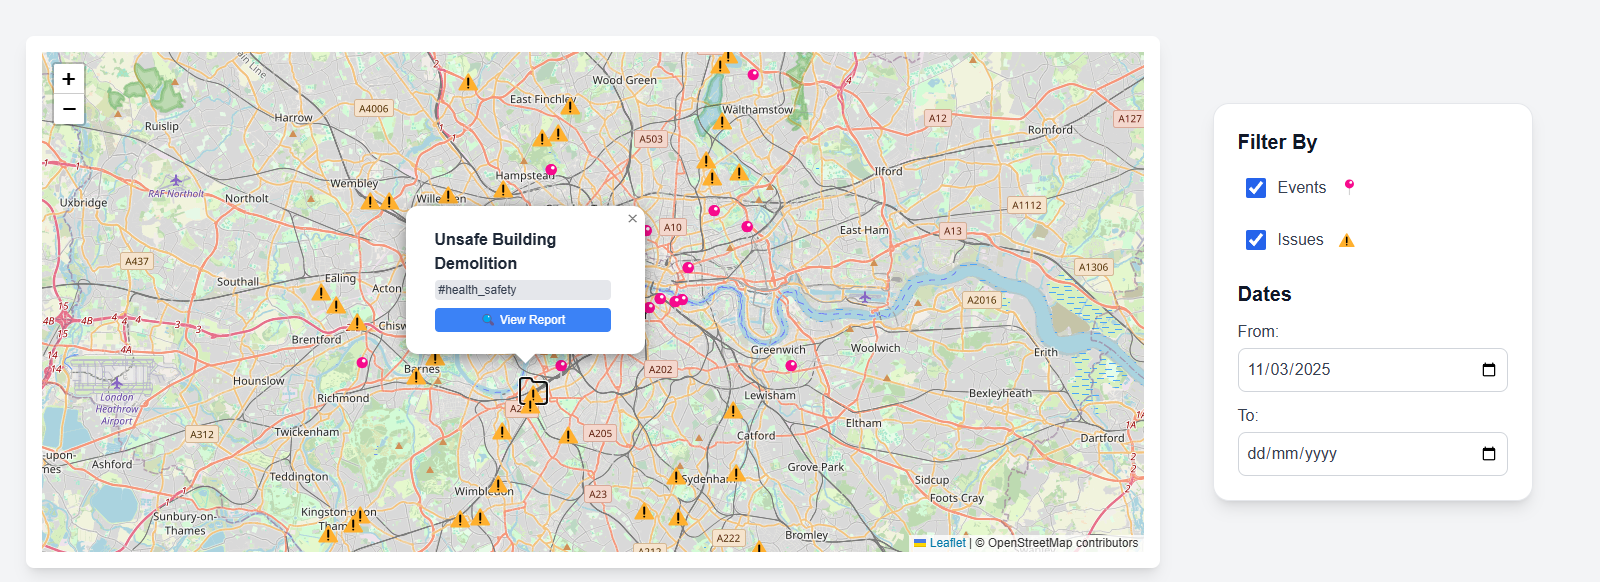
The MapComponent.jsx is a component that displays a map with markers for events and issues.
Implementation
The frontend for the map is implemented using React and the Leaflet library for rendering the map.
The key features include
| Feature | Description |
|---|---|
| Data Filtering | Filters events and issues based on user-selected filters and date ranges. Combines reports (issues) and events into a unified list of filteredItems. |
| Dynamic Markers | Displays markers with custom icons (📍 for events, ⚠️ for issues). Each marker includes a popup with details and a "View More" button which shows redirects the user to the corresponding detailed page. |
| Map Bounds | Restricts the map view within company-defined bounds using CompanyContext. |
Context and State Management
The map uses the CompanyContext to retrieve the geographical bounds of the map based on the company , e.g London City Council . This would vary for different locations (cities).
const { sw_lat, sw_lon, ne_lat, ne_lon } = useContext(CompanyContext);
The component uses the following state variables
const [filteredItems, setFilteredItems] = useState([]);
const [mapCenter, setMapCenter] = useState([51.5074, -0.1278]); // Default: London
const [zoomLevel, setZoomLevel] = useState(6); // Default zoom level
const [isContextLoaded, setIsContextLoaded] = useState(false);
filteredItems stores the filtered list of events and issues to display on the map.
mapCenter sets the initial center of the map (default: London).
zoomLevel sets the initial zoom level of the map.
isContextLoaded tracks whether the context data (bounds) is loaded.
Filtering Items
The useEffect hook filters the combined list of reports and events based on user-selected filters and date ranges
useEffect(() => {
  const validReports = reports
    .filter(report => report.latitude !== undefined && report.longitude !== undefined)
    .map(report => ({
      id: report.id,
      name: report.title,
      type: "issues",
      date: report.published_date || "Unknown Date",
      emoji: "⚠️",
      lat: parseFloat(report.latitude),
      lng: parseFloat(report.longitude),
      status: report.status,
      tags: report.tags,
    }));

  const validEvents = events
    .filter(event => event.latitude !== null && event.longitude !== null)
    .map(event => ({
      id: event.id,
      name: event.title,
      type: "events",
      date: event.date,
      emoji: "📍",
      lat: parseFloat(event.latitude),
      lng: parseFloat(event.longitude),
      status: "active",
    }));

  const filtered = [...validReports, ...validEvents].filter(item => {
    const isSelected =
      (filters.events && item.type === "events") ||
      (filters.issues && item.type === "issues" && item.status === "open");

    const isWithinDateRange =
      (!dates.from || new Date(item.date) >= new Date(dates.from)) &&
      (!dates.to || new Date(item.date) <= new Date(dates.to));

    return isSelected && isWithinDateRange;
  });

  setFilteredItems(filtered);
}, [filters, dates, reports, events]);
Rendering the map and markers
The map is rendered using the MapContainer component from the Leaflet library
<MapContainer
center={mapCenter}
zoom={zoomLevel}
style={{ width: "100%", height: "500px", zIndex: 0 }}
maxBounds={bounds} // Restrict map movement to company-defined bounds
maxBoundsViscosity={1.0}
minZoom={6}
maxZoom={15}
>
<MapResizeFix /> {/* Fixes map resize issue */}
<TileLayer
url="https://{s}.tile.openstreetmap.org/{z}/{x}/{y}.png"
attribution='© OpenStreetMap contributors'
/>
{filteredItems.map((item) => (
<Marker
key={item.id}
position={[item.lat, item.lng]} // Ensure lat/lng exist
icon={new L.DivIcon({
className: "emoji-icon",
html: `<span style="font-size: 20px;">${item.emoji || "⚠️"}</span>`,
})}
>
<Popup offset={[0, -10]}> {/* Adjusts popup position */}
<div className="p-2 w-48 text-sm">
<h3 className="text-base font-semibold text-gray-800">{item.name}</h3>
{item.tags && (
<div className="bg-gray-200 text-gray-700 text-xs font-medium px-1 py-0.5 rounded mt-1">
#{item.tags}
</div>
)}
<button
onClick={() => handleRedirect(item)}
className="mt-2 w-full bg-blue-500 text-white text-xs font-medium py-1 rounded transition-all duration-200 hover:bg-blue-600 focus:ring-2 focus:ring-blue-300"
>
🔍 View {item.type === "issues" ? "Report" : "Event"}
</button>
</div>
</Popup>
</Marker>
))}
</MapContainer>
The MapContainer sets the initial center and zoom level of the map as well as restricts the map's movement to geographical bounds set by the company (admin)
TileLayer uses OpenStreetMap tiles for rendering the map
Markers displays markers for each item in filteredItems
Each marker includes a Popupwith the items name, tags and a button to view further details
When a user clicks on the View more, after clicking a marker the redirection to the corresponding page is handled accordingly
const handleRedirect = (item) => {
  if (item.type === "issues") {
    navigate("/reporting", { state: { selectedIssue: item } });
  } else {
    navigate(`/events/${item.id}`);
  }
};
Map filters
The map filters implementation, which allows users to filter events and issues by date is shown below
<label>
  <input
    type="checkbox"
    name="events"
    checked={filters.events}
    onChange={handleCheckboxChange}
  />
  Events 📍
</label>
<label>
  <input
    type="checkbox"
    name="issues"
    checked={filters.issues}
    onChange={handleCheckboxChange}
  />
  Issues ⚠️
</label>
<input
  type="date"
  name="from"
  value={dates.from}
  onChange={handleDateChange}
/>
<input
  type="date"
  name="to"
  value={dates.to}
  onChange={handleDateChange}
/>
The data for events and issues is fetched from the backend and passed via props to the MapComponent via the HomePage.jsx
 useEffect(() => {
    const fetchData = async () => {
      try {
        const token = localStorage.getItem("token");
        const headers = token ? { Authorization: `Bearer ${token}` } : {};

        const [reportsResponse, eventsResponse] = await Promise.all([
          axios.get(import.meta.env.VITE_API_URL + "reports/", { headers }),
          axios.get(import.meta.env.VITE_API_URL + "events/", { headers }),
        ]);

        if (reportsResponse.status === 200) {
          setReports(reportsResponse.data);
        }
        if (eventsResponse.status === 200) {
          setEvents(eventsResponse.data);
        }
      } catch (error) {
        console.error("Error fetching data:", error);
      }
    };

    fetchData();
  }, []);
Below shows the events and issues (reports) being passed as props to the MapComponent which then dynamically displays these on the map
   <MapComponent
            filters={filters}
            dates={dates}
            reports={reports}
            events={events}
          />