Our client is The International Federation of Red Cross and Red Crescent Societies (IFRC) is a humanitarian organization founded in 1919 to provide assistance to people affected by natural disasters, conflicts, and health emergencies. The IFRC is composed of 192 member National Societies, which work together to support and empower vulnerable communities around the world. The organization's mission is to alleviate human suffering, protect life and health, and promote respect for human dignity. Our primary stakeholders for this project are Justin Ginetti(Risk Analyst at IFRC) and Jenny Paola Yela Bello(Data Scientist at IFRC).
Project background and partner introduction
Project Goals
Our client requires impact exceedance curves and tables for multiple impacts based on observational data from national disaster loss databases such as DesInventar and EM-DAT, as well as other sources. The model should be able to automatically update based on the availability of new data, and be applicable to as many Red Cross/Red Crescent National Societies as possible. The project is aimed at enabling National Societies to allocate funding for anticipatory action towards natural hazards that occur more frequently, with a 5-year return period.
Goals:
- Generating loss exceedance curves and tables for floods, storms, and earthquakes
Requirements Gathering
The initial requirements provided by the problem sheets were confusing, as we were unfamiliar with all the technical jargon associated with the disasters, as such we scheduled a call with our client to get a better understanding.
To ensure effective use of the meeting we wrote a few questions for our client as well as did some research on the topic, so we could communicate our understanding of the topic. We chose a video interview, to gather requirements so we can clarify parts which we do not understand, furthermore the interaction is more personalized so we could understand our client better.
Here is a list of questions we asked for one of our initial meetings:
There are APIs provided by DesInventars, make the most use of it to get data needed.
The intended audience for the project will primarily be IFRC software engineers. These engineers will integrate graphs and tables into the IFRC GO platform, which will aid decision makers in their efforts. Once the outcomes have been uploaded to the website, both IFRC personnel and government officials will benefit from the insights gained through your work.
- More effective allocation of funding: By producing impact exceedance curves based on observational data, the IFRC will be better able to allocate its Disaster Relief Fund to areas that are most at risk from natural disasters. This will help ensure that the funding reaches the areas that need it the most, and that it is used in the most effective way possible.
- Anticipating the impact of future events: The impact exceedance curves will help the IFRC to anticipate the impact of future natural disasters, allowing them to take proactive measures to mitigate the effects of these events. This will help reduce the impact of natural disasters on vulnerable communities, and may even help prevent some disasters from occurring altogether.
- Open-source model for risk analysis: By making the model open-source, all national societies will be able to access and use it to improve their disaster response and reduce the impact of natural disasters on vulnerable communities. This will help build resilience in vulnerable communities, and may even save lives in the event of a natural disaster.
The project will deliver a thoroughly documented code package, complete with easily accessible APIs, designed to generate Loss Exceedance Curves and Tables.
To begin the project, it's best to establish a development plan as a team and allocate time for each component. It's important to understand the terminologies, such as "loss exceedance curves" and “return periods”, then conduct research on similar projects. Also, examining the datasets is crucial to determine their quality and decide on any necessary adjustments to prepare them for analysis.
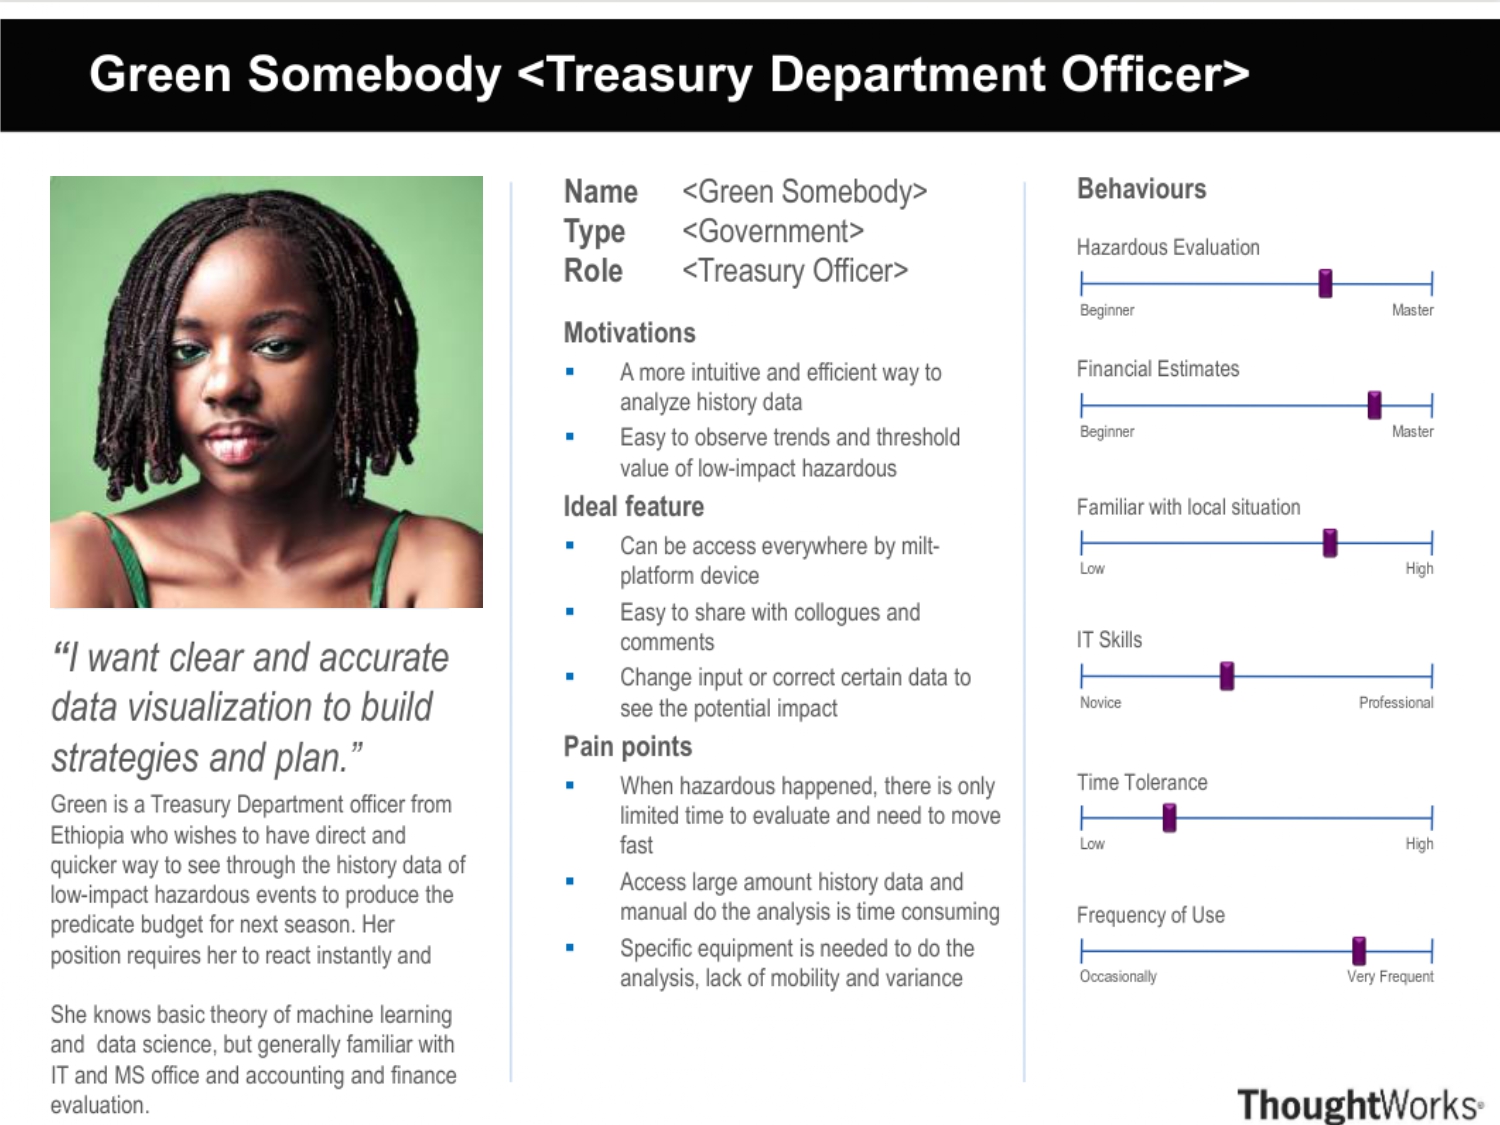
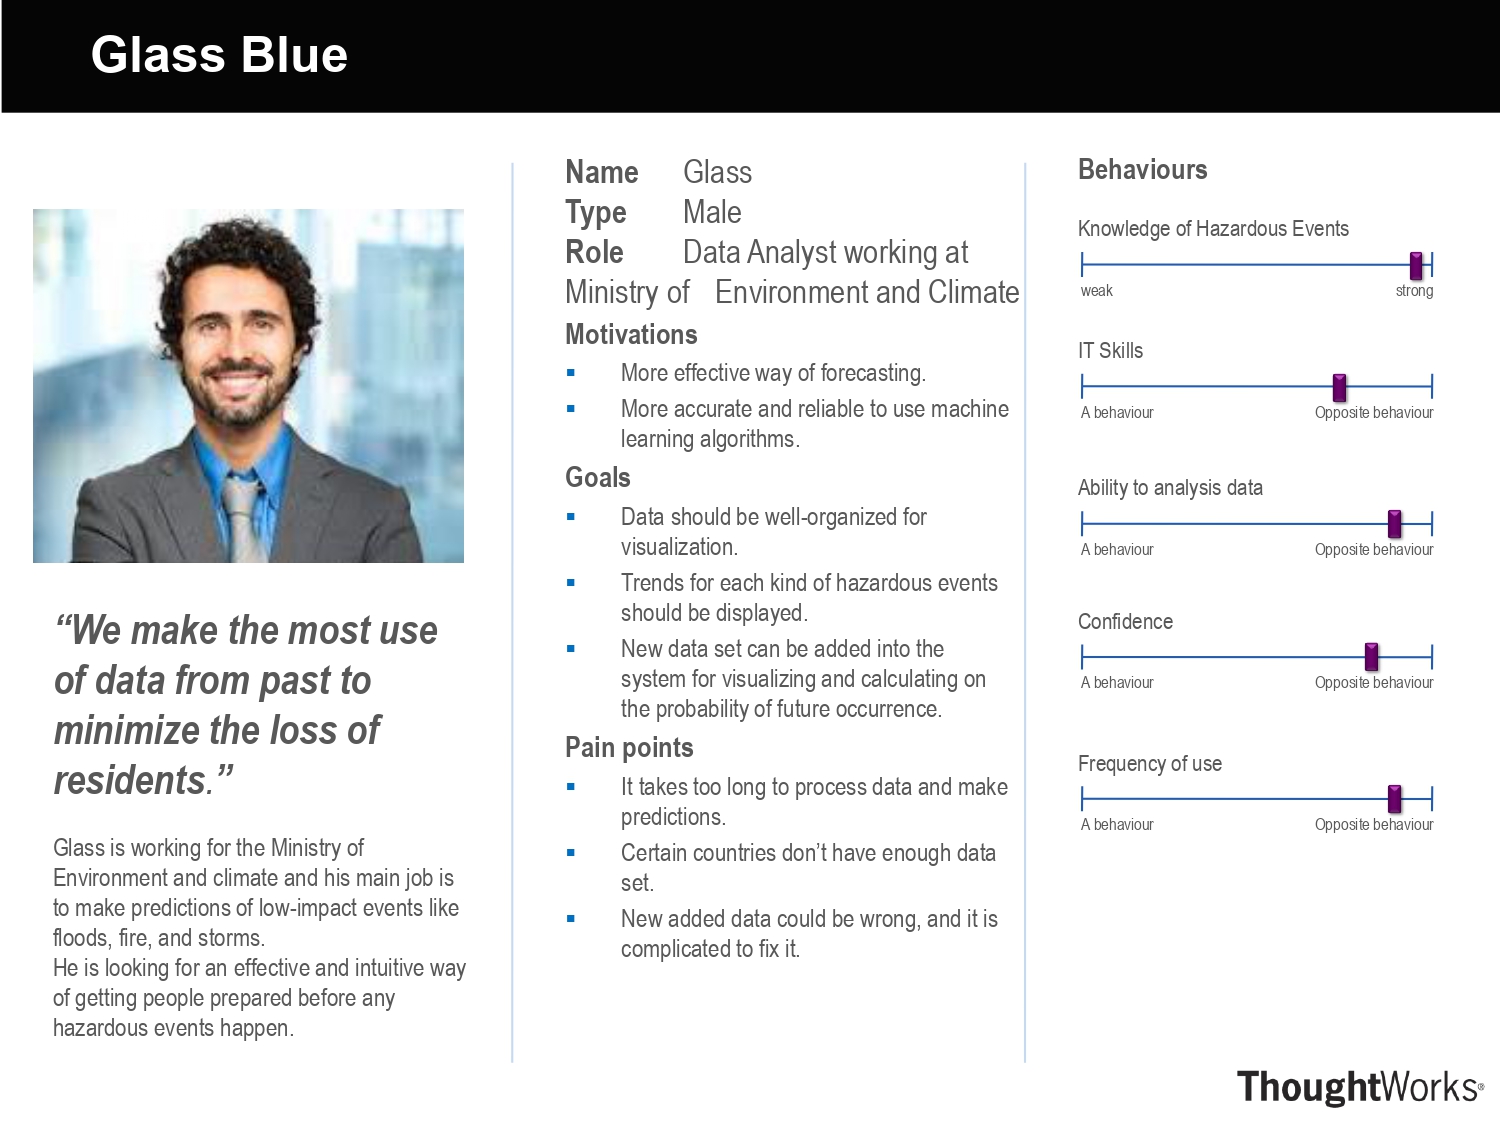
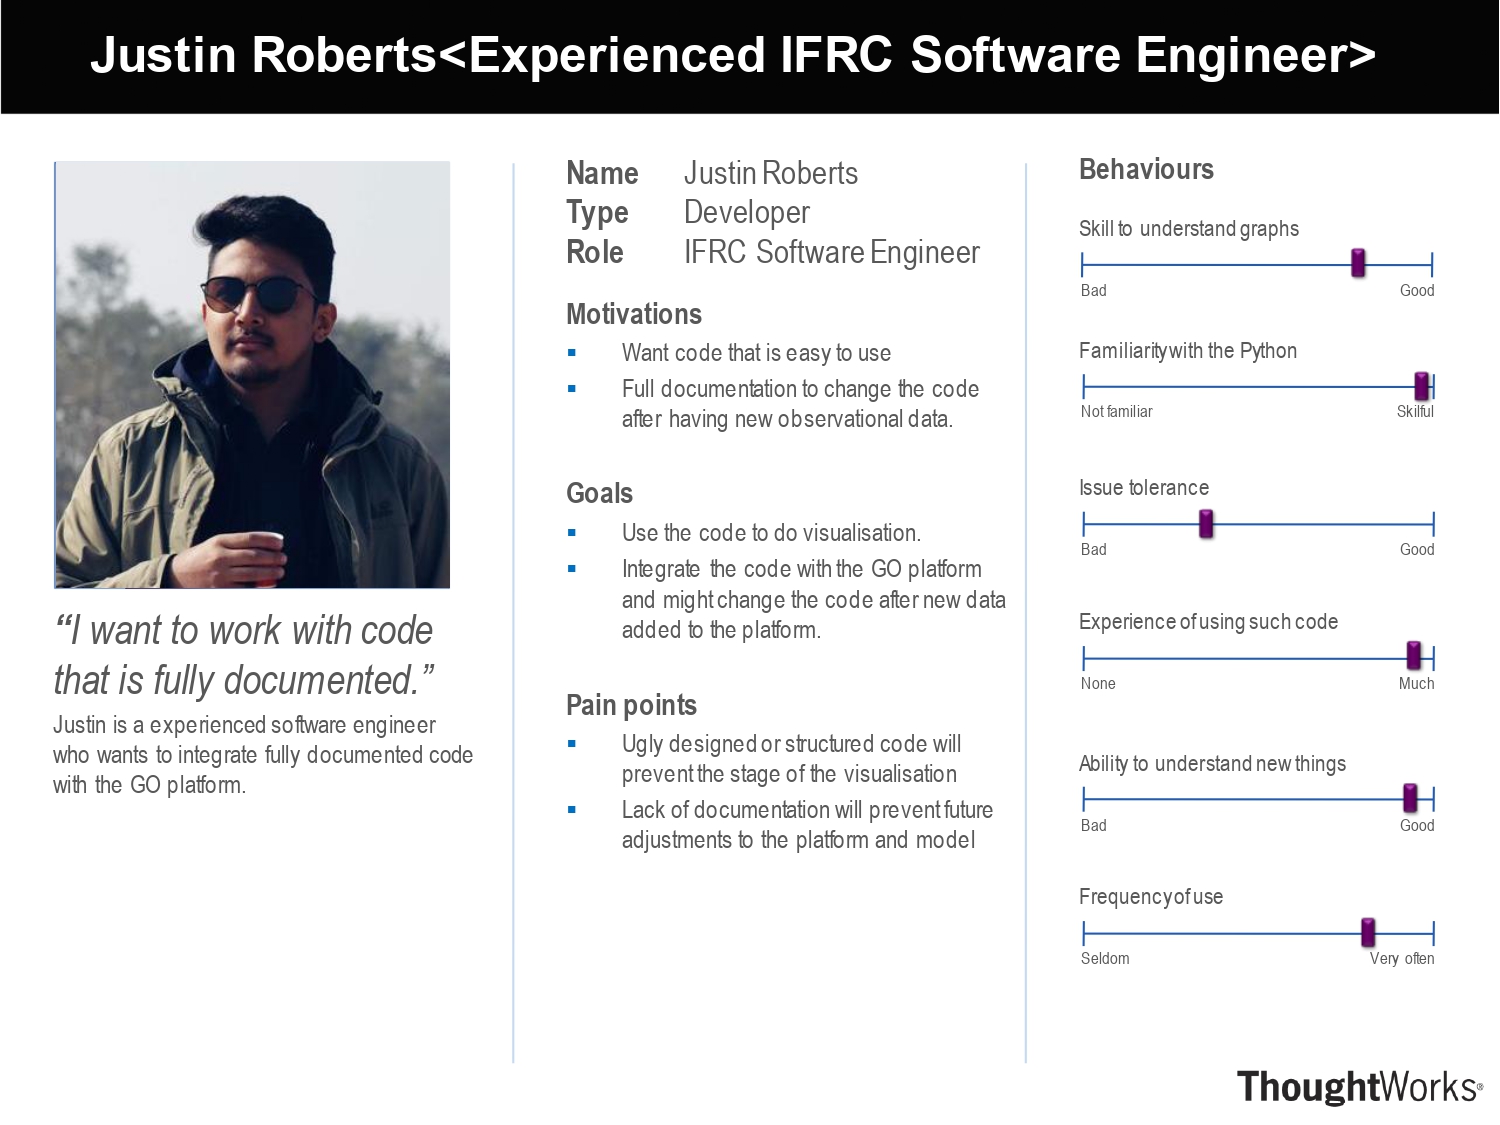
Personas
Persona 1

Persona 2

Persona 3

Persona 4

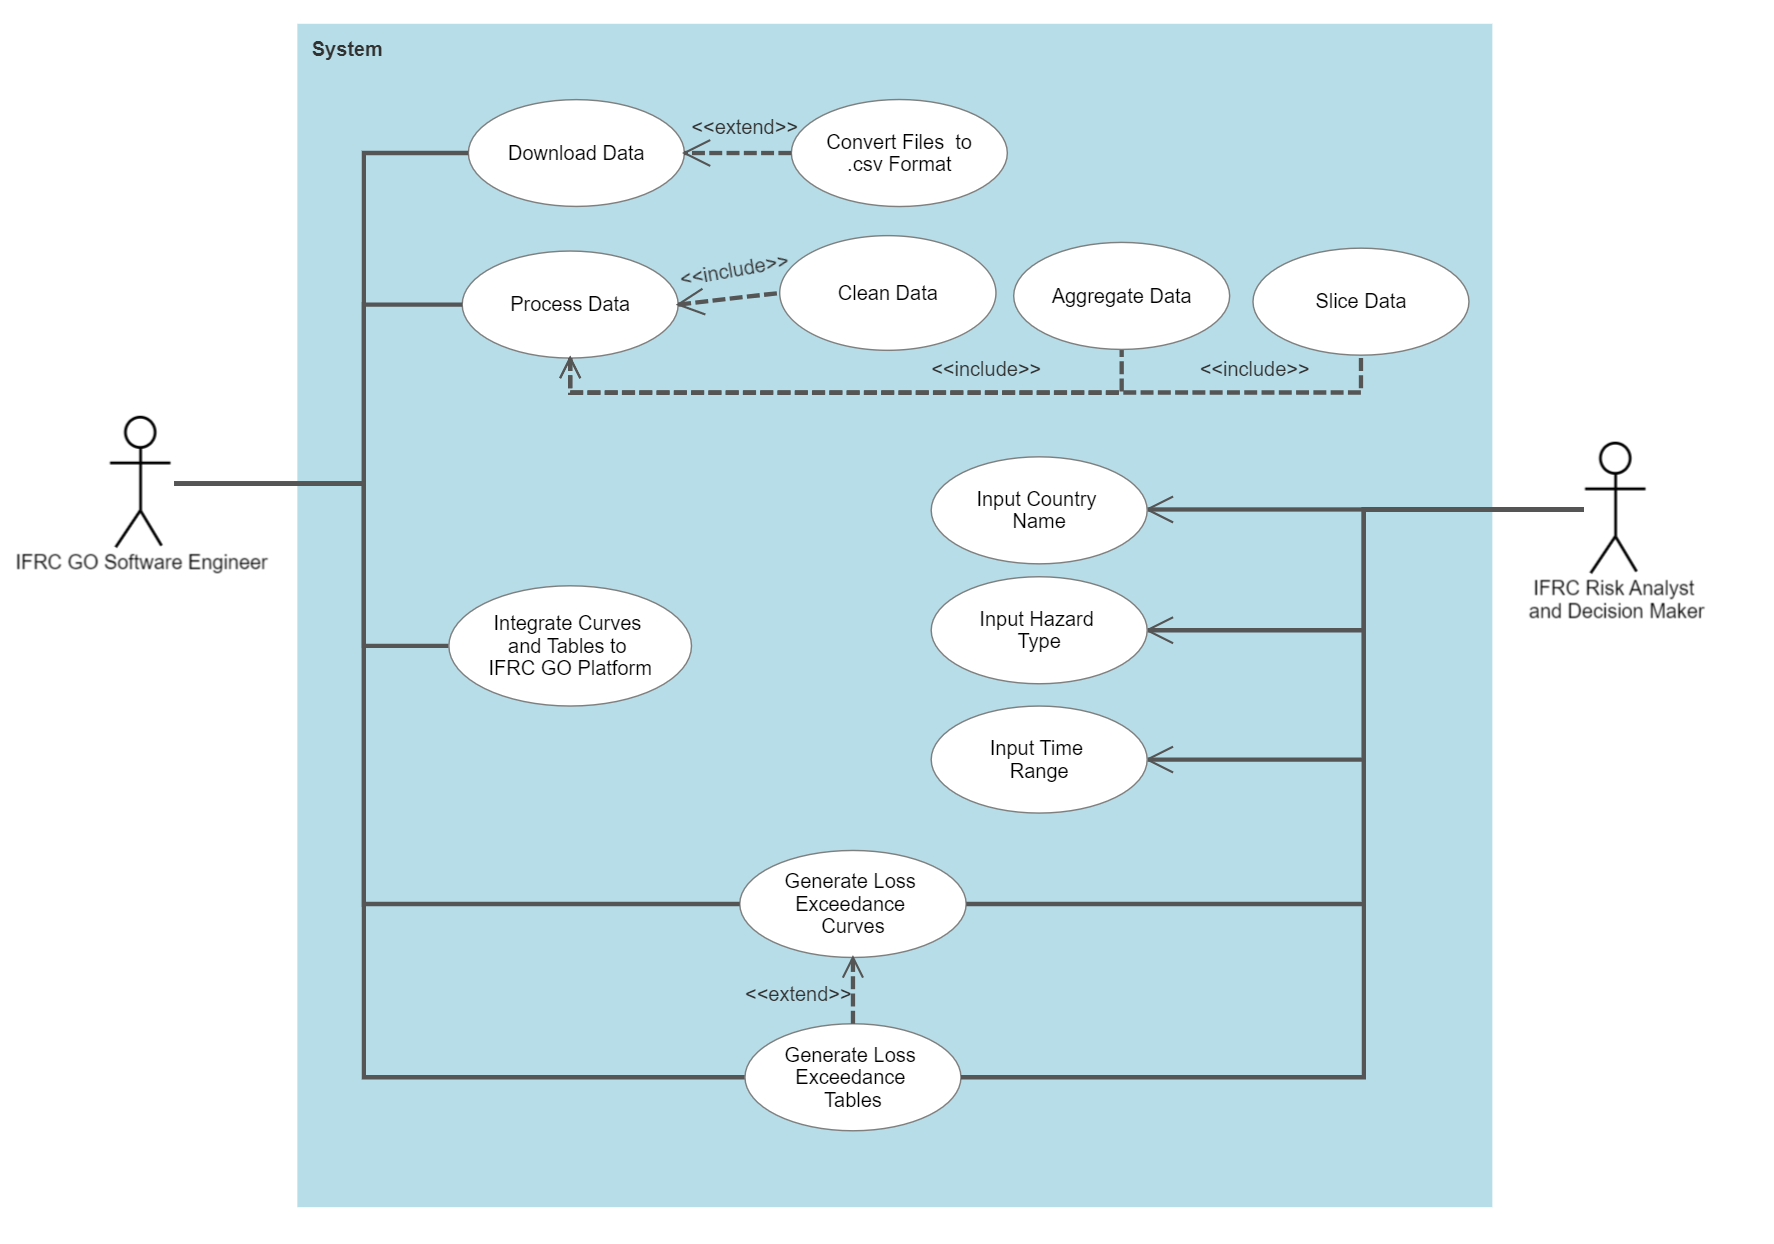
Use Cases

List of Use Cases
| ID | Use Case for User |
|---|---|
| UCU1 | Downloading Data |
| UCU2 | Processing Data |
| UCU3 | Generating Loss Exceedance Curves |
| UCU4 | Generating Loss Exceedance Tables |
Use Case Description
| Use Case | |
|---|---|
| ID | UCU1 |
| Actor | IFRC Software Engineer |
| Description | Downloading Data from DesInventar and Converting it to csv files |
| Main Flow |
|
| Result | Datasets downloaded and converted to csv format |
| Use Case | |
|---|---|
| ID | UCU2 |
| Actor | IFRC Software Engineer |
| Description | Processing Datasets into Wanted Shape |
| Main Flow |
|
| Result | Datasets cleaned, aggregated, and sliced |
| Use Case | |
|---|---|
| ID | UCU3 |
| Actor | IFRC Software Engineer / Risk Analyst and Decision Maker |
| Description | Generating Loss Exceedance Curves |
| Main Flow |
|
| Result | Loss exceedance curve genreated |
| Use Case | |
|---|---|
| ID | UCU4 |
| Actor | IFRC Software Engineer / Risk Analyst and Decision Maker |
| Description | Generating Loss Exceedance Tables |
| Main Flow |
|
| Result | Loss exceedance tables genreated |
Actors
IFRC Risk Analysts and Decision Makers
When a low-impact high frequency event occurs, the IFRC Risk Analysts and Decision Makers will need to allocate resources for the event depending on the impact. To evaluate its impact, the IFRC will use our graphs to determine what the maximum impact could be for this event. Depending on this and the status quo of the event, they will allocate funds and all need based requirements for the communities to thrive again.
IFRC Go Software Engineer
The software engineers will be integrating our model to the GO platform, this will ensure the information produced by our model is open-source and fully available to anyone who needs access to it. We have provided all the documentation needed for the engineers to use our models, as such they would not have to make changes to our codebase to integrate it.
MoSCow List
Functional Requirements
| ID | Requirements | Priority |
|---|---|---|
| 1 | Automatically download data from DesInventar | Must have |
| 2 | Convert xml files to csv files for analysis | Must have |
| 3 | Categorise hazards and combine sub-types of floods, storms and earthquakes | Must have |
| 4 | Decide rules to exclude any unreliable data due to report bias | Must have |
| 5 | Slice datasets based on the rules | Must have |
| 6 | Validate data to make sure each event only got include once | Must have |
| 7 | Loss exceedance table generator | Must have |
| 8 | Loss exceedance curve generator | Must have |
| 9 | Completed API for GO platform Frontend Developers | Must have |
| 10 | Clear Documentation | Must have |
| 11 | Highlight significant points of loss exceedance curves | Should have |
| 12 | Users can choose which countries and events they want to generate data for | Should have |
| 13 | Robust error handling for our system | Should have |
| 14 | Users can adjust the slicing rule of the data as well | Could have |
| 15 | Users have the option of setting a time range as well | Could have |
| 16 | Users can input other datasets to generate curves and tables | Could Have |
| 17 | User Interface is not needed as it is a tool for frontend | Won't Have |
Non-Functional Requirements
| ID | Requirement | Priority |
|---|---|---|
| 1 | Clear Documentation must be provided, both in-code and external | Must Have |
| 2 | The tool must be easy to understand for developers | Must Have |
| 3 | Extendability: the tool must be easily extensible and adaptable to changing needs and requirements | Must Have |
| 4 | Maintainability: Maintainability of the tool must be high, as it is easy to maintain and update | Must Have |