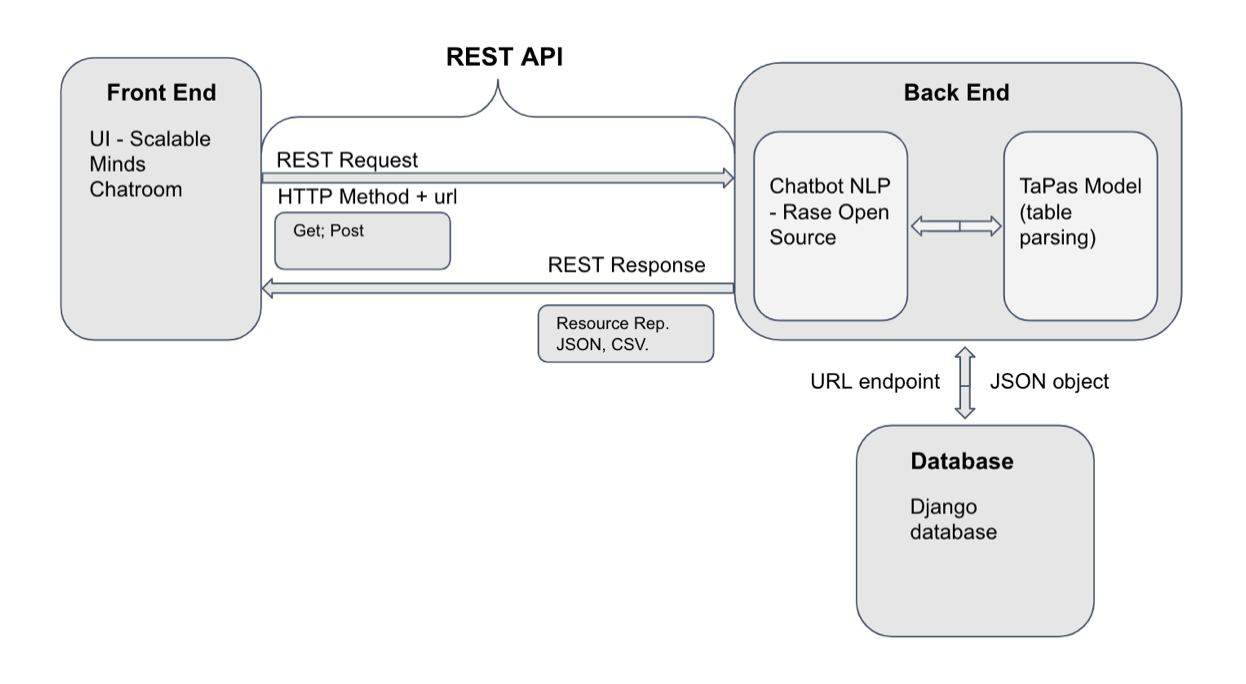
The front end contains the chatbot user interface, Scalable Minds Chatroom UI, where the user uploads their data and begins a conversation. RESTful API acts as the bridge between the backend and the frontend, sending Rest requests and responses back and forth.
In the back end, the Rasa NLU server has an exposed endpoint which is stated in the Chatroom widgets for connection. Communication between the front end UI and the back end Rasa server is done through RESTful API, where user inputs are sent through POST request so that the server receives and returns its message response in the form of JSON.
Moreover, our back end contains primarily the TaPas model, pre-trained on 6.2 million tables where it learns to answer natural language questions from semi-structured tables using semantic parsing. When the Rasa server detects that the user is asking a question, it will trigger the custom action to send the data and question received to the TaPas model for analysis and inference.
We have an additional post processing pipeline, where the Django database is contained. The database holds the relevant data needed to facilitate post-processing. Before the backend sends the predicted answer to the front end, it first cross-checks the type and range of the response to filter off incorrect information.
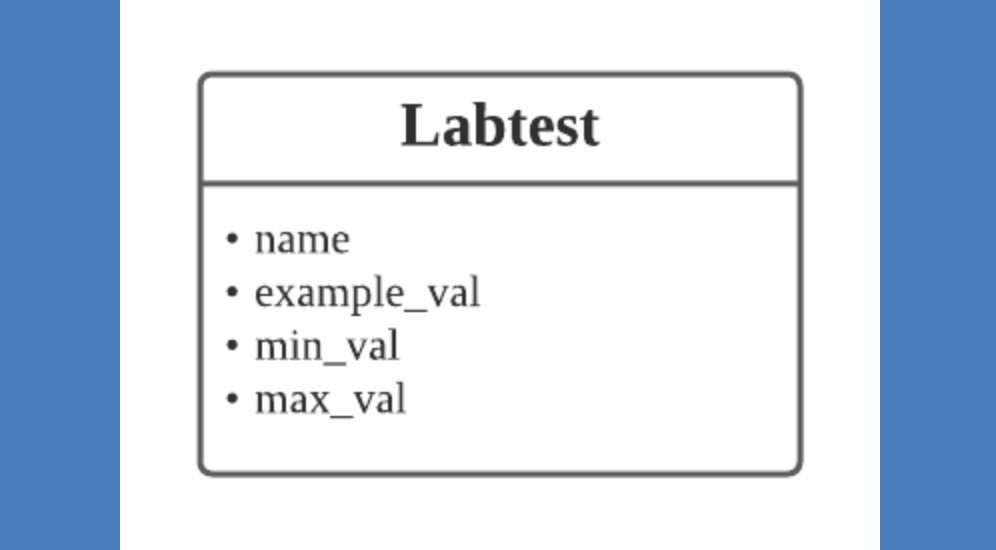
To support our post-processing pipeline, we created a database in Django to store possible tests and their respective example values and range information if applicable. This is for us to retrieve the database and cross-check the returned answer of TaPas to ensure its accuracy and reliability.
We have a model in our database called ‘Labtest’, where each object instance represents one test and their related information. The details of each entity is as shown below:
A diagram illustrating the model is attached below: