Testing Strategy
To ensure that the calibration process and projection modes are working as they should, the team members tested their features as they were developed. During the two integration phases of the project (first when integrating our projection modes, second when integrating the calibration process), we conducted tests on our utility classes. For example, for the Settings Access class, we conducted tests to verify that writing and reading from the JSON files for the general and mode-specific settings followed the expected behaviour.
Calibration was also tested by Team 34 who relied on our calibration system to project onto wall corners for their Stellar Cartography system. In addition to this, we undertook performance testing to investigate the system’s performance with respect to time and memory efficiency. User acceptance testing was carried out by developing tests related to the system setup and the projection modes. We collected feedback from 3 testers.
Performance Testing
The cProfile library in Python has been used to measure the running time for each projection mode. The performance testing has been conducted on a machine with the following specifications: Intel Core i5-8300H CPU @ 2.30GHz, 4 Core(s), 16GB RAM, Graphics card: Intel's UHD Graphics 630 and Nvidia's GeForce GTX 1050.
Frame Rate for Initialising & Running Each Projection Mode
The table below shows the time taken to initialise each projection mode as well as the frame rate for running the mode for 100 frames. Besides the time taken, the number of function calls (requests made to perform the predetermined function) and primitive calls (non-recursive function calls) are also defined.
| Mode | Initialise mode | Running time for 100 frames | FPS | Notes |
|---|---|---|---|---|
| Blur | 885 function calls (860 primitive calls) in 0.252 seconds | 2705 function calls in 6.683 seconds | 14.96 | |
| Speed Blur | 931 function calls (906 primitive calls) in 0.252 seconds | 372800 function calls (371400 primitive calls) in 23.103 seconds | 4.33 | There are many function calls made since Pytesseract’s image_to_string function is used to read the speed from an image of the speedometer. |
| Low Health | 1030 function calls (1005 primitive calls) in 0.560 seconds | 5805 function calls in 9.252 seconds | 10.81 | |
| Wobble (triggering for loud sounds) | 1071 function calls (1043 primitive calls) in 5.139 seconds | 686 function calls in 5.557 seconds | 18.00 |
Initialisation takes longer than other modes as the frames for the wobble animation are pre-generated. Running time is measured for when the animation is continuously running (due to a sound threshold of zero). In real-life use, the animation will only be triggered for loud sounds and show a static image of the room for the remaining time so the FPS would be much higher (as the static cartoon has a high FPS). |
| Cartoon | 908 function calls (883 primitive calls) in 0.280 seconds | 801 function calls in 1.862 seconds | 53.71 | Since cartoon only shows a single static image, the frame rate is high. |
| DisplayImage | 888 function calls (863 primitive calls) in 0.263 seconds | 701 function calls in 0.938 seconds | 106.61 | Displays any static image. |
| Snow | 929 function calls (902 primitive calls) in 0.250 seconds |
Light: 447275 function calls in 6.243 seconds Medium: 1040591 function calls in 6.537 seconds Harsh: 1633685 function calls in 6.892 seconds |
Light: 16.02 Medium: 15.30 Harsh: 14.51 |
FPS is much lower than the Rain mode as settling snow must be added to each frame. |
| Rain | 974 function calls (947 primitive calls) in 0.252 seconds |
Drizzle: 102458 function calls in 1.240 seconds Heavy: 591178 function calls in 1.457 seconds Torrential: 844251 function calls in 1.591 seconds |
Drizzle: 80.65 Heavy: 68.63 Torrential: 62.85 |
|
| Weather | 520208 function calls (496101 primitive calls) in 1.350 seconds | 885887 function calls (879887 primitive calls) in 7.359 seconds | 13.59 |
Initialisation: many function calls for the Weather mode as the neural network model associated with weather classification is loaded using Keras when initialising. Running time: many more function calls as each frame in the captured display must be processed and passed to the model to receive a prediction. |
Performance Over Time
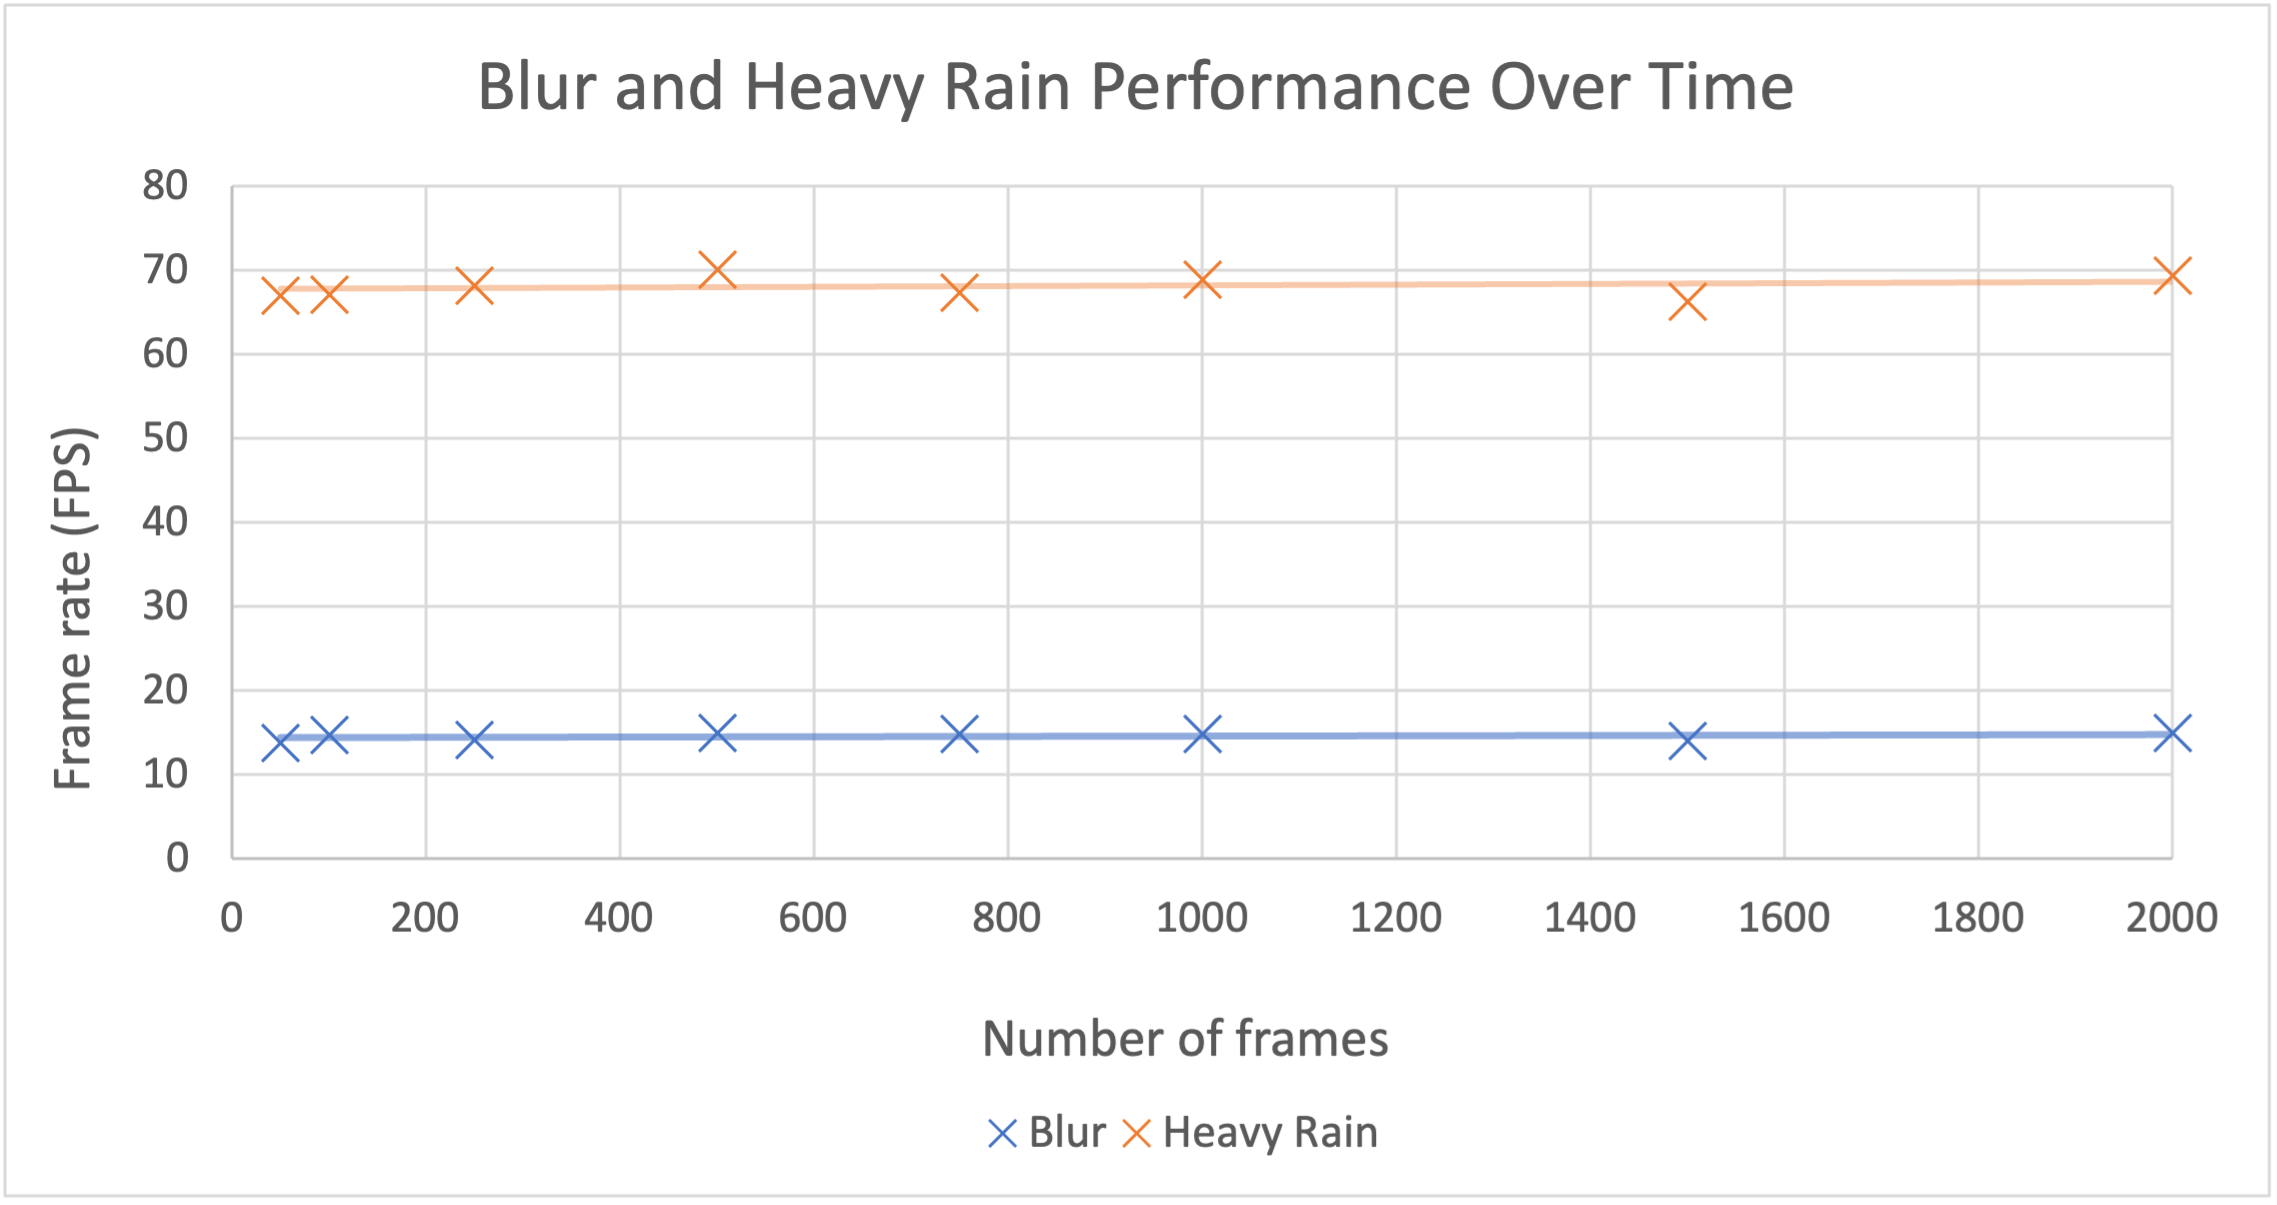
Since we intended the system to be used while the user is playing a game or watching a film, it was necessary for us to measure its long-term performance. We monitored the performance of Blur and Rain (with the heavy rain setting) to find the relationship between the number of frames and the frame rate.
| Num. of frames | Running time for Blur | FPS for Blur | Running time for Heavy Rain | FPS for Heavy Rain |
|---|---|---|---|---|
| 50 | 1355 function calls in 3.612 seconds | 13.84 | 298807 function calls in 0.746 seconds | 67.02 |
| 100 | 2705 function calls in 6.740 seconds | 14.84 | 590865 function calls in 1.489 seconds | 67.16 |
| 250 | 6755 function calls in 17.570 seconds | 14.23 | 1468155 function calls in 3.662 seconds | 68.27 |
| 500 | 13505 function calls in 33.314 seconds | 15.01 | 2930591 function calls in 7.128 seconds | 70.15 |
| 750 | 20255 function calls in 50.323 seconds | 14.90 | 4392662 function calls in 11.127 seconds | 67.40 |
| 1000 | 27005 function calls in 67.045 seconds | 14.92 | 5854109 function calls in 14.502 seconds | 68.96 |
| 1500 | 40505 function calls in 106.508 seconds | 14.08 | 8778589 function calls in 22.614 seconds | 66.33 |
| 2000 | 54005 function calls in 133.449 seconds | 14.99 | 11703656 function calls in 28.788 seconds | 69.47 |
These results have been plotted to produce the graph below. From the graph, the frame rate is constant as the number of frames increases for both of the projection modes. This indicates that our system is stable regardless of the duration it is being used for.
Memory Usage
We determined the memory usage when the user continuously switched between the projection modes: blur, snow, low health, cartoon, rain. In the span of 140 seconds, the modes were switched 12 times. Python’s Memory Profiler package was used to graph the memory usage while running the application. The memory usage was measured on a device with the following specifications (since testing took place on the uncompiled build, we were able to test using a macOS device as UCL Open-Illumiroom V2 is compatible with macOS): MacBook Air M1 chip, 8 Core(s), 16GB RAM, 256GB SSD.
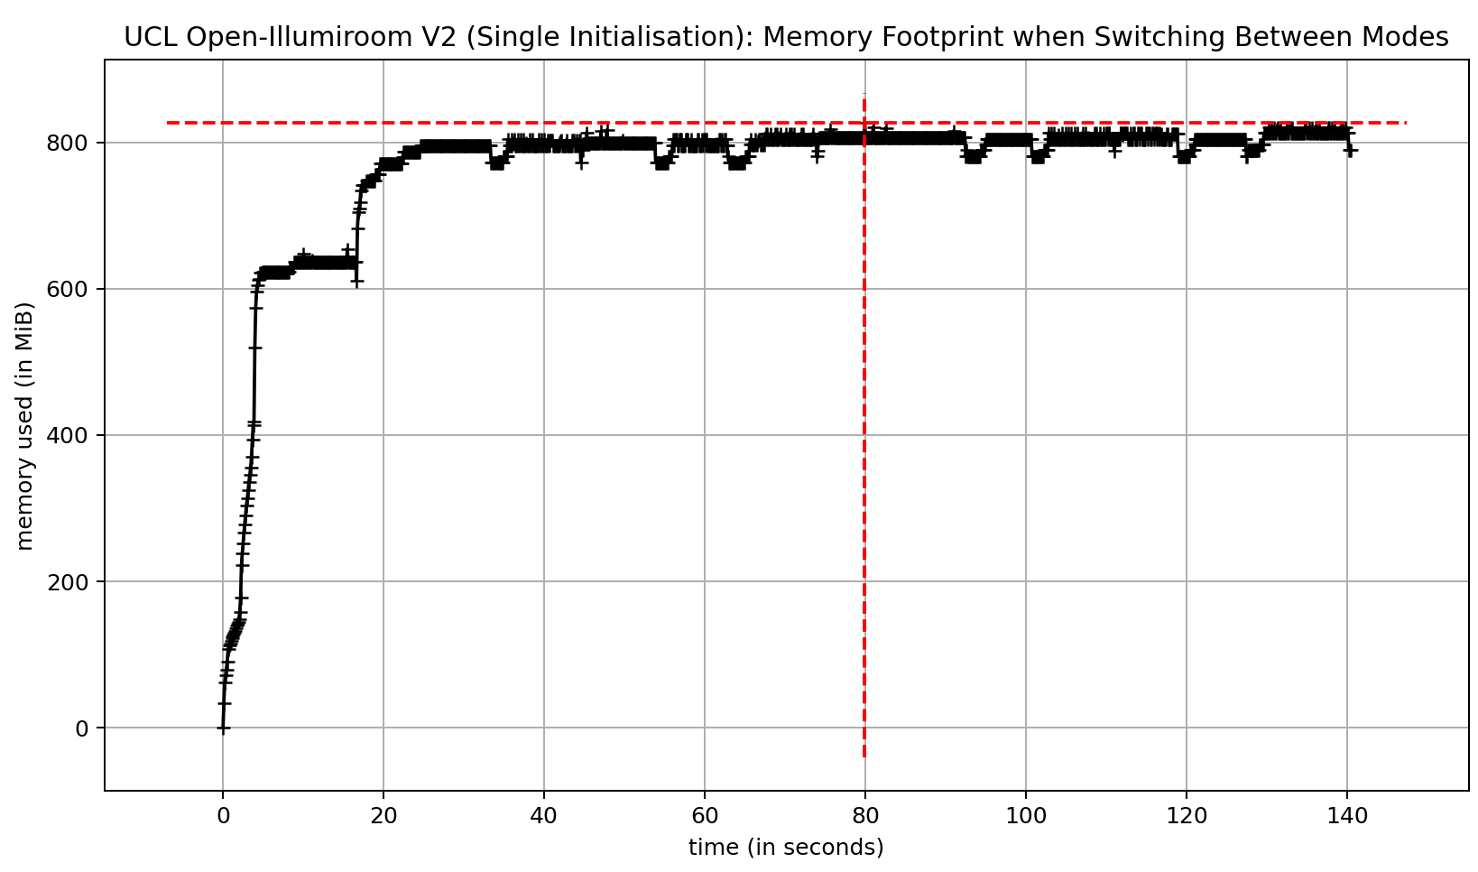
The graphing for the memory usage has been performed in the following conditions: the main system is initialised and then the mentioned modes are iterated over. For this reason, the memory increase at the beginning is due to the initialisation of utility object such as instances of SettingsAccess, DisplayCapture and so on. Under the conditions mentioned above, these objects are maintained in memory as they will be used again in the same runtime.
In the latest implementation of UCL Open-Illumiroom V2, the MFC re-starts the entire application each time the user switches between the projection modes. Therefore, the entire system, including the utility classes, must be re-initialised each time which will cause the graph above to dip and rise continuously 12 times, though the total memory used would still be capped by the same amount. This is time-consuming and should be resolved in the future as it is expected that the user will switch between the projection modes during every use of the application.
User Acceptance Testing
The main use of the system is to increase immersion during gaming and watching TV-based entertainment. Therefore, we tested our program with 3 students as users by having them independently set-up the system and launch all the projection modes. All of them had some level of experience playing console games. The testers are disclosed below, under an alias.
| Tester ID | Tester Name | Tester Details |
|---|---|---|
| 1 | Mark | 20, Computer Science student |
| 2 | Sanya | 18, Politics student |
| 3 | Laurel | 22, Design Engineering student |
System Setup
The table below outlines our test cases and the user feedback for the hardware and software setup, including the system calibration. Each tester was given a copy of our User Manual and could utilise the instructions provided by the system.
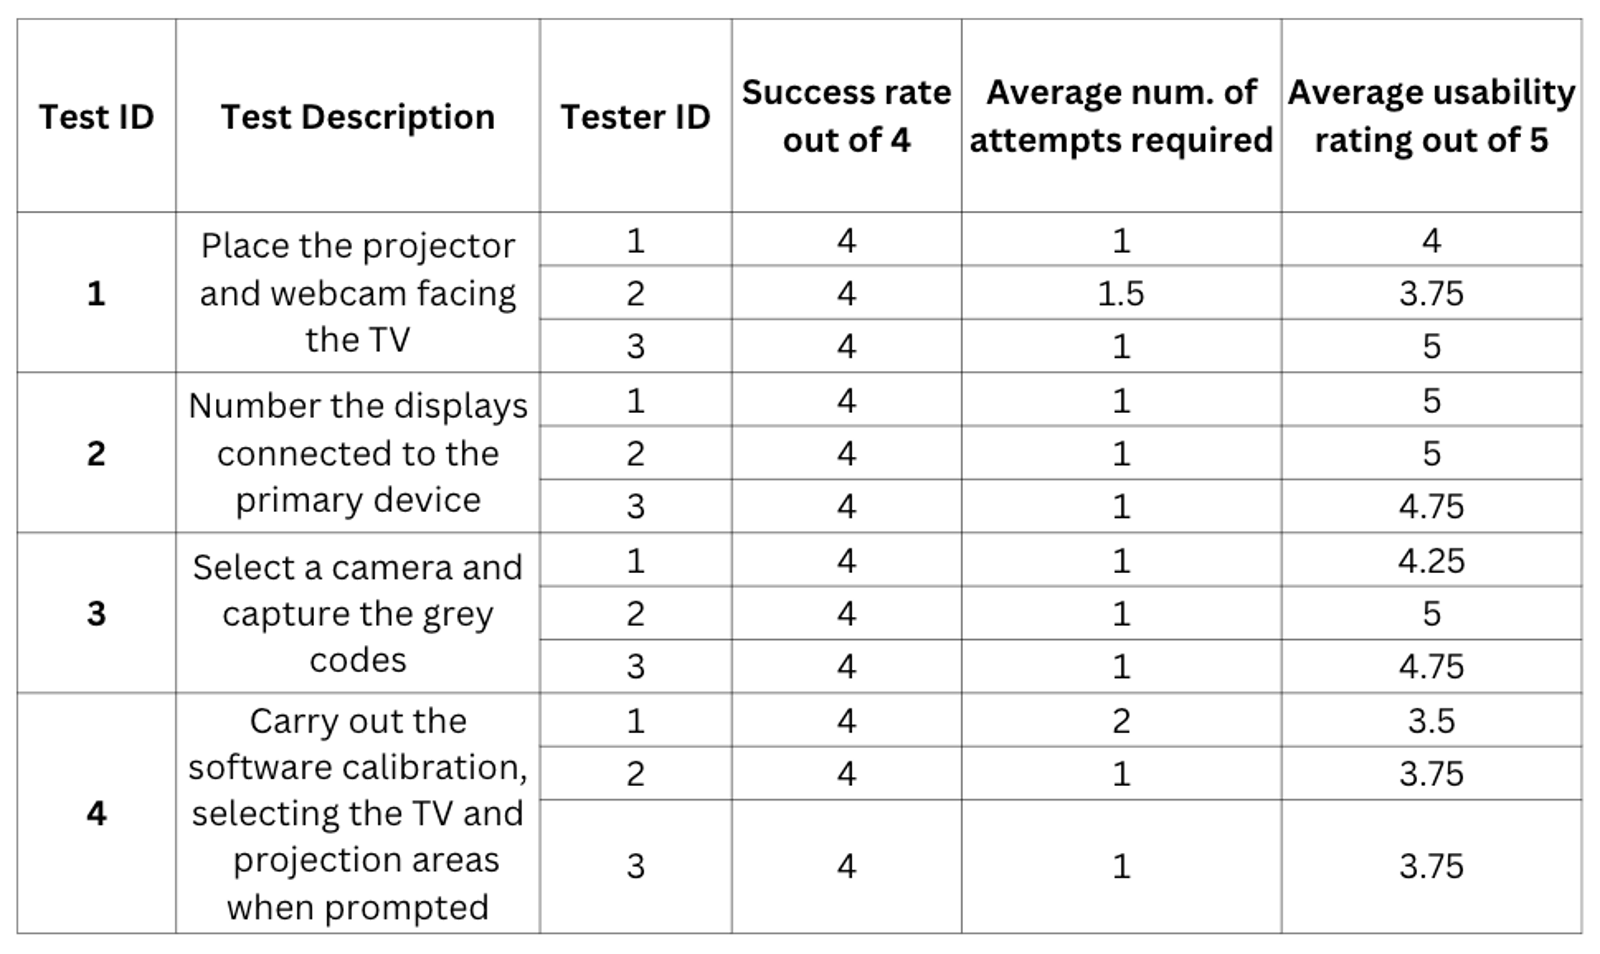
During the testing process, the most significant feedback was that the testers all found it frustrating to have to re-start the entire calibration process if they had input something incorrectly. To resolve this issue, checkpoints could be added in the future to separate test IDs 3 and 4. Overall, all the testers were satisfied with the duration of the system setup, completing the software setup in less than 1 minute.
Running the Projection Modes
We also tested the user’s experience for each projection mode. The mode IDs are defined as follows:
- Blur
- Speed Blur
- Low Health
- Wobble
- Snow
- Rain
- Weather
The table below outlines the test cases and the user feedback for each mode. These tests were carried out in the optimal conditions for our system: low lighting, many irregular objects around the TV, a place for the projector to face the TV.
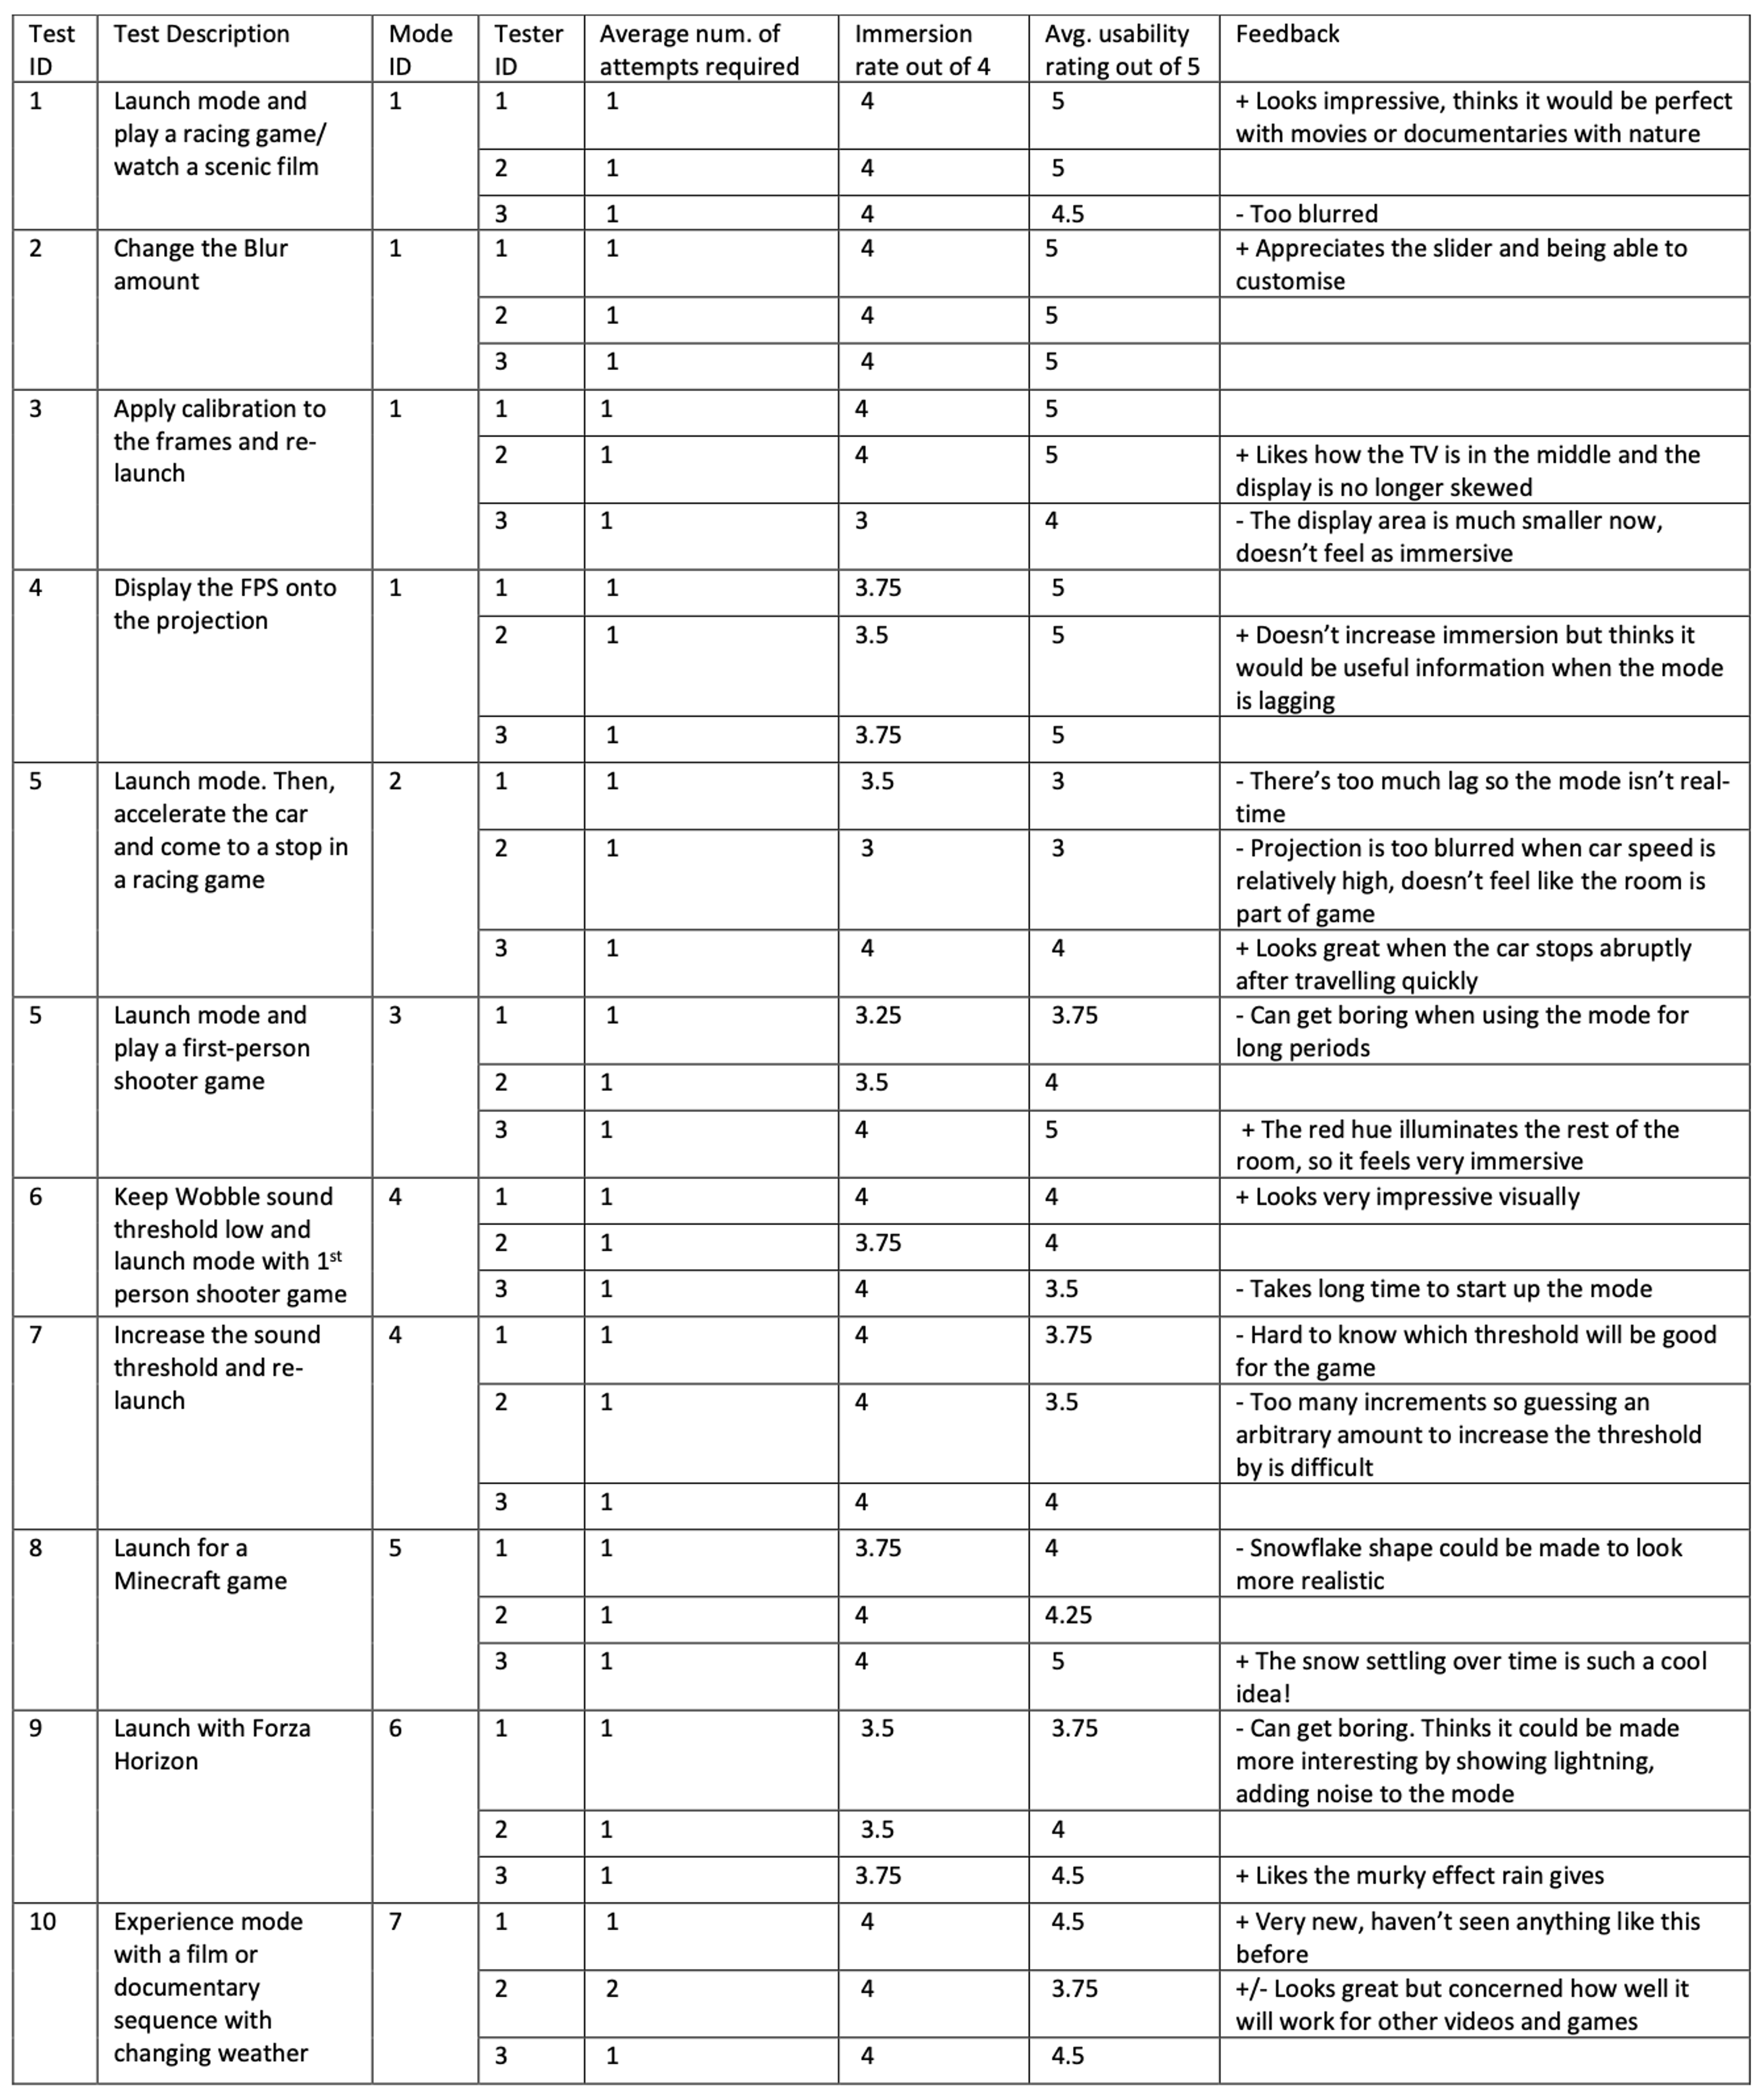
For the Wobble mode, in the future, the complications which arise from manually selecting a sound threshold could be overcome by comparing the loudness of the detected audio against a stored audio file. Other than this, testers mainly commented on the latency of starting up the modes. Since at each launch of the mode, all utility objects are reinstantiated, the time taken to initialise the modes is much longer than it could be.
System Refinement
After conducing our testing, we spent some time fixing critical bugs which we had found during testing. These had occurred due to insufficient exception handling and user input validation. The exact bugs we identified and fixed are as follows:
| ID | Bug Description | Priority | State |
|---|---|---|---|
| 1 | During display selection and TV selection in calibration, if the windows are closed without receiving user input, the application crashes as subsequent functionalities rely on this information. | Major | ✓ |
| 2 | For the Cartoon mode, if a generated image already exists in the assets folder, this image is used by default even if the image of the projection area changes. | Major | ✓ |
| 3 | For the Low Health mode, on the rare occasions that the captured frame contains too much red, this mode crashes. | Major | ✓ |
In addition to this, we also incorporated state tracking to our system setup based on the feedback we had received from the User Acceptance Testing. If the user successfully completes the hardware setup (Gray-Code pattern capture) but is unsuccessful in the software calibration (due to an invalid input etc.), they can re-start the calibration from the MFC. Instead of taking them through the entire hardware setup again, they are able to proceed to the software calibration directly. This provides an improved UX experience.
Feedback from Experts
Project Partners
We received feedback from our partners Prof Dean Mohamedally (UCL) and Prof Lee Stott (Microsoft) throughout the project timeline. In particular, we appreciated Prof Lee Stott’s insights into how teams within Microsoft were reacting to our system following the release of an internal newsletter about our work. For example, a ChatGPT team suggested integrating ChatGPT with the system to derive additional real-time insights, around a display screen, in team meetings. The idea of extending the system for data analytics purposes is being investigated this summer.
Through the numerous demonstrations we performed during the development cycle, we also gained feedback from the likes of Costas Stylianou, the Senior Technical Specialist for Health & Life Sciences at Intel. He saw live demos of our Blur, Snow and Rain modes and was equally impressed by a pre-recorded demo of our Wobble mode.
Microsoft's Imagine Cup UK 2023
In February, we entered Microsoft’s annual Imagine Cup competition with our project, being the only group out of the 35+ teams in the cohort to do so. In the first round of the competition, we submitted a written proposal with our software, as well as a presentation pitching our idea. We received feedback on our storytelling and were prompted to consider uses for the system in children’s healthcare settings. We were then invited to the Microsoft Reactor for the UK final which took place only a week later!
We delivered a 10-minute pitch about the problem we were solving with demos of the system’s features. In the week leading up-to the event, we were able to finalise:
- our weather classification system,
- the audio classification of explosive sounds for the Wobble mode and,
- our in-house projector-camera calibration.
Our judges were Anna Dijkstra (Innovation Director, UK Healthcare & Life Sciences at Microsoft), Rob Heath (Azure Sales Manager), Chris Noring (Cloud Advocate Lead) and Mollie Fenner (Cloud Solution Architect). They were very impressed by how receptive we were to their initial feedback and the progress we had made in only a week. They appreciated the immersion the system provided and were keen to use it to entertain their own children once we deployed it to the Microsoft Store.
Following the final, we had the opportunity to continue the discussion about our project with the judges. Using a projector to provide AR experiences is a rather stagnant space however, we realised there were many practical uses for such a system. Specifically, we considered using the projected space around the TV to display metrics about a football match or racing game. This is further discussed in the Future Work section in our Evaluation.