Implementation
Buiding the Solution
This page outlines the implementation process for developing dashboards for team and individual reports for both the Digital Creative Team and the Copywriting Team. Given that the workflow is largely consistent across both teams, the examples and visual references provided here will focus on the Digital Creative Team. For a full walkthrough on how to build the dashboards, check out the step-by-step guide in the appendices.
Microsoft Planner
Microsoft Planner is used by Chanel to manage and track tasks across their workspace. To replicate this setup, we were provided with sample data representing their internal workflows. Our first step was to create a Planner board for each team—such as the Digital Creative Team—and populate it with the corresponding information from Excel. This allowed us to simulate the task environment before integrating additional Microsoft tools to automate data collection and reporting.

Example Task Table
| Task Name | Bucket | Progress | Priority | Assigned To | Created By | Created Date | Due Date | Completed By | Labels | Description |
|---|---|---|---|---|---|---|---|---|---|---|
| UK - CCM - Digital experience ASSETS | 🖥️ In Production | Completed | Medium | 3D Project Manager; Senior Digital Designer | 3D Project Manager | 20/01/2025 | 24/01/2025 | Senior Digital Designer | UK; Retail; Amend; Senior Digital Designer | ADHOC |
| TESTING - CCM Digital experience Digital Assets | 🖥️ In Production | Completed | Medium | 3D Project Manager; Senior Digital Designer | Senior Digital Designer | 15/01/2025 | 17/01/2025 | Senior Digital Designer | UK | |
| SA - SS25 - FOLLOW UP | 📝 Briefed | Not started | Medium | Briefer 1; Briefer 2 | Briefer 2 | 13/02/2025 | 17/02/2025 | UK; CRM | ||
| UK - CCM / LIP - AVOLTA SOLUS EMAILS | 📝 Briefed | Not started | Medium | Briefer 3 | Briefer 3 | 13/02/2025 | 20/02/2025 | E-Retail; UK | ||
| UK - Makeup - LAUNCH | 📝 Briefed | Not started | Medium | Briefer 1; Briefer 2 | Briefer 2 | 13/02/2025 | 17/02/2025 | UK; CRM | ||
| UK - COCO MAD - FOLLOW UP | 📯 Assigned | Not started | Medium | Briefer 1; Briefer 2 | Briefer 2 | 13/02/2025 | 21/02/2025 | UK; CRM; Digital Designer 1 |
Visual Result in Microsoft Planner
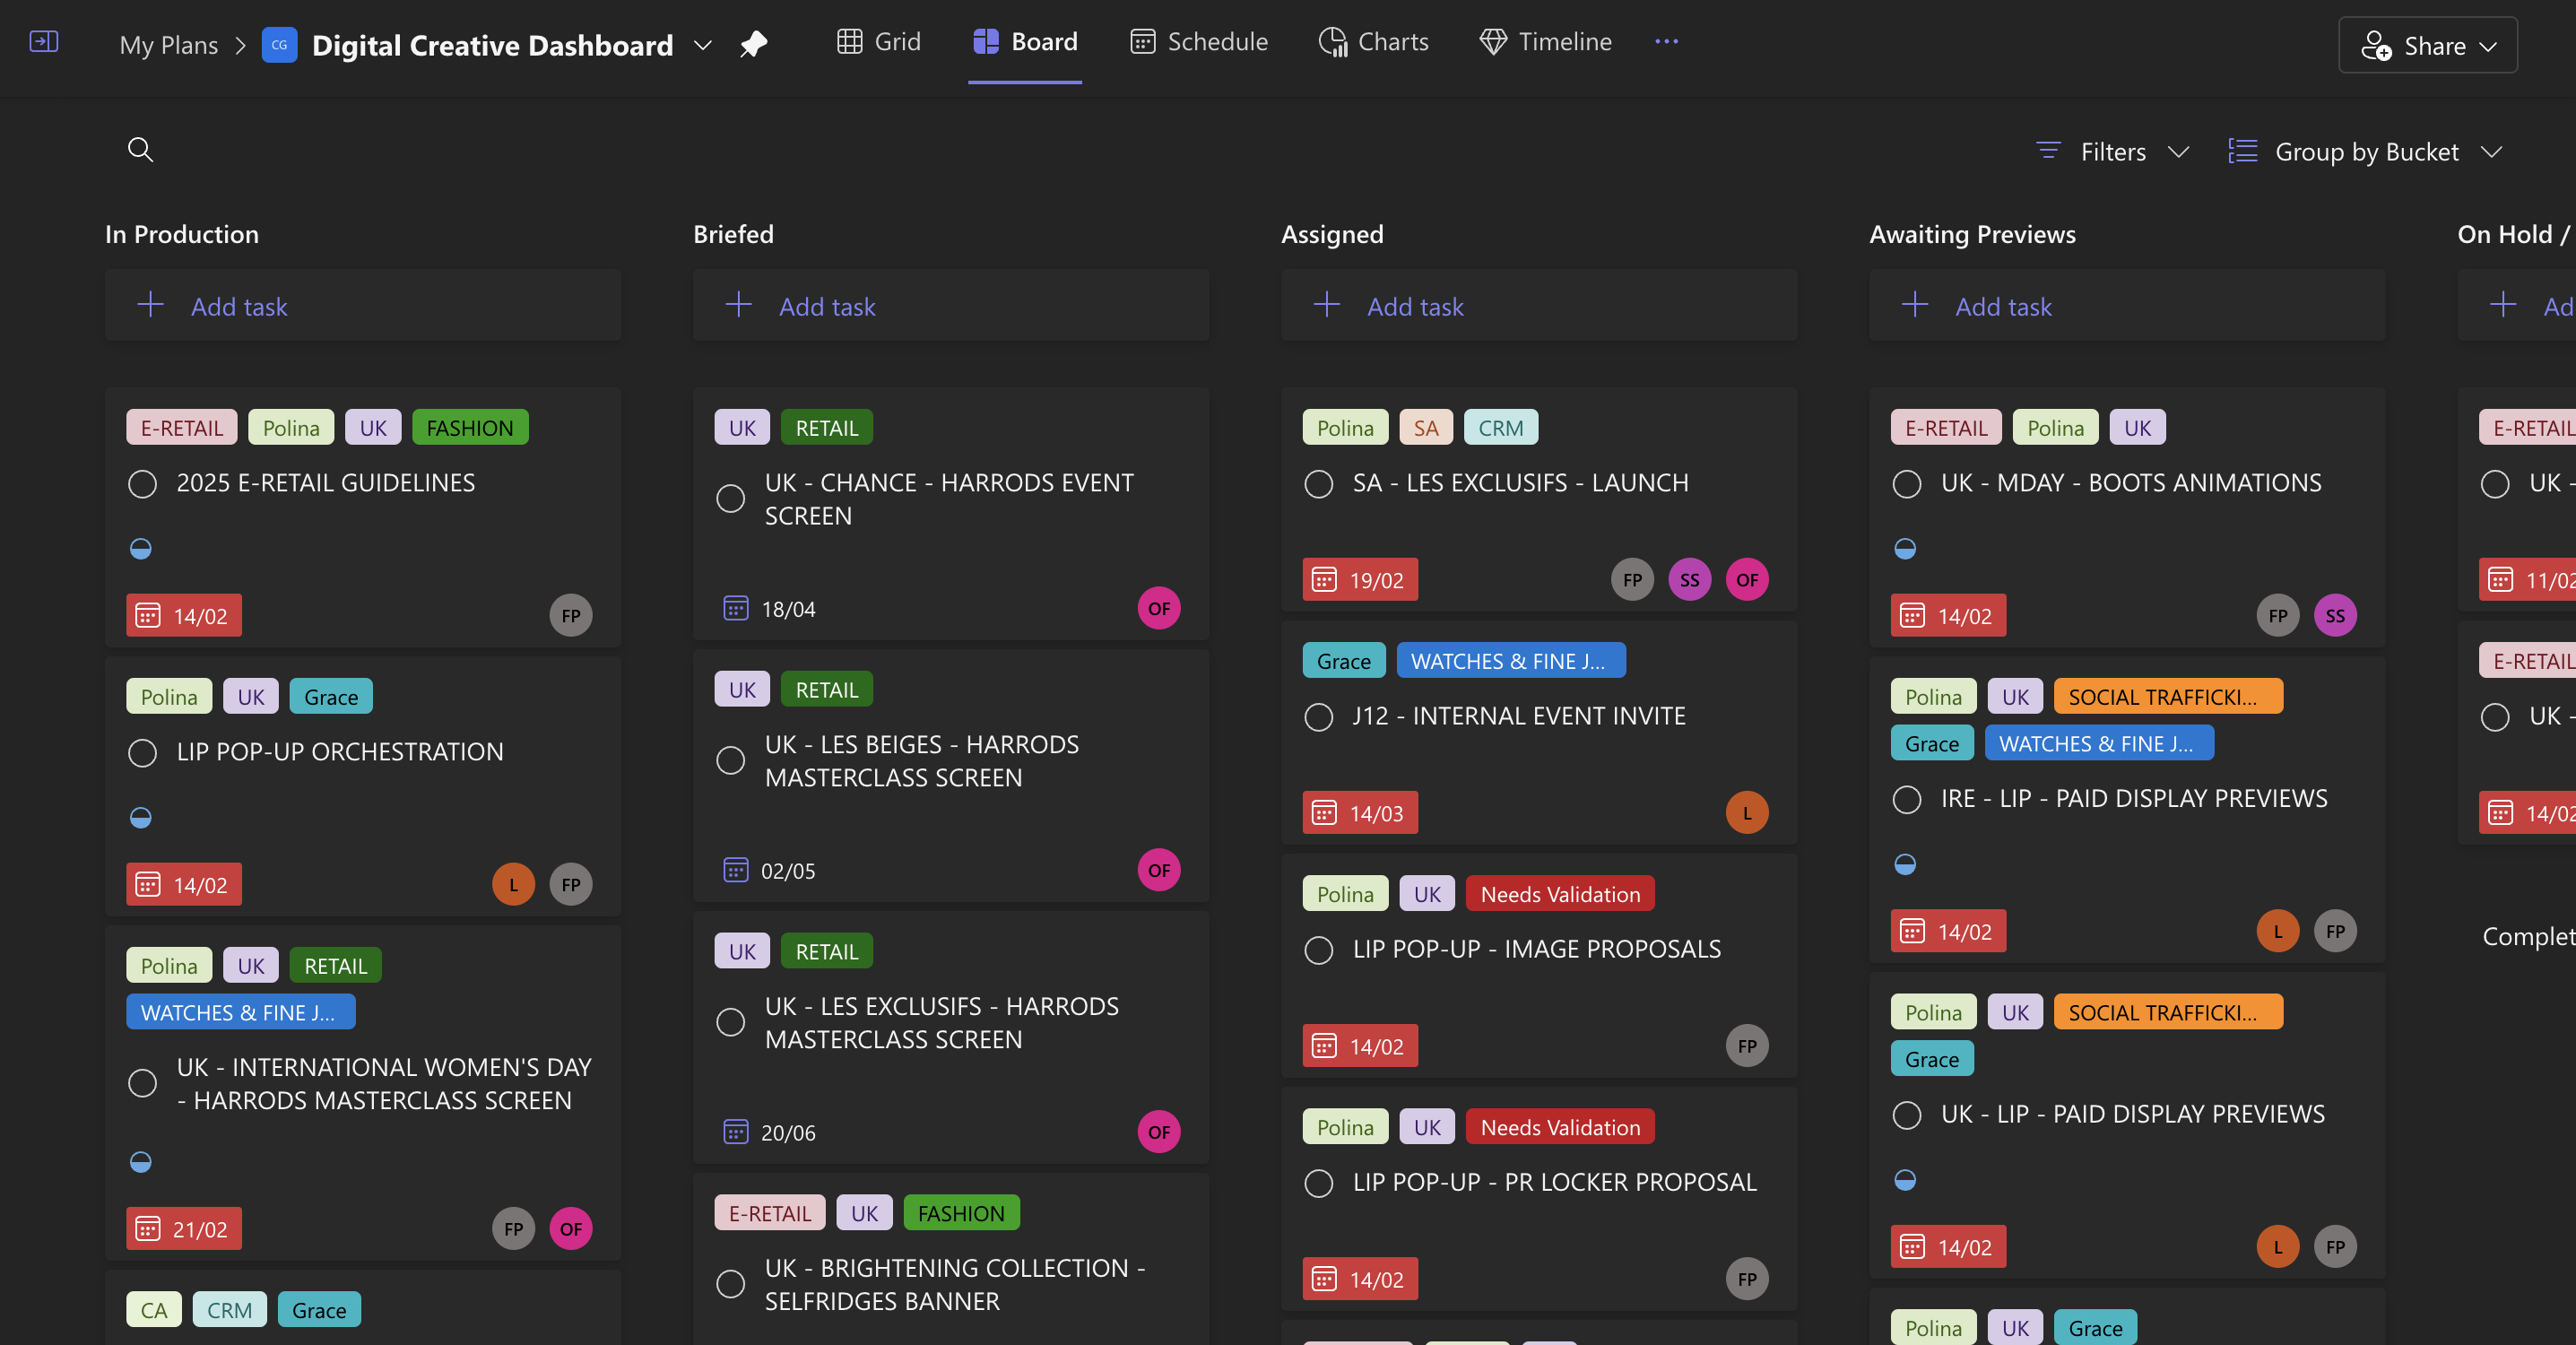
After inputting the sample data into Microsoft Planner, the dashboard appears as shown above — organized by bucket columns such as “In Production”, “Briefed”, “Assigned”, and more. This layout reflects the actual structure and tagging used by the Digital Creative Team.
Microsoft Power Automate
Microsoft Power Automate is used by Chanel to automate workflows between Microsoft tools. In this case, it was implemented to sync task data from Planner into a SharePoint list. This setup ensured that all task updates — including assignments, labels, and progress — were automatically reflected across platforms without the need for manual updates.

Setting Up the Power Automate Flow
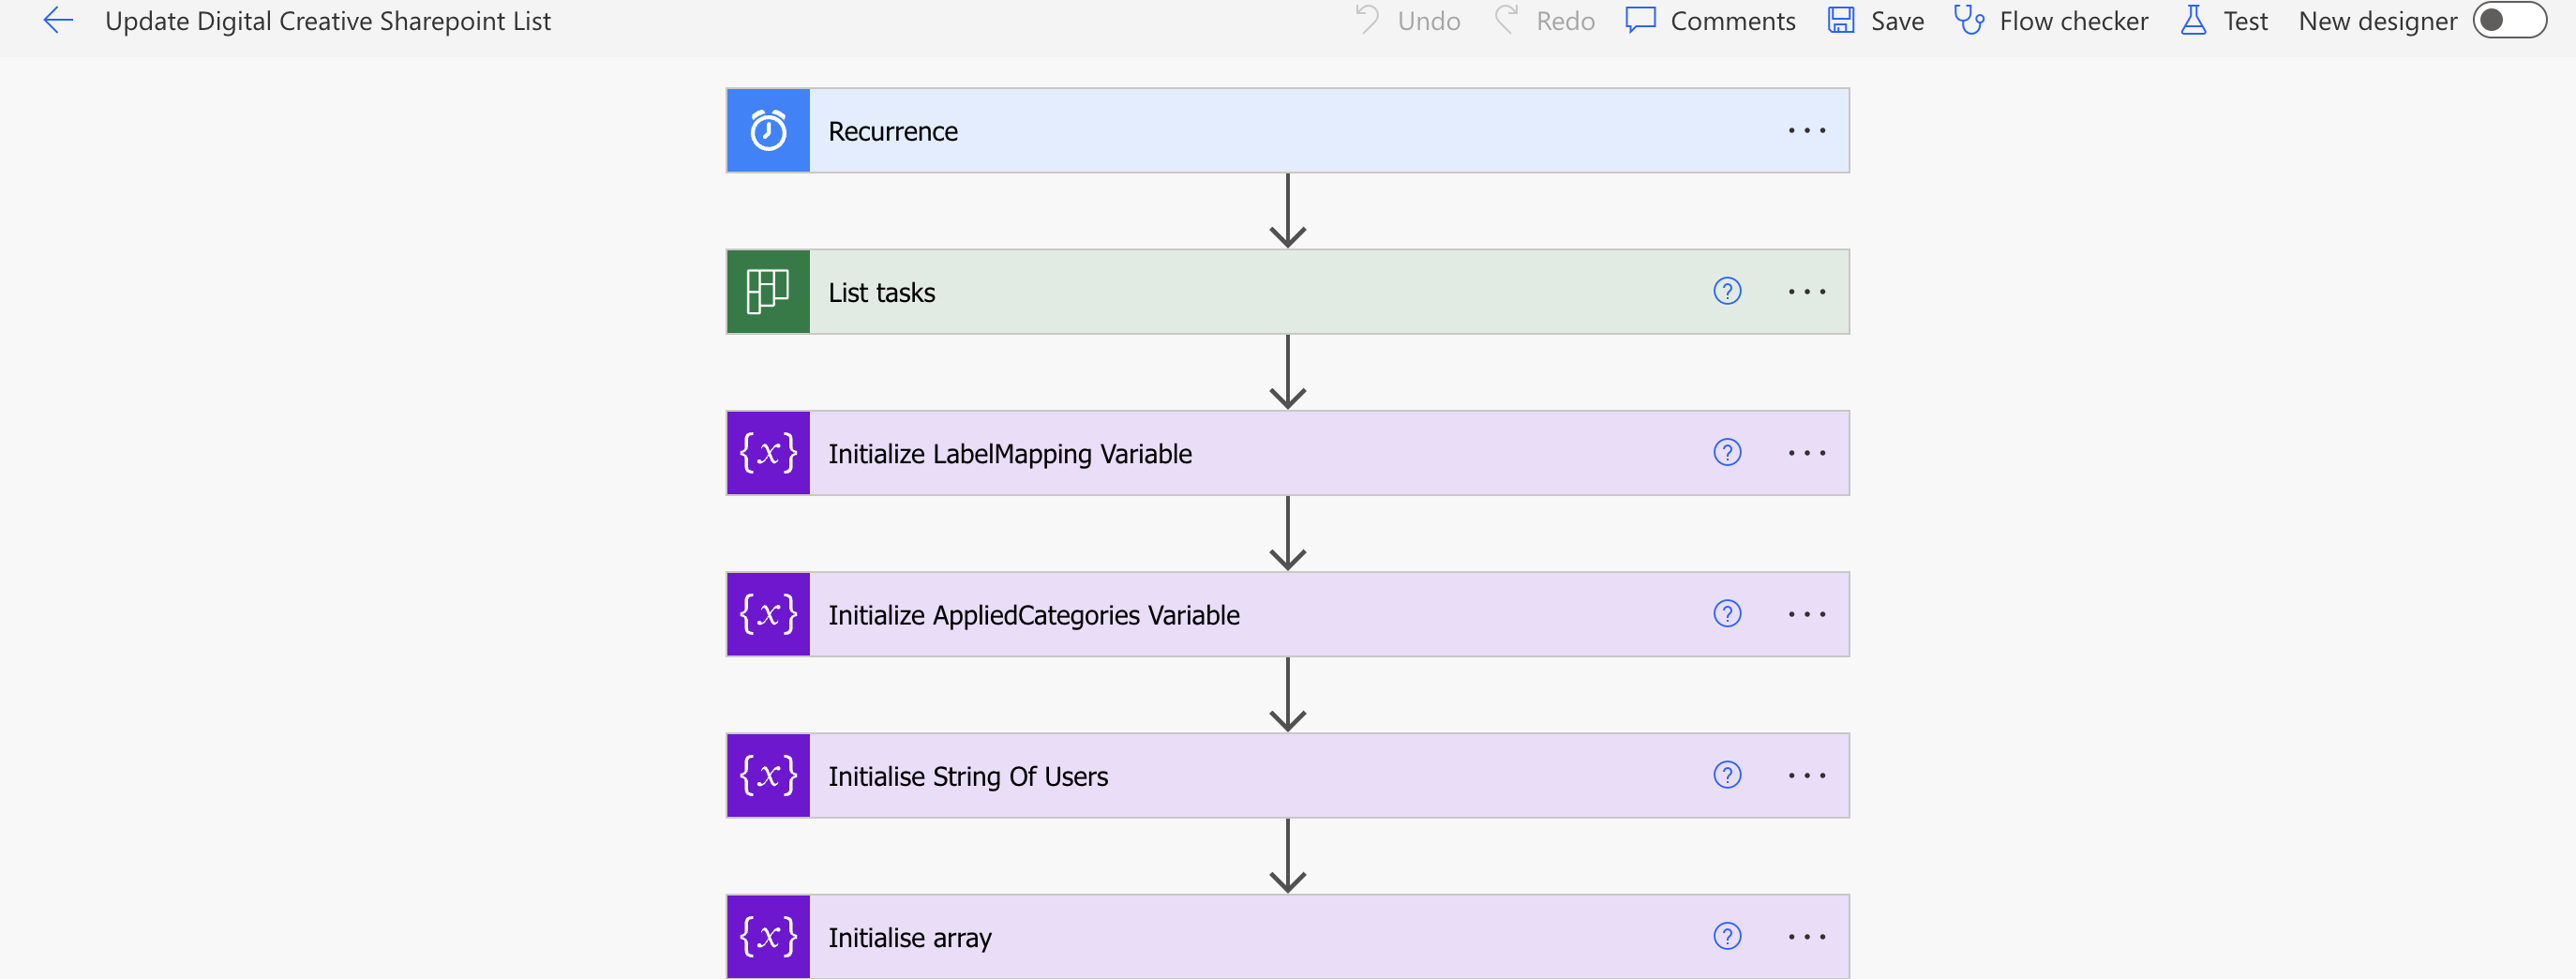
The image above displays the top portion of the Power Automate flow. This section handles the preparation logic — initializing variables that are used throughout the rest of the automation. Each variable plays a key role in processing task data from Microsoft Planner before syncing it into SharePoint.
Description of Each Component

-
Recurrence
This trigger defines how often the flow should run. In our case, it's scheduled to check Planner daily. This ensures task data is synced regularly with SharePoint without manual input.

-
List Tasks
This step fetches all tasks from the specified Planner board (e.g., Digital Creative Dashboard). It provides the base dataset we loop through to extract task details and sync them to SharePoint.

-
LabelMapping Variable
This variable stores a mapping between Planner’s internal label codes and the readable label names (e.g., “UK”, “E-RETAIL”, “CRM”). When the flow retrieves task data, labels are returned as color-coded values (like label_1, label_2). The mapping variable translates these into meaningful text for SharePoint.

-
AppliedCategories Variable
This holds the raw category data retrieved from each Planner task. It helps identify which labels have been applied to a specific task, and works together with the LabelMapping variable to construct a clean, comma-separated label string.

-
String of Users
Planner tasks can have multiple assignees. This variable is used to gather the full display names of all assigned users for a task. It is later inserted into SharePoint under the "Assigned To" column.

-
Array (TaskID List)
This array collects the unique task IDs of all items currently present in Planner. When the flow loops through SharePoint entries, it uses this list to check which tasks are still active. If a task ID is missing from this array, the corresponding SharePoint item is deleted — ensuring the list stays in sync.
Update and Create Task
This portion of the Power Automate flow is directly connected to the preparation logic from the earlier section. It is responsible for handling updates to existing tasks and creating new entries in the SharePoint list if they don’t already exist. The flow loops through all tasks retrieved from Microsoft Planner, cross-references them with SharePoint, and ensures data is accurately synchronized.
This step initializes the "Apply to each" loop, where each task from Microsoft Planner is individually processed. The input for this loop is the value array of all retrieved tasks, and it ensures every task is evaluated one-by-one. Inside this loop, a series of operations take place — such as resetting variables, pulling additional task details, mapping values, and determining whether the task should be updated or created in SharePoint.

Description of Each Component

-
Reset Variables
Clears all temporary values set by the previous task iteration.- LabelMapping – clears label data.
- AppliedCategories – clears previous task category values.
- AssignedUsers – resets the string of usernames for a clean build.

- Get Items
Retrieves all current SharePoint entries for comparison with the tasks in Planner.

- Get Task Details / Get a Task
Gets an existing Planner task’s details including assignments, title, description, and labels.

- Set New AppliedCategories
Stores the newly extracted categories from the task into a variable for string building later.

- Append to String Variable
Joins category or user data into a comma-separated string ready for SharePoint.

- Apply to Each 6
Iterates over the assigned users for a task.- Get user profile (V2) – Fetches full user profile data.
- Append to string variable – Adds the user’s display name into the final string.

- Progress
Gets the completion status of a task.

- List Buckets / Filter Buckets
Retrieves Planner buckets and filters to find the one assigned to this task.

- Check if item exists in SharePoint
Determines whether to update or create a task based on whether a match is found in SharePoint.

- If Yes – Update Item:
Updates an existing task entry in SharePoint. - If No – Create Item:
Creates a brand new SharePoint entry based on the Planner data.
Deleting Non-Existing Tasks
This section runs parallel to the "Update and Create Task" block and is also directly connected to the setup phase of the Power Automate flow. Its purpose is to ensure that SharePoint only reflects tasks that are still present in Microsoft Planner. If a task no longer exists in Planner, it will be automatically removed from SharePoint.

Description of Each Component

- Get Items 2
Retrieves all current tasks in the SharePoint list to build a reference of what exists in the system.

- Append Planner IDs to a String
Loops through each SharePoint task entry and concatenates the Planner ID into a string, separated by semicolons. This will be used later to check for Planner presence.

- Check if Planner ID Still Exists in SharePoint
Compares each task from SharePoint against the latest list of Planner task IDs. If a match is not found, the task is considered obsolete and flagged for deletion.
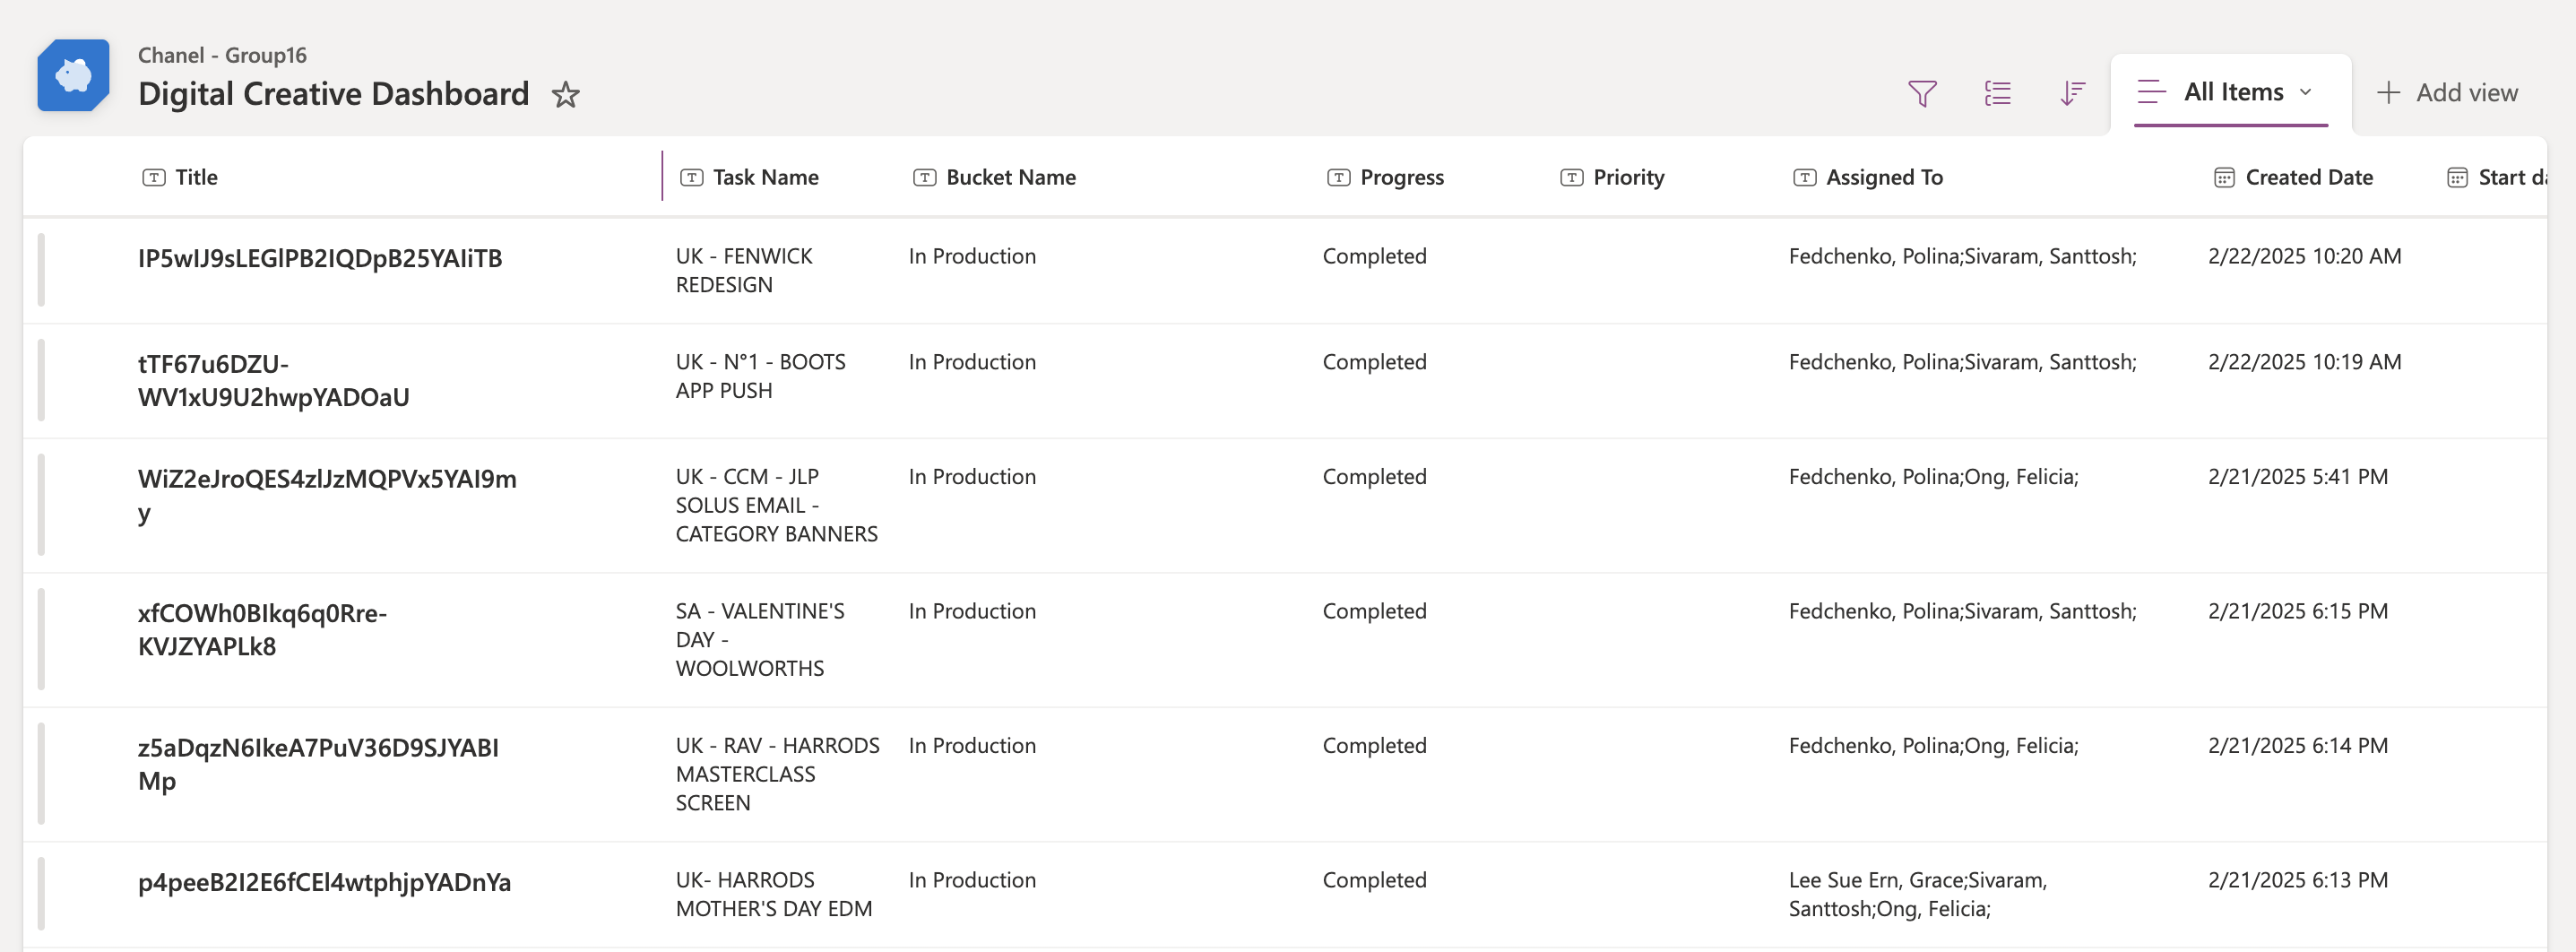
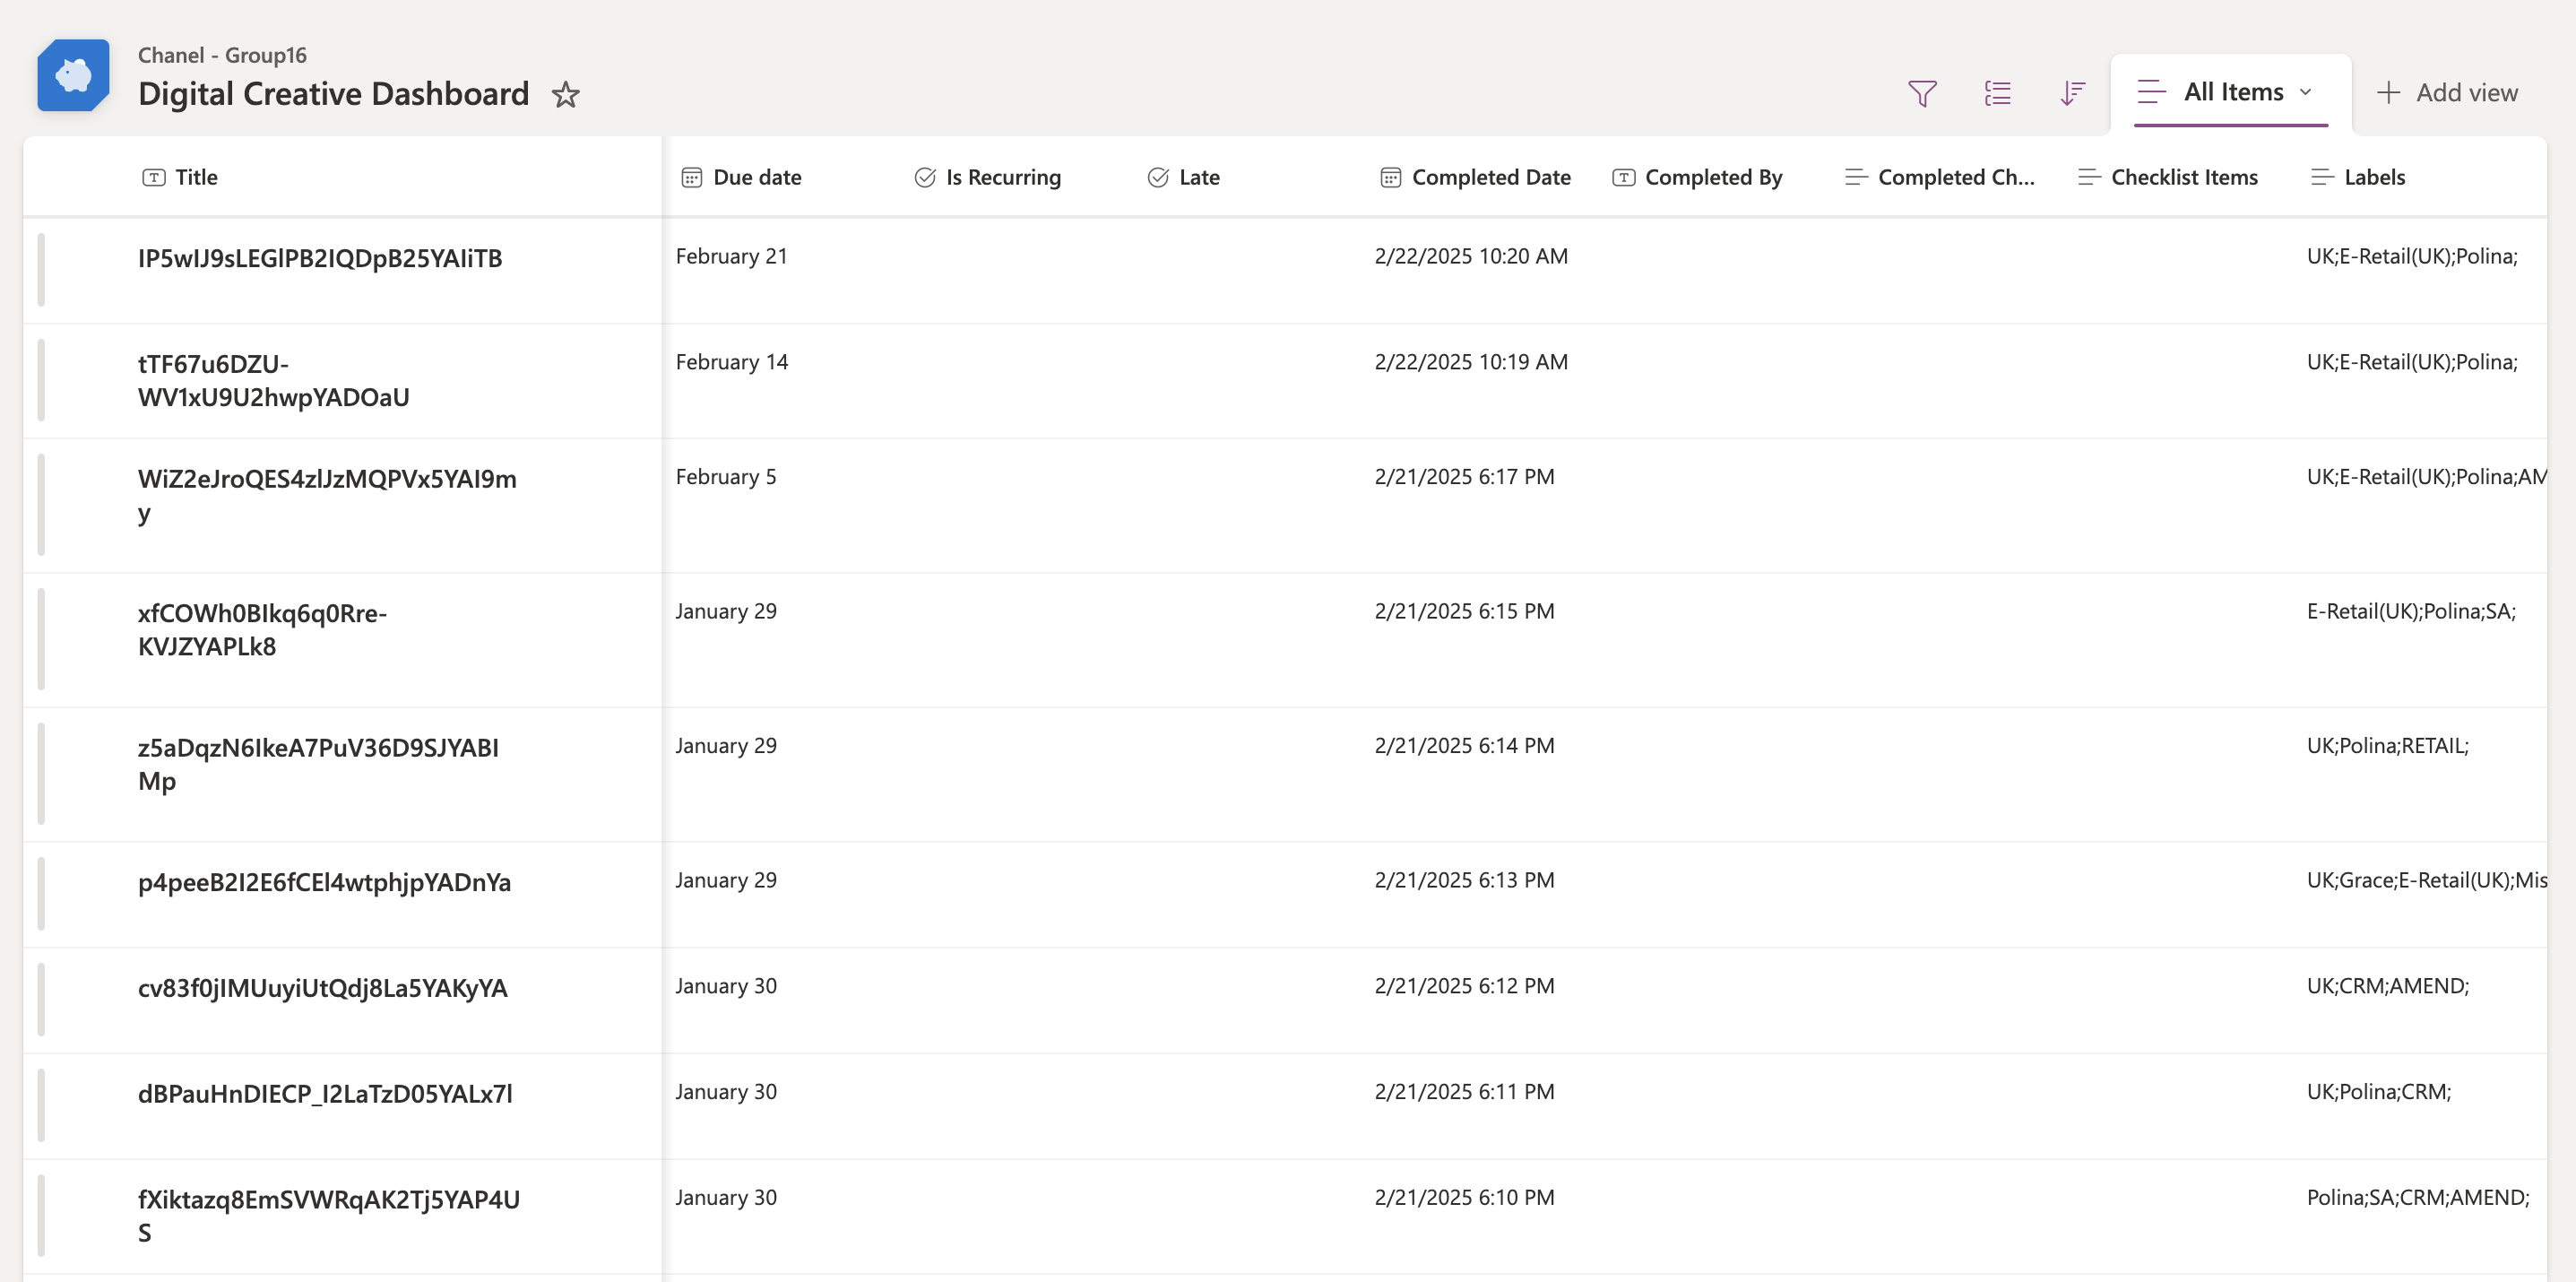
Sharepoint
SharePoint serves as the centralized platform where all task data is ultimately stored and organized for Chanel. As tasks are managed and updated in Microsoft Planner, Power Automate ensures they are synced accurately to SharePoint. This enables teams to track progress, view key attributes such as priority, assignees, labels, and due dates, and generate reports as needed.

Example SharePoint List
Microsoft Power BI
Power BI serves as the primary tool for analyzing and visualizing the task data stored in SharePoint. Once data is synchronized from Microsoft Planner via Power Automate, Power BI connects directly to the SharePoint list to generate interactive dashboards. These dashboards enable stakeholders to monitor task distribution, team workload, validation progress, and overall performance trends. With the help of custom DAX formulas, the data is dynamically modeled into meaningful metrics—such as departments, regions, and validation status—allowing teams to derive actionable insights and make informed decisions efficiently.

Example Dashboards
Below are examples of the Power BI dashboards that were built using the modeled data. Each visual uses specific fields derived from the SharePoint list.
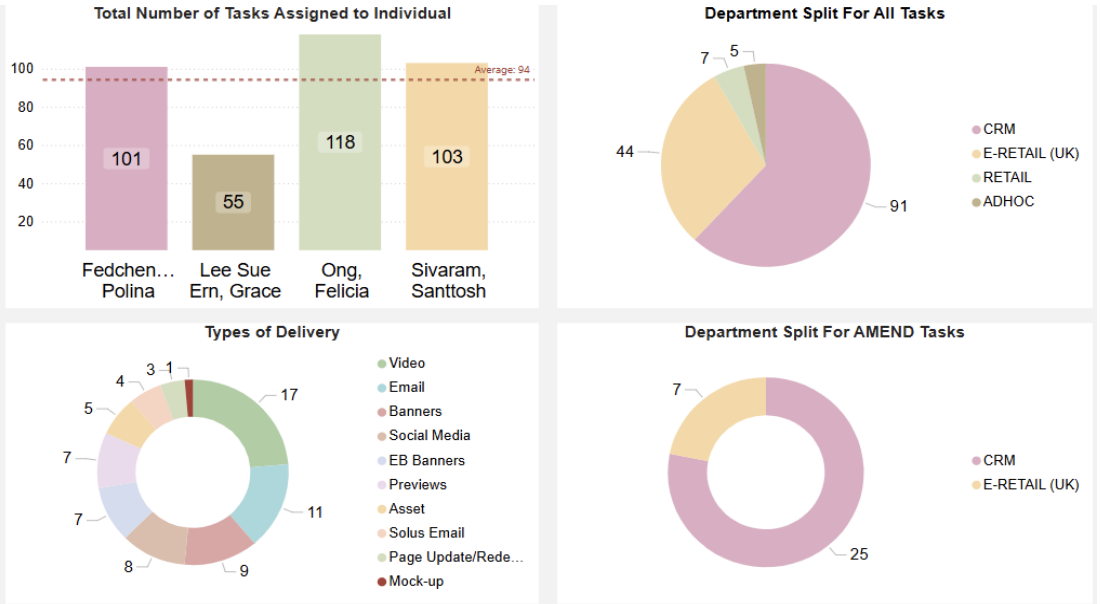
- Total Number of Tasks Assigned to Individual:
This bar chart shows how tasks are distributed among different team members. Each bar represents an individual, with the height indicating how many tasks they’ve been assigned. It helps quickly identify workload balance across the team. - Department Split For All Tasks:
This pie chart shows the proportion of all tasks by department. Each slice represents a department, giving a visual breakdown of which departments are handling more or fewer tasks overall. - Types of Delivery:
This donut chart visualizes the various delivery formats used for tasks—such as emails, videos, banners, and mock-ups. It helps illustrate the diversity and volume of work across different content types. - Department Split For AMEND Tasks:
This donut chart focuses specifically on tasks marked as "AMEND" and shows how those tasks are distributed by department. It's useful for tracking how amendments are spread across teams.
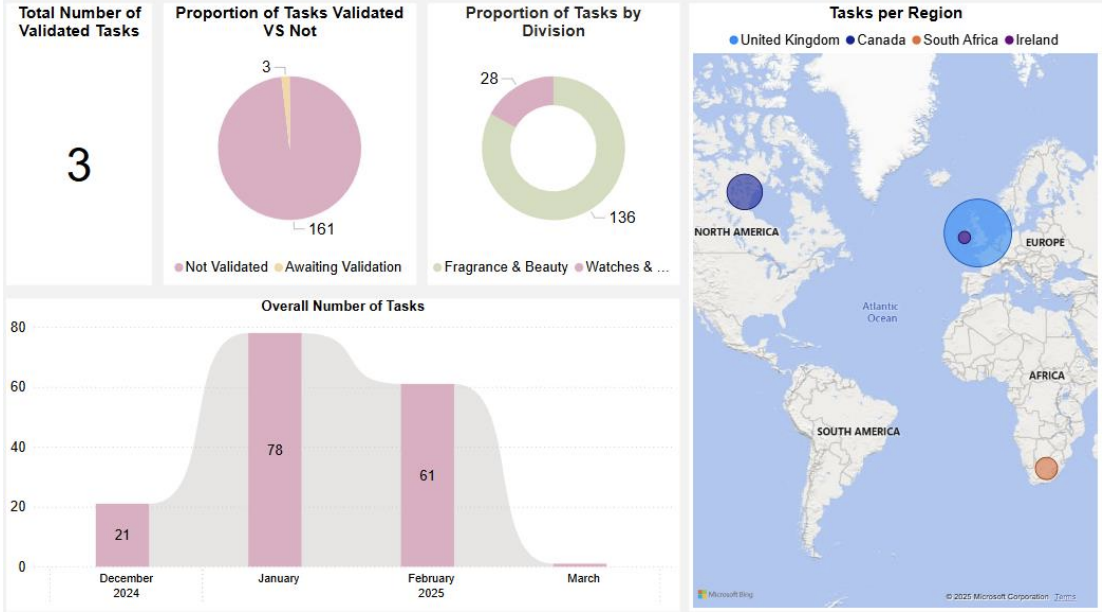
- Total Number of Validated Tasks:
This KPI card displays the total count of tasks that have been marked as validated. It gives stakeholders a quick snapshot of completed and approved work. - Proportion of Tasks Validated VS Not:
This pie chart compares the number of tasks that have been validated against those still pending. It clearly illustrates how much work is finalized versus what remains in progress. - Proportion of Tasks by Division:
This donut chart breaks down the total number of tasks across different divisions such as Fragrance & Beauty and Watches & Fine Jewellery. It provides insight into which divisions are generating more task activity. - Tasks per Region:
This map visualization displays task distribution across geographic regions. It allows the team to identify which regions are handling the most or least workload. - Overall Number of Tasks:
This area chart shows the trend of task creation over time, typically by month. It’s useful for tracking how task volume grows or declines over different periods.
Microsoft Power Apps
Microsoft Power Apps was used to create a centralized interface that consolidates team and individual performance metrics. The application allows Chanel’s team members to view their task distribution, validation status, and other key analytics through embedded Power BI dashboards. By combining visualizations with user-specific information, Power Apps provides an intuitive environment for real-time review and reporting.

App Features Overview
- Group Reports Page:
Serves as the centralized view for the Digital Creative Team, showing team-level metrics through embedded Power BI charts. Users can view total task assignments per team member, the range of delivery types used, departmental categorization, and how AMEND tasks are distributed across departments—all updated in real time.

- Group Analytics (Page 2):
Complements the first group page with broader metrics, including task validation status, division-level analysis, a monthly trend of tasks created, and geographic visualization of tasks by region. Ideal for high-level decision-making and workload forecasting.

- Individual Report Page:
Tailored to each user, this page displays their personal workload data. The expanded navigation menu on the left allows users to switch between team and individual reports pages, and the profile page. Metrics include individual task counts and a breakdown of how their tasks are categorized by department and delivery method.

- Individual Analytics (Page 2):
Expands personal analytics further with insights such as task validation status, division association, regional task locations, and task volume over time. The insights empower users to understand their own performance and prepare for appraisals or presentations.

- User Profile Page:
Offers a detailed view of the user’s identity and work history within Chanel. Includes fields like job role, department, contact info, current team, region, and time in company—adding a personalized layer to the otherwise analytical dashboard experience.

Power BI Integration
Power BI dashboards were embedded directly into the Power Apps interface. This tight integration ensures users interact with real-time analytics without leaving the app environment. Filters and visuals within the Power BI reports remain fully functional, creating a seamless, centralized space for viewing personal and team-wide performance metrics alongside profile data.