Testing
Testing Strategy
End-to-end (E2E) testing for the Power App ensures that the application works as expected in real-life scenarios. We used Playwright to simulate user interactions with the Power App and validate both frontend and backend functionality. The following testing steps were prioritised:
- Test Coverage: We ensure that key user journeys — such as logging into the app, navigating through multiple pages, performing actions, and verifying expected outcomes — are covered. The test coverage focuses on the critical path and important interactions that users will perform.
- Error Handling and Edge Cases: Tests are written to handle edge cases, such as incorrect logins, failed actions, timeouts, and unexpected behaviors.
End-to-End Functional Testing
The Playwright tests simulate real user flows through the Power App. The following aspects were written in Typescript, and subsequently tested in E2E testing:
- Login Flow: Validates that users can log in using their credentials, handle MFA, and access the main dashboard.
- Page Navigation: Validates that users can navigate between pages (e.g., switching from 'PAGE 1' to 'PAGE 2' within the embedded Power BI dashboard, or switching between the correct Team dashboard & Individual dashboard pages within the navigation menu), and all elements load correctly.
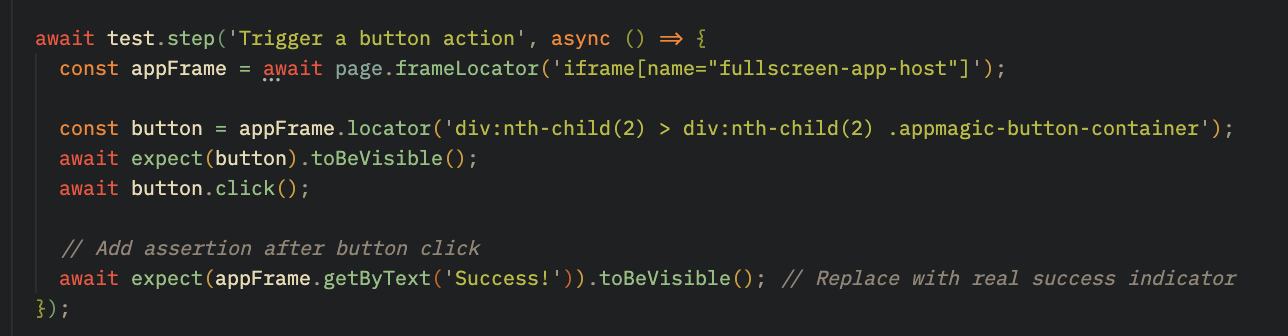
- Action Verification: Simulates interactions with buttons within the PowerBI dashboard and the navigation menu. These are validated with assertions like expect() to ensure the correct elements appear after clicks (e.g., success messages or next page navigation).
Overall, testing for Power Apps interface was successful. Moving forward, we hope to utilise more tools aimed at testing the back-end.
User-Acceptance Testing
Given the limitations of the Microsoft technology stack in supporting comprehensive automated testing across both frontend and backend processes, User Acceptance Testing (UAT) was adopted as a key strategy to validate the application from the end-user perspective.
To facilitate this, a structured two-hour UAT session was conducted onsite at the Chanel's headquarters office in London, allowing users to interact freely with the application in a real-world setting. This hands-on session enabled stakeholders to assess the app’s usability, functionality, and responsiveness in line with their daily workflows.

Feedback was collected using a Microsoft Form comprising five targeted questions designed to evaluate the user experience, ease of navigation, and overall satisfaction. Insights gained from this session were instrumental in identifying minor usability improvements and ensuring that the final solution met user expectations and business requirements.
Feedback
The following table summarises the questions asked during the UAT session and the corresponding responses from end-users.
| ID | Questions | Answers |
|---|---|---|
| 1 | Was it easy to navigate through individual and team-wide reports? |
|
| 2 | Were you able to filter and search for specific reports efficiently? If not, what improvements would make it easier? |
|
| 3 | Did the report layout and data presentation meet your expectations? Was there any information missing or unclear? |
|
| 4 | Is there any feature you expected but didn’t find? What changes or enhancements would improve your experience? |
|
| 5 | Is there anything more you'd like to tell us to improve your experience? |
|
Conclusion
End-to-end testing for the Power Apps solution was conducted using Playwright to ensure reliability across critical user flows such as login, navigation, and data interaction. These tests were necessary to confirm the application’s core functionalities worked as expected and that the user experience was smooth.
Playwright was chosen for its ability to automate browser actions and handle secure login scenarios typical in Microsoft’s tech stack. Testing simulated real user actions such as signing in via Azure AD, navigating between the Team & Individual report dashboard screens and Power BI pages, and interacting with filtering options. All tests were successful, with users correctly redirected post-login, smooth transitions across screens, and charts updating dynamically in response to filters.
While results confirmed a stable and functional application, user feedback from both automated testing and User Acceptance Testing highlighted areas for UI improvement, such as enhancing the visibility of tabs and filters. The application was also tested rigourously throughout development by the team.
Overall, the testing strategy combined automation with hands-on evaluation to deliver a validated and user-approved reporting solution.