
Overview of Features
A summary of UnitPylot's features and functionalities is provided below:
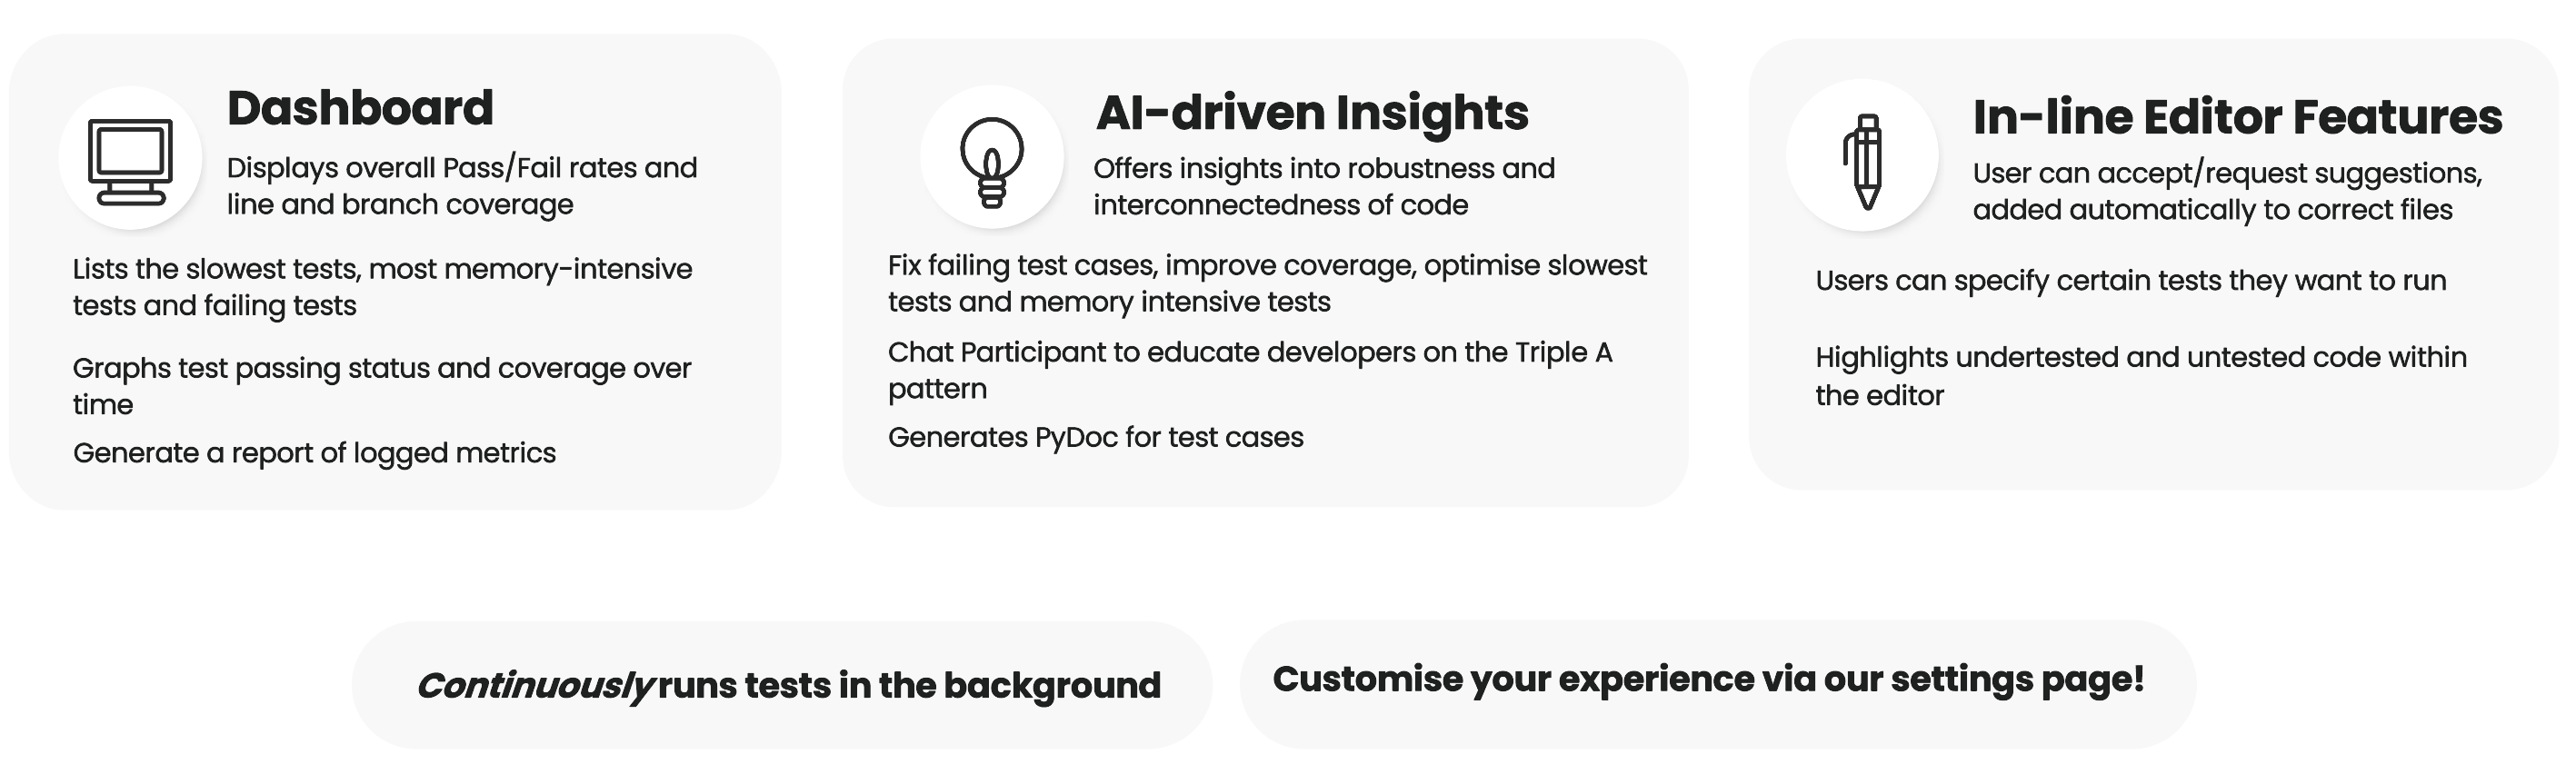
A summary of UnitPylot's features and functionalities is provided below:
When the extension is run, VS Code invokes the activate function. This function is
responsible for setting up the extension’s environment by initialising core components for tracking data, registering
commands, and listening for workspace events. For instance, within the activate function, the extension listens for
file changes to dynamically update test coverage highlights when a user switches between files:
Commands form the backbone of the extension, enabling users to trigger specific actions via the command palette or right-click menus.
Each command is registered using vscode.commands.registerCommand within the activate function using the VS Code Extension API, linking a command ID to a function that performs the associated task. UnitPylot also offers specific commands that are only available inside the text editor, which are registered using vscode.commands.registerTextEditorCommand. After declaration, the command is added to context.subscriptions to ensure proper cleanup when the extension is deactivated.
For example, the following snippet registers and maps a command onto a function that executes and retrieves test results:
The registered commands are made accessible to the user through package.json, which is the extension’s configuration file. They must be explicitly declared with the command reference and display name under contributes.commands to appear in the command palette.
Additionally, UnitPylot integrates commands into the context menu within the editor, allowing users to access the
relevant AI powered commands directly from the right-click menu. This is achieved by declaring the right-click
commands as a group in package.json. “when” conditions are used to ensure that the command only
appears inside the relevant files, improving workflow efficiency by making actions context-aware. (E.g. "Fix Failing Tests" is accessible from only Python test files,
and not inside the non-test files).
When the user navigates to the UnitPylot dashboard, they can view data about their test suite through our metric generation system that is implemented using the TestRunner class. The class acts as a central controller for executing tests, collecting results, parsing code coverage, and tracking file changes across the workspace.
Tests are executed via the pytest framework, invoked from within the extension using Node.js’s child_process.spawn function. The command constructed includes flags for collecting additional metrics and generates two output files:
coverage.json, where coverage is parsed to track total lines covered, missed, skipped, and branch coverage statistics, stored under a Coverage object with per-file breakdowns and overall summaries.getPytestResult() and parseCoverage(), defined in the extension’s TypeScript backend. These files are read using the fs module and converted into structured data types (TestResult and Coverage), which are stored in memory and persisted using the VS Code workspaceState API.
To retain test and coverage results across editor sessions, the TestRunner class uses VS Code’s vscode.Memento API. On initialisation, TestRunner attempts to load the last known state using: this.workspaceState.get(this.stateKey) and updates it after test execution using: this.workspaceState.update(this.stateKey, state). This ensures that previously computed metrics remain accessible and can be visualised or exported without rerunning tests unnecessarily.
To optimise performance, the extension includes functionality for selectively running only those tests affected by recent code changes to save time and resources. This is achieved by hashing all functions and class methods in the workspace using a Python script (function-splitter.py) that leverages the ast module to extract function definitions.
A hash map is generated for each function and stored in the extension. On subsequent runs, this hash is compared against a newly generated one using getWorkspaceHash() and getModifiedFiles(). This process identifies which files or functions were added, removed, or changed.
Modified functions are then cross-referenced against test-function mappings extracted using another script (test-extractor.py), which parses the Abstract Syntax Tree (AST) of test files to determine which functions they invoke. This analysis produces a map from application logic to specific test cases. The backend combines this with workspace metadata (via vscode.workspace) to construct a minimal set of tests for execution.
The filtering logic ensures that only functions matching the test_ naming convention (as expected by pytest) are included in the test run.
Once test data is loaded into memory, several utility methods allow the extension to compute derived metrics:
getResultsSummary() aggregates total passed and failed testsgetSlowestTests(n) returns the n tests with the longest durationsgetHighestMemoryTests(n) retrieves the tests with the greatest memory usagegetAllFailingTests() collects test functions that failed in the last rungetResultsForFile() filters the test result data for a specific file path
These methods operate on the stored TestResult structure and are available across the extension for features such as dashboards, context menus, and AI suggestions.
When the highlight inline coverage setting is ticked, the extension also integrates test coverage feedback directly into source files using the highlightCodeCoverage() function. This uses the vscode.window.activeTextEditor API to retrieve the current file and apply decorations to missed lines via TextEditorDecorationType (a class defined in the VS Code Extension API that displays the decoration). The Coverage data object includes all missed line numbers per file, which are converted into vscode.Range instances and decorated using a yellow background highlight. This allows users to visually identify uncovered code as they navigate between files.
The overview of the test cases passing / failing and coverage is displayed using VS Code’s Webview API. The extension defines a custom view dashboard.openview in package.json, backed by the SidebarViewProvider class. This provider uses the vscode.WebviewViewProvider interface to render a custom HTML-based dashboard inside the sidebar.
Upon first rendering, the resolveWebviewView() method is called, which sets the webview’s HTML content by loading a pre-built HTML file. The webview is configured with enableScripts: true, allowing dynamic JavaScript-based updates and interaction.
Data shown in the sidebar includes:
These values are dynamically updated using the updateResults() and updateCoverage() methods, which call webview.postMessage() with the latest test and coverage data. This triggers frontend handlers in the webview to redraw the charts and update DOM elements.
The test and coverage data displayed is fetched using internal API calls to TestRunner.getResultsSummary() and TestRunner.getCoverage(), which return cached or recomputed values depending on the configuration.
In addition to the dashboard, UnitPylot provides a structured TreeView called dashboard.failingtreeview, implemented through the FailingTestsProvider class using vscode.TreeDataProvider. This tree view organises test files and test functions hierarchically:
A getChildren() method dynamically determines whether to return file nodes or test function nodes based on the current tree expansion state. This method queries the TestRunner for data such as slowest and memory-heavy tests (getSlowestTests(), getHighestMemoryTests()) and filters the results accordingly. If the user makes changes to the workspace and reruns tests, tree refreshes are triggered by the refresh() method, which fires the onDidChangeTreeData event, prompting VS Code to re-query the tree structure.
When the user clicks on a command to generate UnitPylot suggestions, the extension interacts with LLMs through the Language Model API to analyse selected code and return insights. These suggestions are then displayed as annotation within the editor, also allowing the user to accept or reject them directly into the relevant file.
For instance, when the user clicks on the Fix Failing Tests command,
handleFixFailingTestsCommand is triggered, sending the failing test data collected and a specialised agent prompt to the LLM.The AI request must be formatted properly to return actionable insights. Thus, the prompt is structured so that the LLM understands the request based on the provided context and produces a strictly formatted JSON response for parsing. (The iterative process behind achieving this prompt structure is covered in the Research section). For instance, the prompt for the Fix Failing Tests command is structured as follows:
The function collects failing test results and converts them into JSON. It calls chatFunctionality within a separate helper function, where the prompt and code details are sent to the LLM using Llm.sendRequest and the response is awaited.
Once the response is returned, the extension parses the response and applies decorations to the editor. The response is streamed asynchronously, accumulating the JSON output from the AI. The object is parsed and the particular field data – in this case the line number, suggestion, and corrected code – is extracted and sent to handleAnnotation which decides how to display it based on the particular command type (case #3 for fix failing).
| Command #Case | Display Type |
|---|---|
| Generate Test Insights #0 | Line number based inline annotation |
| Optimise Speed & Memory #1 | Function name based inline annotation + Accept/Reject |
| Improve Test Coverage #2 | Line number based inline annotation + Accept/Reject into corresponding test file |
| Fix Failing Tests #3 | Line number based inline annotation + Accept/Reject into corresponding source or test file |
For the simple line-based suggestions, a subtle grey annotation is displayed at the end of the affected line. The annotation appears through the following steps:
vscode.window.createTextEditorDecorationType specifying:package.json.
test_math_operations.py, the fix is inserted in the same file. Else, if the bug is in the actual function, the fix is applied to math_operations.py instead.
UnitPylot maintains historical records of test executions and code coverage using a structured snapshot system. This is handled through two key classes:
HistoryManager - responsible for storing, retrieving, and managing snapshots of test executions.HistoryProcessor - processes snapshot data to generate meaningful insights.A snapshot is a bundled object that consists of the record of test results, code coverage, and timestamps stored in a customised JSON format.
They are created by retrieving the latest test execution results and coverage data using TestRunner.getAllResults(true) and TestRunner.getCoverage(true). A timestamp is also generated to record when the snapshot was taken and the snapshot is saved to snapshots.json in the user’s workspace.
Stored snapshots can be retrieved using two approaches: fetching the most recent snapshot or filtering based on date range.
snapshots.json and if no snapshots exist, an empty file is created to store future records.snapshotDate >= startDate && snapshotDate <= endDate.
The TestRunner invokes HistoryManager.saveSnapshot() to persist the state of metrics defined above. The coverage data is extracted from the predefined coverage.json file that is created through the TestRunner class hierarchy.
The pass/fail test suite history is generated by:
When the user clicks on the pass/fail graph of Coverage graph buttons, the extension triggers a command that utilises the Webview API to display an interactive, scrollable graph directly within the IDE.
The graphs are implemented using Chart.js and accept an array of objects containing the data prepared by accessing the HistoryProcessor class.
The pass/fail graph is fed data structured as { date: Date, pass: number, fail: number }[] and is displayed using a bar graph. While the coverage graph accepts data as { date: Date, covered: number, missed: number, branchesCovered: number } and is represented using a line graph with green, red, and blue coloured datasets indicating covered lines, missed lines, and covered branches respectively.
UnitPylot also includes a report generation functionality that allows the user to export test history snapshots into external files. This logic is captured within the ReportGenerator class, particularly in a method called generateSnapshotReport.
The method is triggered via the download report command when the Generate Report button on the dashboard is clicked. Behind the scenes, it retrieves two key datasets from the HistoryProcessor class: the pass/fail history and the snapshots. If no data is found, a default page is displayed and the user is notified.
vscode.SaveDialogOptions) via the VS Code API, where they have the option to save the report as either a JSON file or Markdown file. When the .json format is selected, the full dataset is written to disk using fs.writeFileSync. However, if the markdown option is selected, a separate method is called that calculates coverage percentages and flags improvements and declines in performance through visual cues by comparing stored variables.
Settings for UnitPylot are defined in package.json and automatically included in the VS Code settings page under the UnitPylot subsection. Accessing these settings within other parts of the system can be quite verbose as shown here:
Settings.NUMBER_OF_SLOWEST_TESTS;
To customise background processes such as running tests and saving snapshots, the user can toggle these individually and alter the time intervals. One thing to note is that changing time intervals requires the extension to be restarted due to how interval tasks are set. When the extension starts, the following code is run once:
To permit third party LLMs to be used, the Llm class is used. It contains one public method, sendRequest, which takes a list of messages to send and returns a LanguageModelChatResponse promise. This ensures compatibility with the default approach of the GitHub Copilot extensibility API which returns the same style of output.
sendRequest checks the user settings to either forward the messages to Copilot or a third party service. If Copilot is chosen, the GitHub Copilot extensibility API is used to process the request. However, if the Custom LLM setting is enabled, the request is sent to an OpenAI style REST API with the format: http://DOMAIN_NAME/v1/chat/completions. This allows compatibility with many services such as OpenAI and Ollama. The request is then formatted by fixing any json issues and removing non json text. Finally the output is streamed to generate a PromiseLanguageModelChatResponse object.