| UC1 |
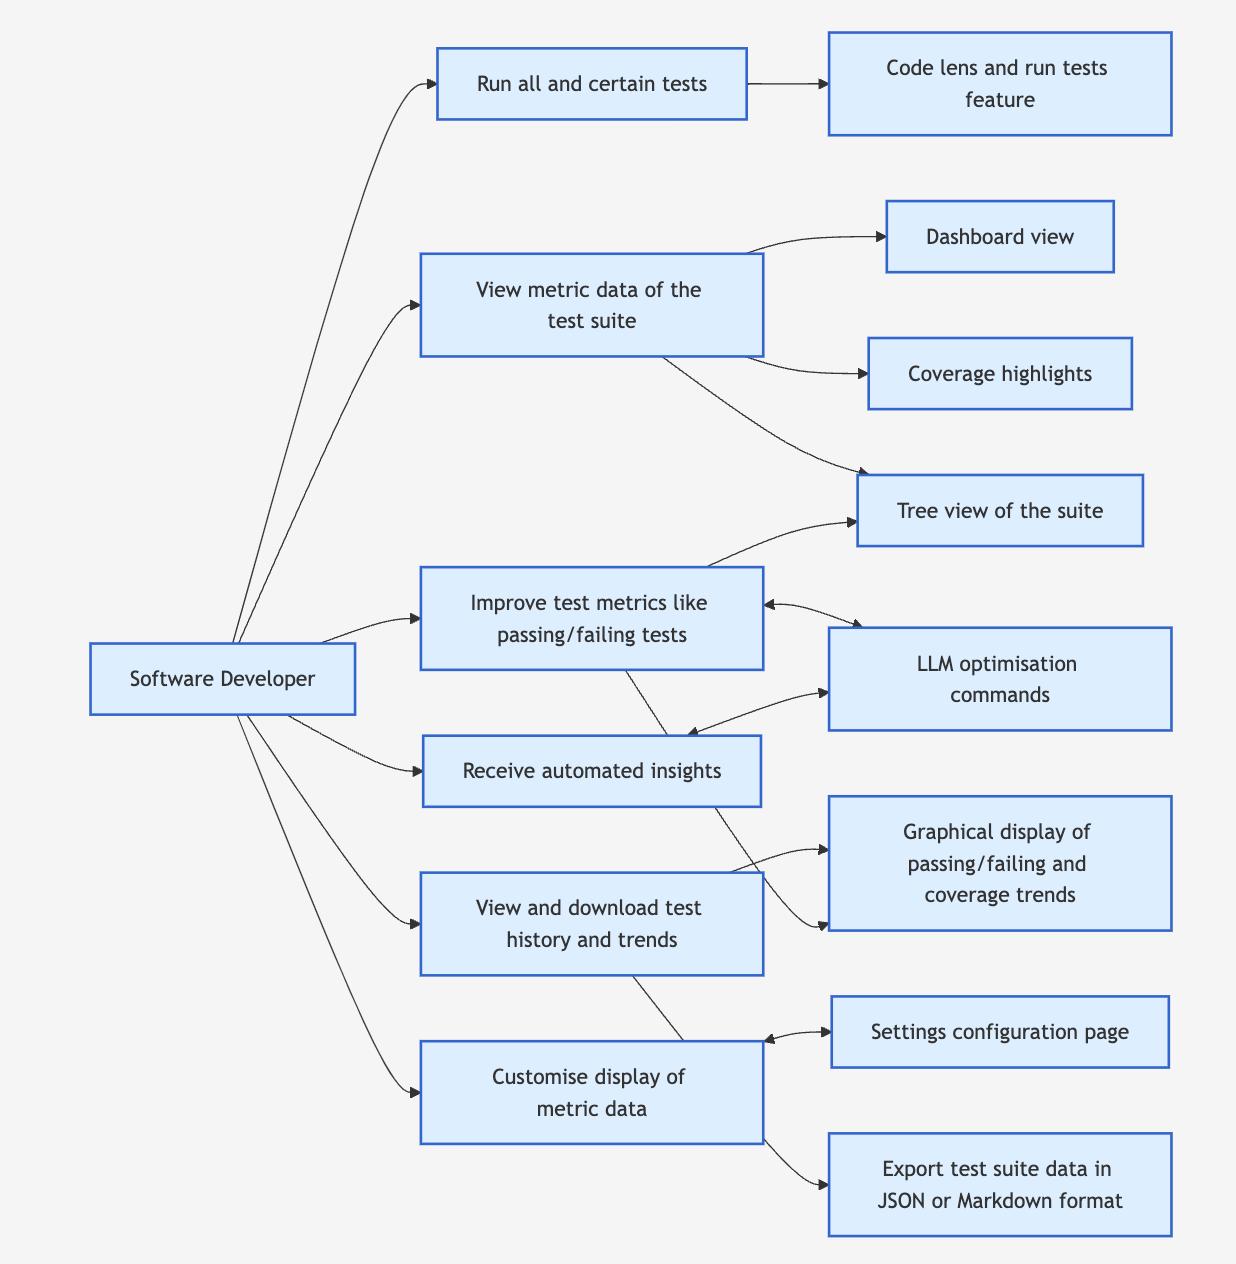
Run all or selected tests |
User |
The user can execute all tests or selectively run tests based on recent changes, ensuring
efficient test execution |
The user has a test suite in their project. |
- The user selects an option to run all tests or particular tests.
- The system executes the selected tests.
- The system updates relevant metrics (e.g., pass/fail rate, execution time) within the
dashboard.
|
Test metrics are updated in the dashboard. |
| UC2 |
View overall test metrics in the dashboard |
User |
The user can view an overview of test suite performance (e.g., passing/failing tests, slowest
tests, memory usage, coverage), highlighting critical metrics at a glance. |
The user has run all the tests at least once, so metrics can be computed. |
- The user opens the test metrics dashboard.
-
The system computes and displays key test metrics, such as:
- Number of passing and failing tests
- Slowest tests
- Most memory-intensive tests
- Overall coverage percentage
- The system displays an overview of test metrics (e.g., pass/fail rate, coverage, memory
usage).
- The user can click on specific metrics to view more detailed information.
|
The user has a clear overview of detailed test metrics. |
| UC3 |
View Coverage annotations in the IDE |
User |
The user can see untested or under-tested areas of the codebase with specific line or module
annotations directly within the IDE itself. |
The system can generate test coverage data. |
- The user opens the IDE and has enabled code coverage visualisation in the extension's
settings.
- The system highlights untested areas directly in the code editor.
|
Coverage insights are visible directly in the editor. |
| UC4 |
View all test metrics on a granular scale |
User |
The user can view all test metrics on a granular scale, via a tree view of the test suite.
|
The system must support a tree view for displaying the test suite.
The user must have run all tests at least once, so metrics can be computed.
|
- The user opens the test metrics dashboard.
- The system computes test metrics for any test cases with changes, and displays these in a
tree view.
- The user can expand/collapse the tree view to view tests that are failing,
memory-intensive, or slow, organised by file.
- The user can click on a test case, and the relevant file containing the code for that test
case will open in the editor.
|
The test metrics are displayed on a granular level via a tree view, and are updated if changes
are made in the test suite |
| UC5 |
Improve test metrics using LLM optimisation commands |
User, LLM Model |
The user can improve test metrics using LLM optimisation commands to enhance test efficiency
and resolve failing cases. |
The user has access to the commands.
The system can generate test optimisation
reccomendations. |
- The system computes metrics for the tests cases in the codebase.
- The system generates suggestions based on the selected command for that partiuclar metric.
- The user can accept or reject the suggestion.
- The system applies the accepted suggestion.
|
The test suite is optimised based on user-accepted changes. |
| UC6 |
View trends through a graphical display |
User |
The user can see trends (e.g., coverage, failing tests) through graphical visualisations. |
The system has collected the relevant data for trends (e.g., coverage, failing tests).
The system has processed it available for visualisation.
|
- The user opens the test metrics dashboard and clicks an option to view a specific trend.
- The system computes and displays trends over time for the chosen metric (i.e. coverage or
failing tests).
- The user can view the trends in graphical form, and can interact with the graphical
display, such as hovering to get more details.
|
The user has successfully viewed trends through a graphical display. |
| UC7 |
Download and export test suite data |
User |
The user can download/export test data in Markdown or JSON format for documentation. |
Test metric data exists within the system. |
- The user selects the export option from the dashboard.
- The system prompts the user to choose a format (Markdown or JSON), and select the location
to save the file.
- The user confirms the export.
- The system generates and saves the exported file in the selected format.
|
Logs about the test metric are successfully exported in the chosen format and saved in the
specified location. |
| UC8 |
Customise metric display |
User |
The user can configure how test metrics are displayed within the dashboard, such as specifying
the number of slowest and memory-intensive tests to display, and whether results are updated
each time a file is saved or after a set interval. |
The settings page is accessible to the user. |
- The user opens the settings page.
- The user customises the display of test metrics, for example specifying:
- The number of slowest tests to display.
- The number of memory-intensive tests to display.
- Whether to update metrics on file save or after a set interval.
- The system applies and saves the preferences.
|
The user's display settings are successfully updated and applied. |


