User Manual
-
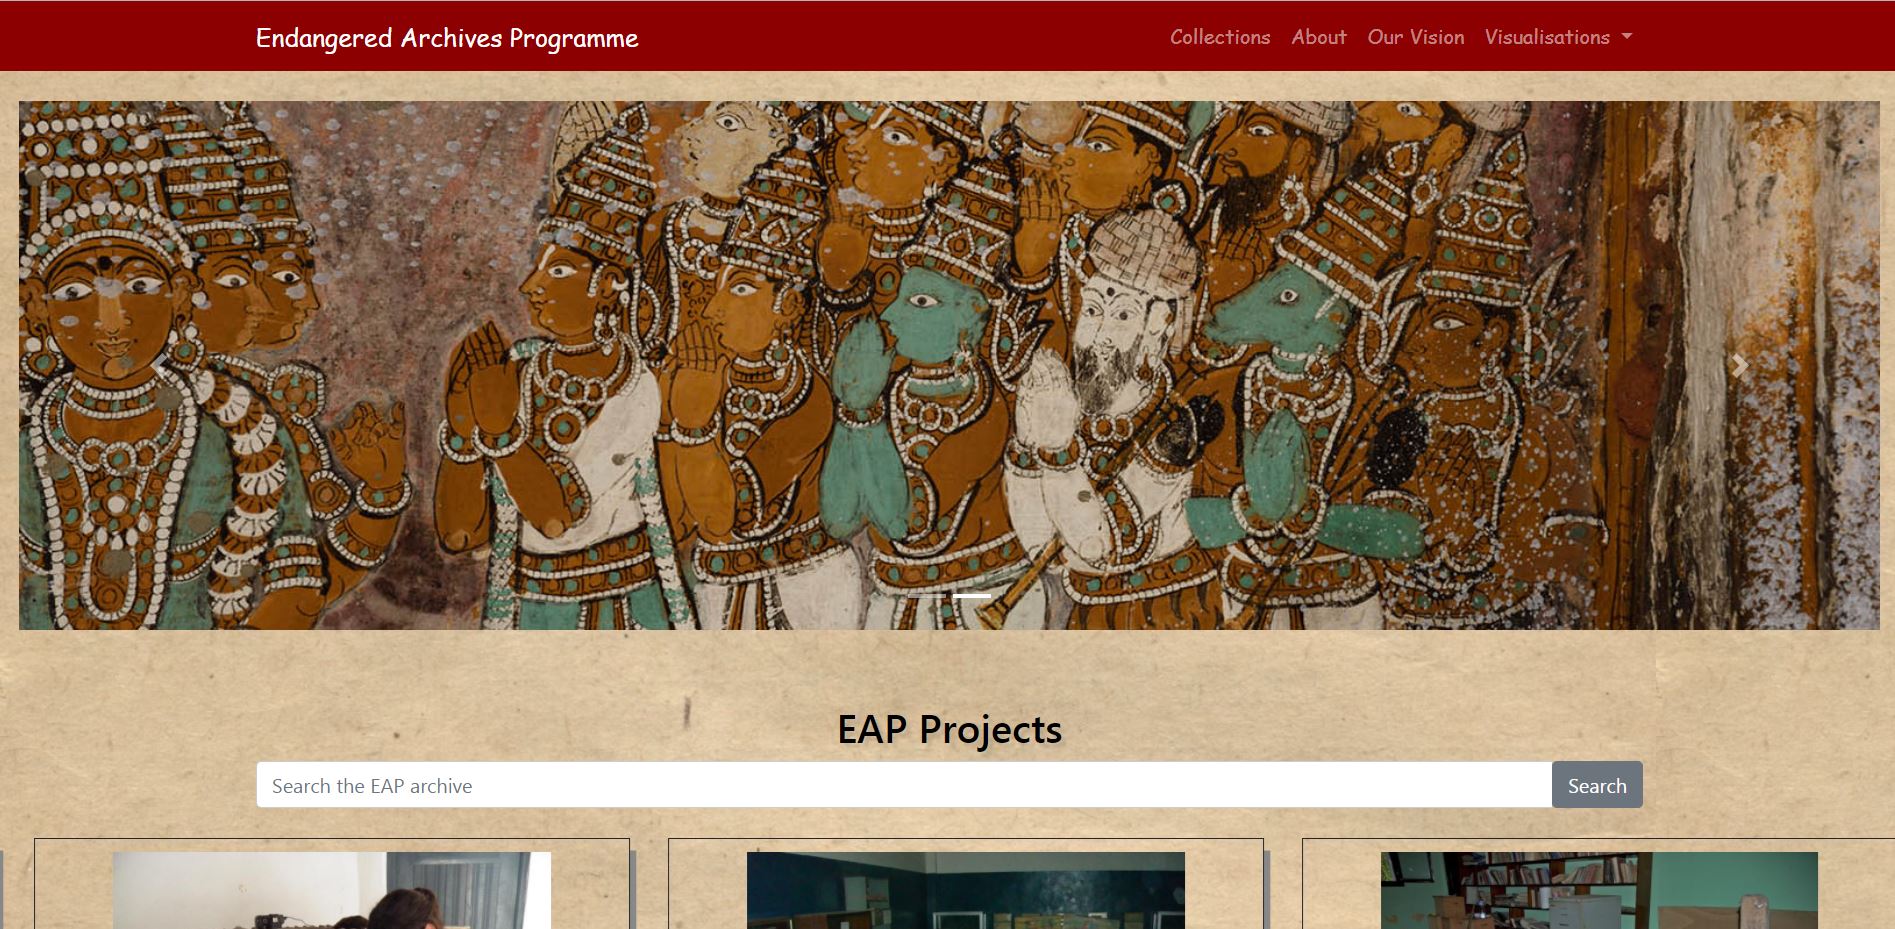
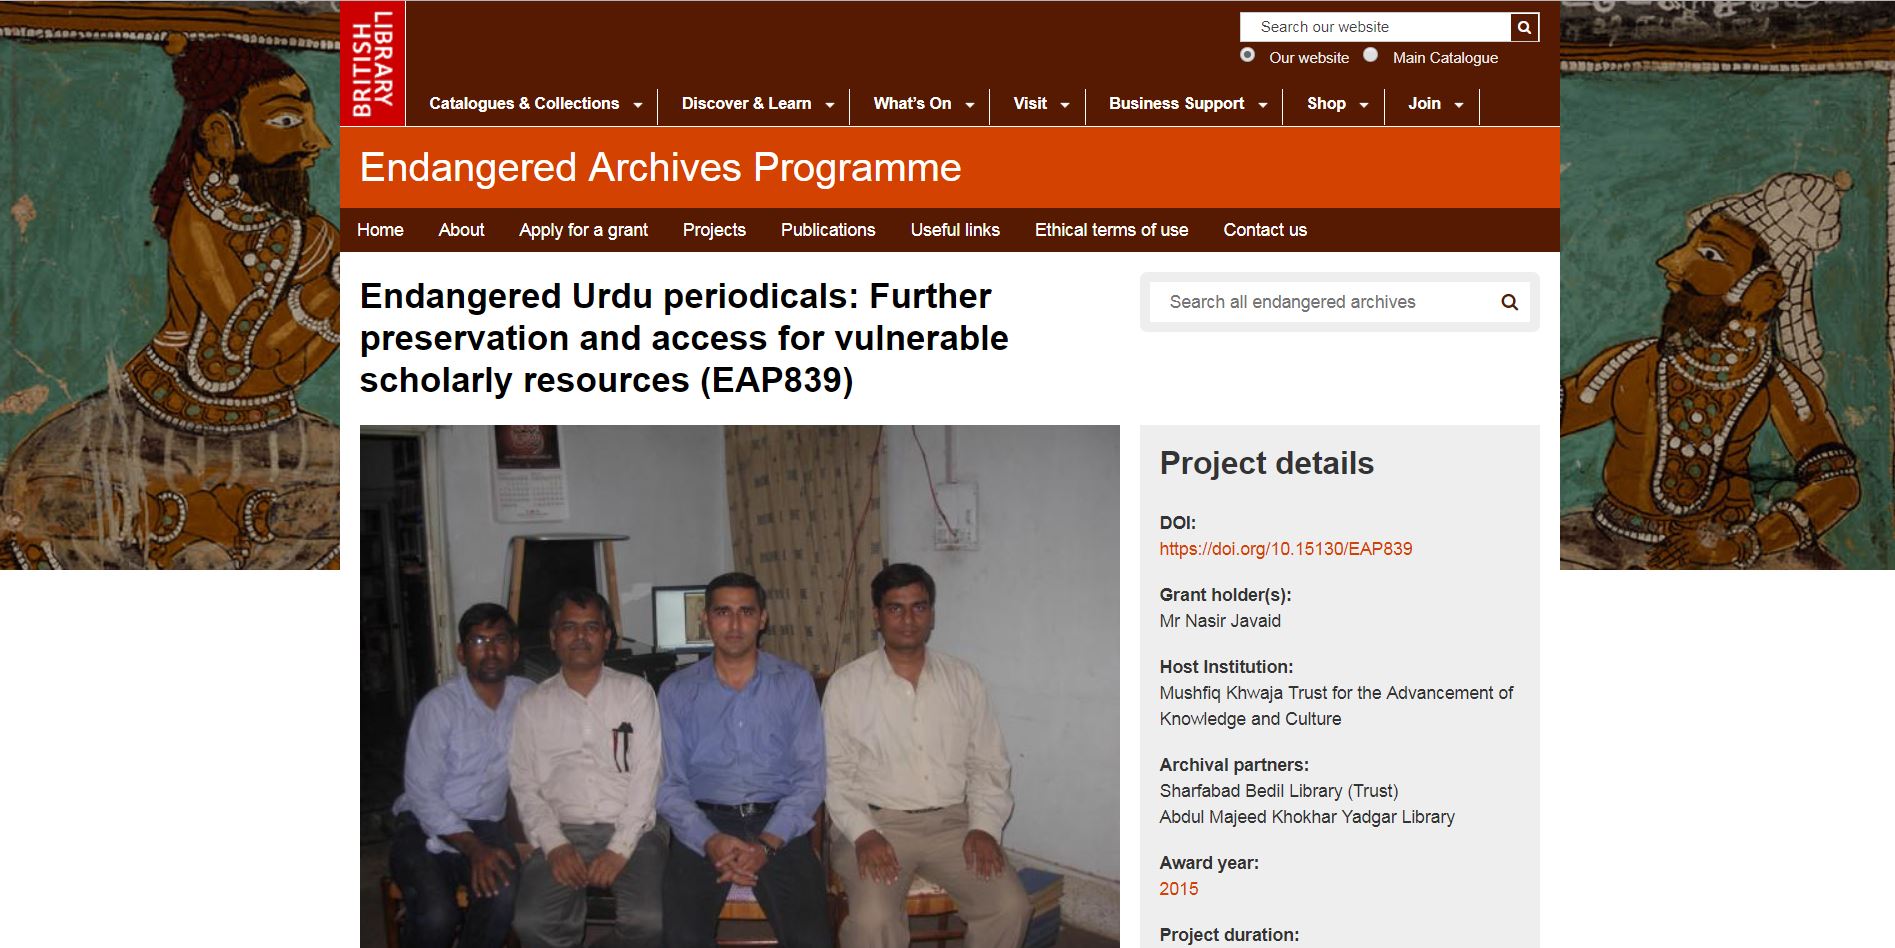
Open up the webiste at: The homepage will be displayed
-
The navbar has the following options: Endangered Archives Programme , Collections , About us, Our vision and Visualisations.

-
Clicking on the Endangered Archives Programme will lead you back to the home page.
-
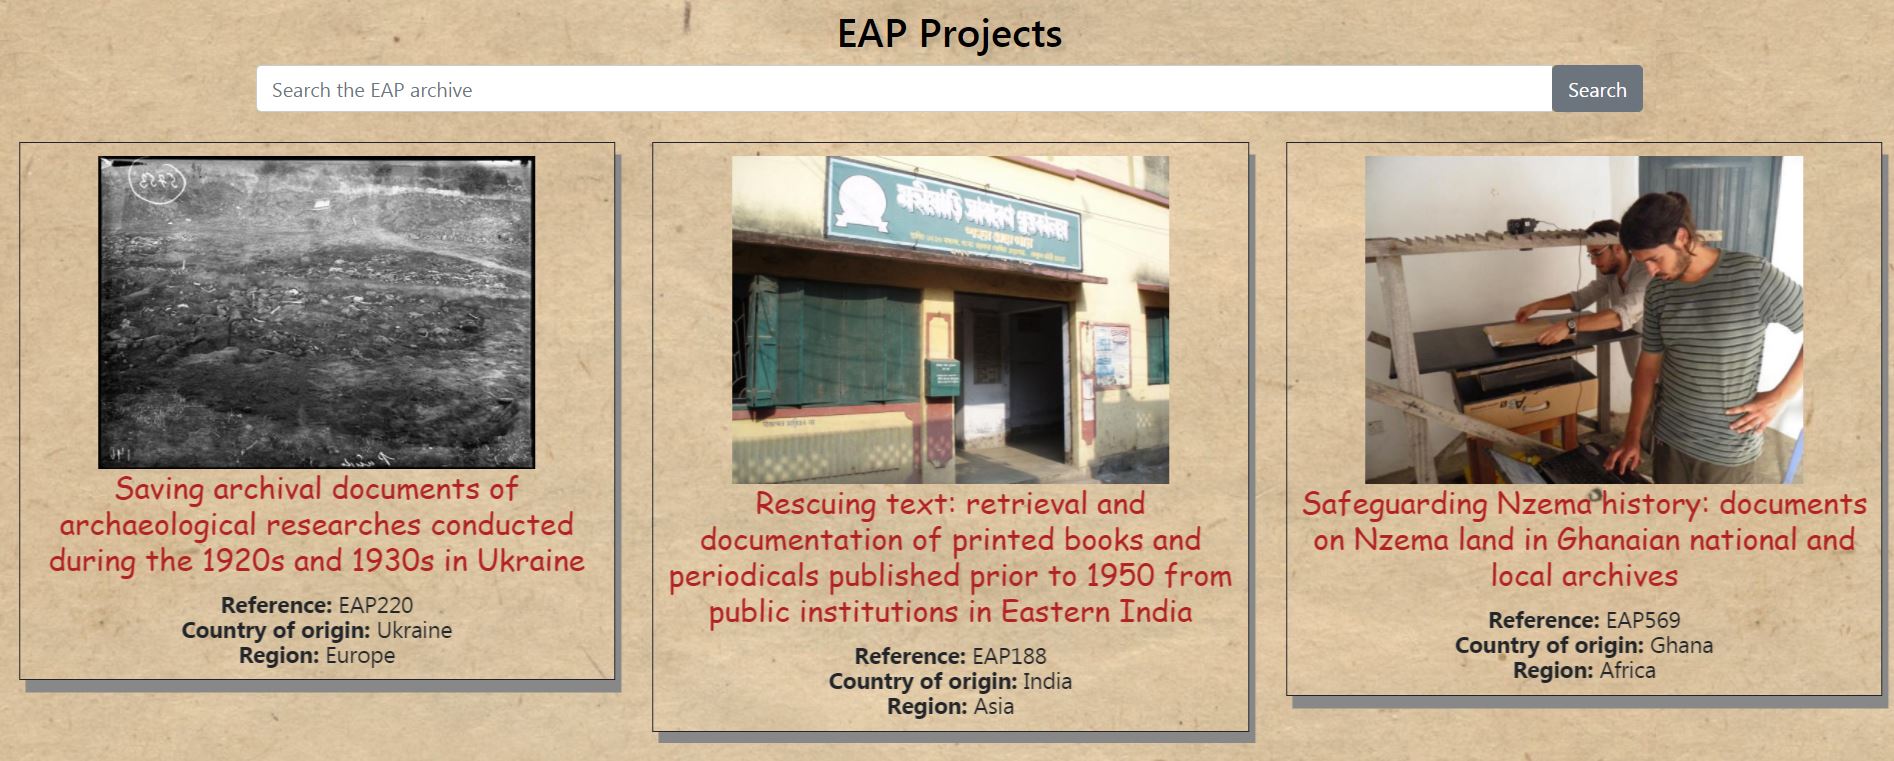
Clicking on collections will lead you to this part of the page, where each time 8 random collections are displayed.
-
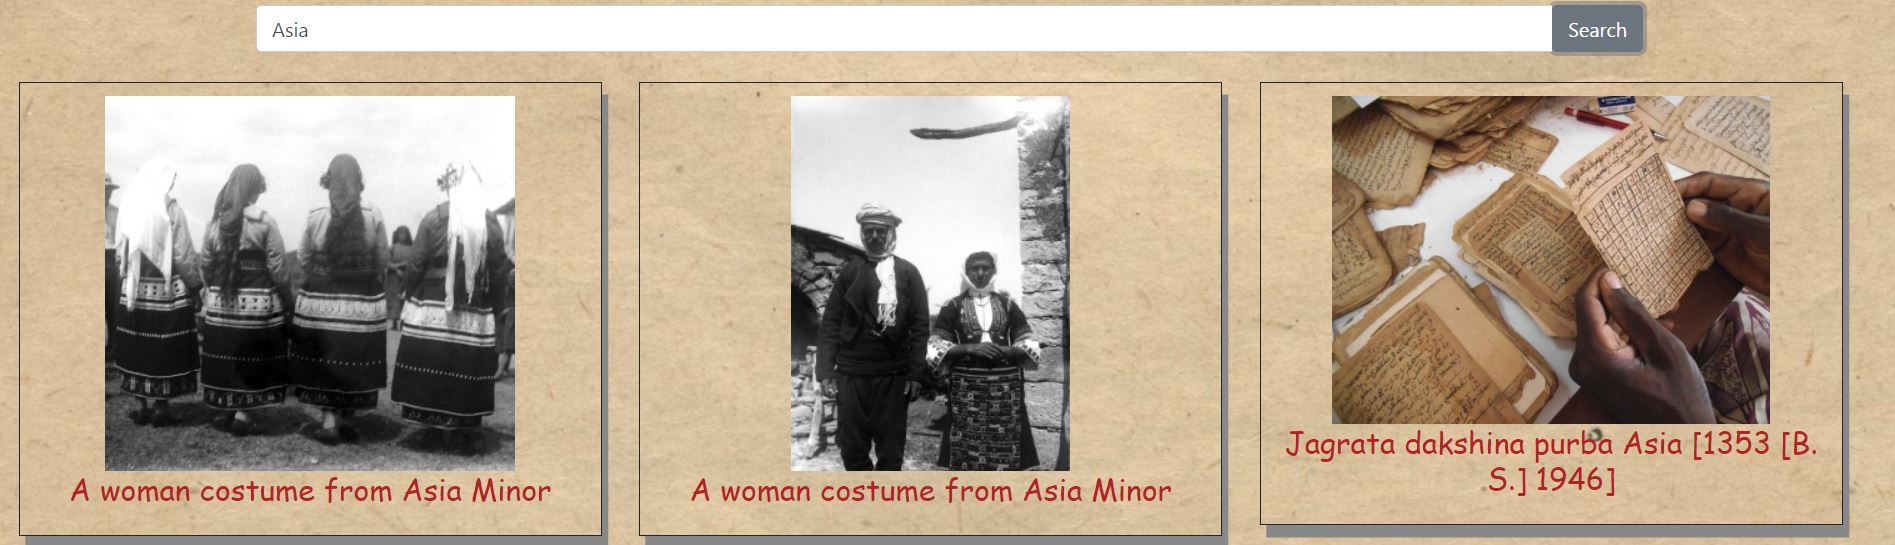
There is also a search function which allows to search through the database. At the moment our search bar allows only full word searches. Searching for Asia will display the following screen, where three randomly picked entries from the database will be displayed.
-
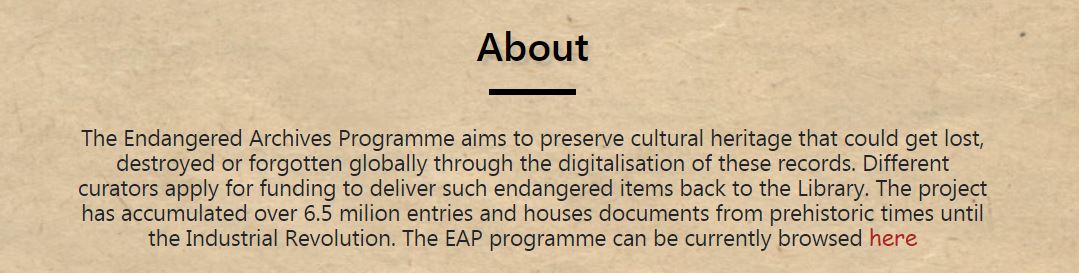
Clicking the About part will lead you to this part, where a small overview of the work the EAP program is doing can be found.
-
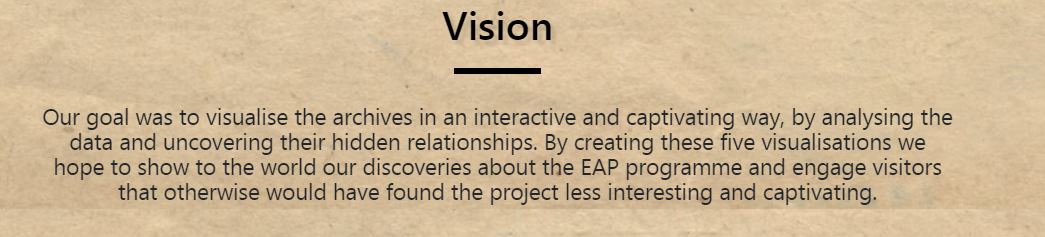
The Our vision part, will lead you to this part of the homepage, where we give a brief overview of the work our Team has done and what our aim in creating this web-app was.
-
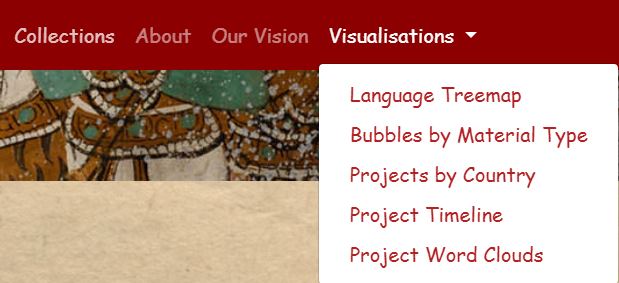
Finally clicking on the visualisations button, a drop-down menu will appear with the following options: Languages Treemap, Bubbles by Material Type, Projects by Country, Project Timeline, Project Word Clouds.
First of all there is the Languages Treemap. Clicking on it the user will get redirected to this page.
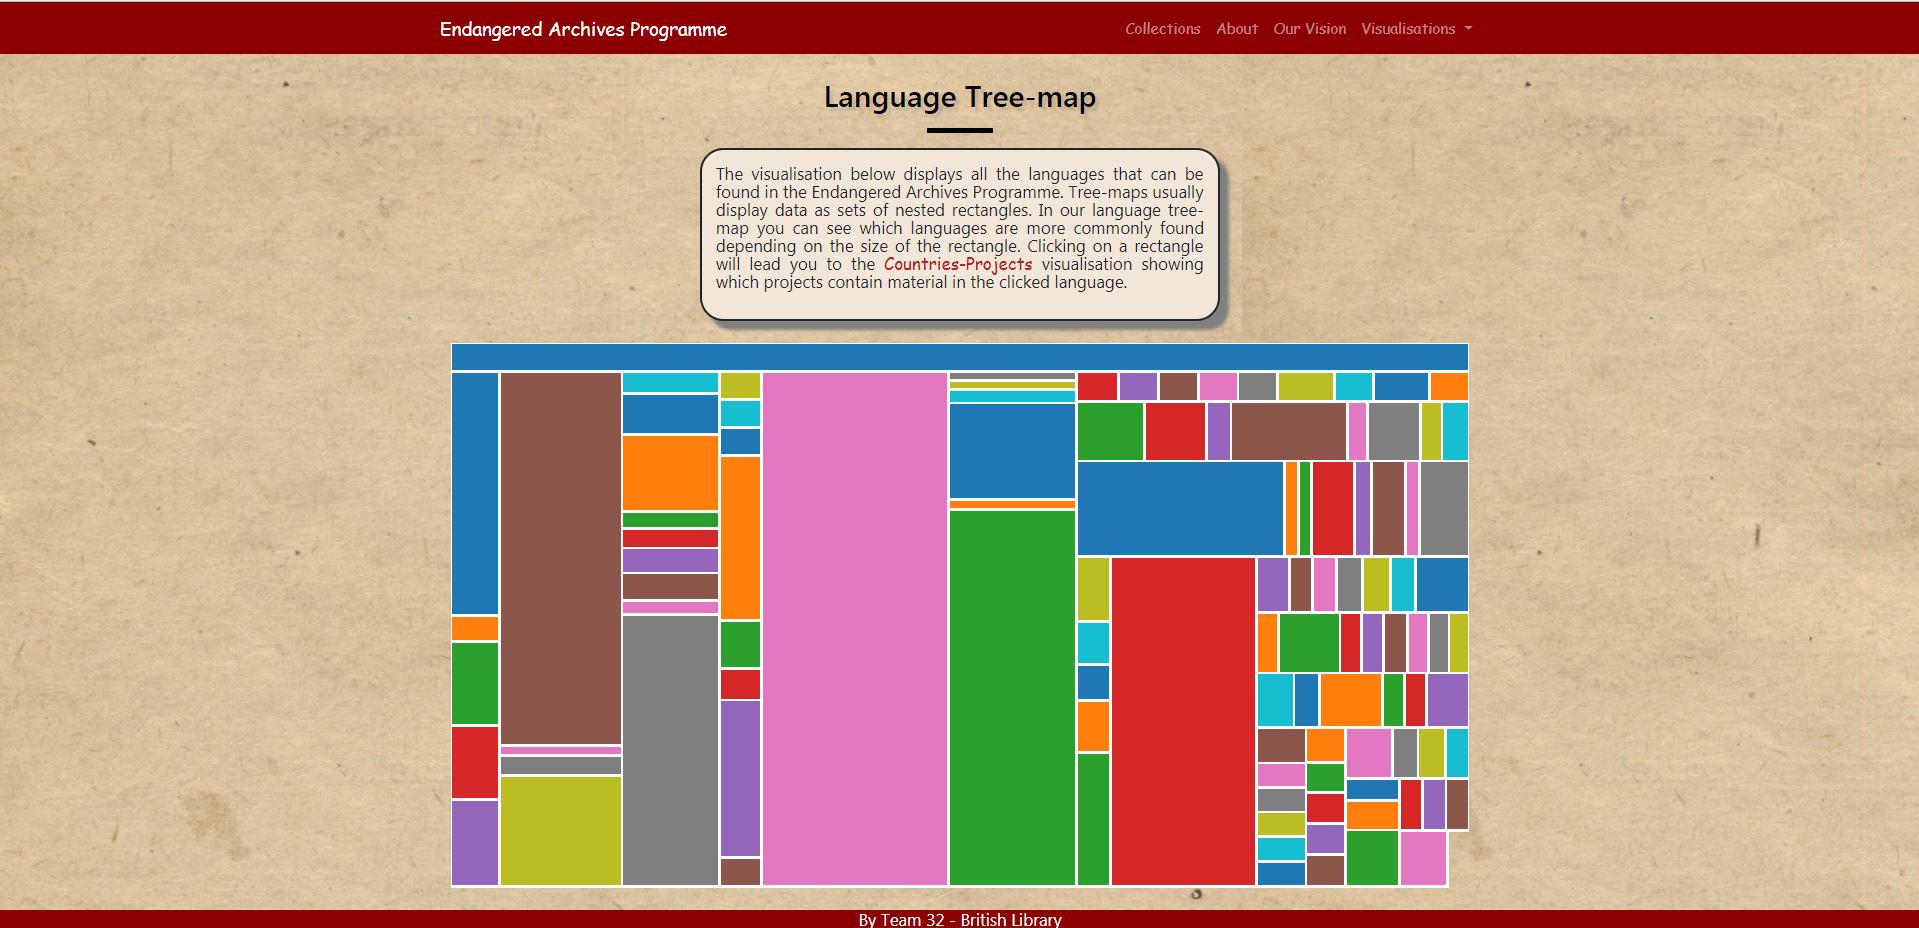
As stated by the description, this is a visualisation that displays all the languages to be found in the archives in terms of frequency, where each square’s size represents its frequency in the Archives Database.
Hovering above each square the user can see the following info from a tooltip: langage the square represents and its frequency in the database.
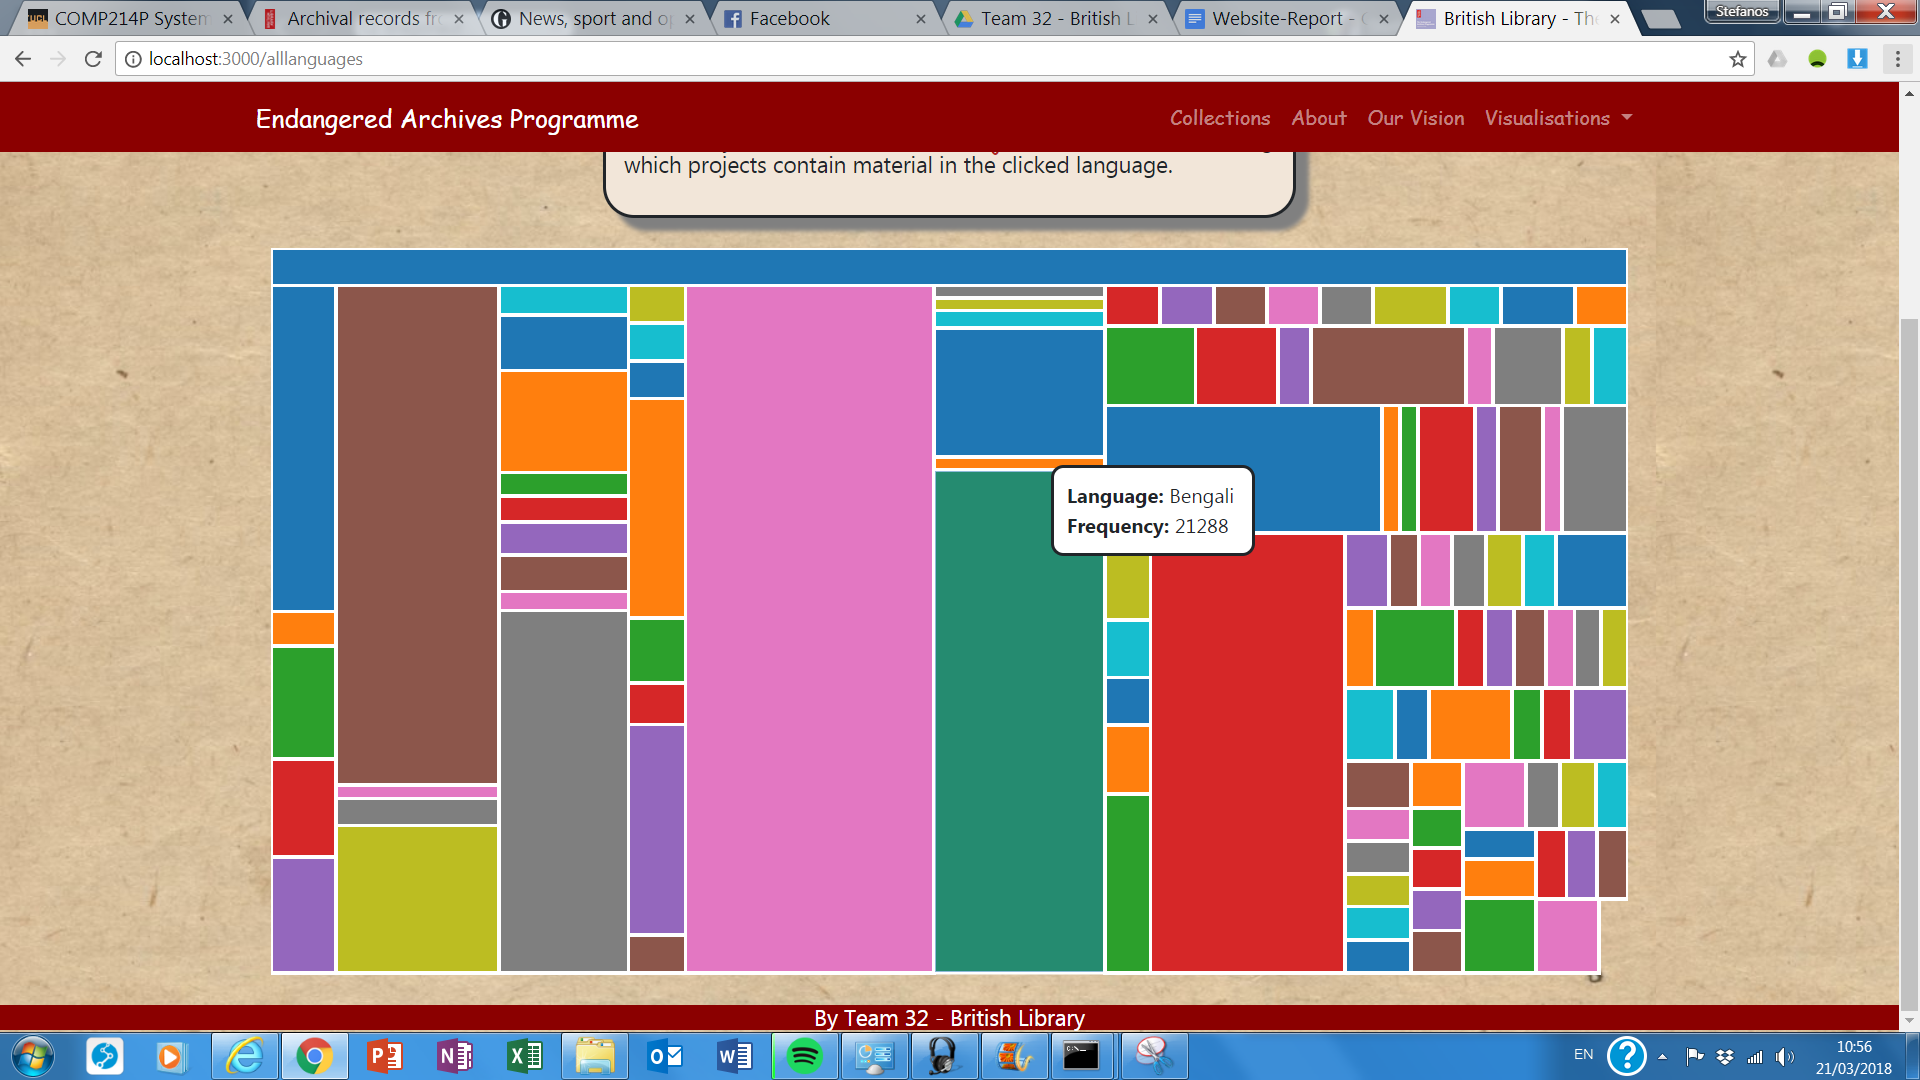
Clicking on a language will redirect the user to another visualisation namely the Projects by Country.
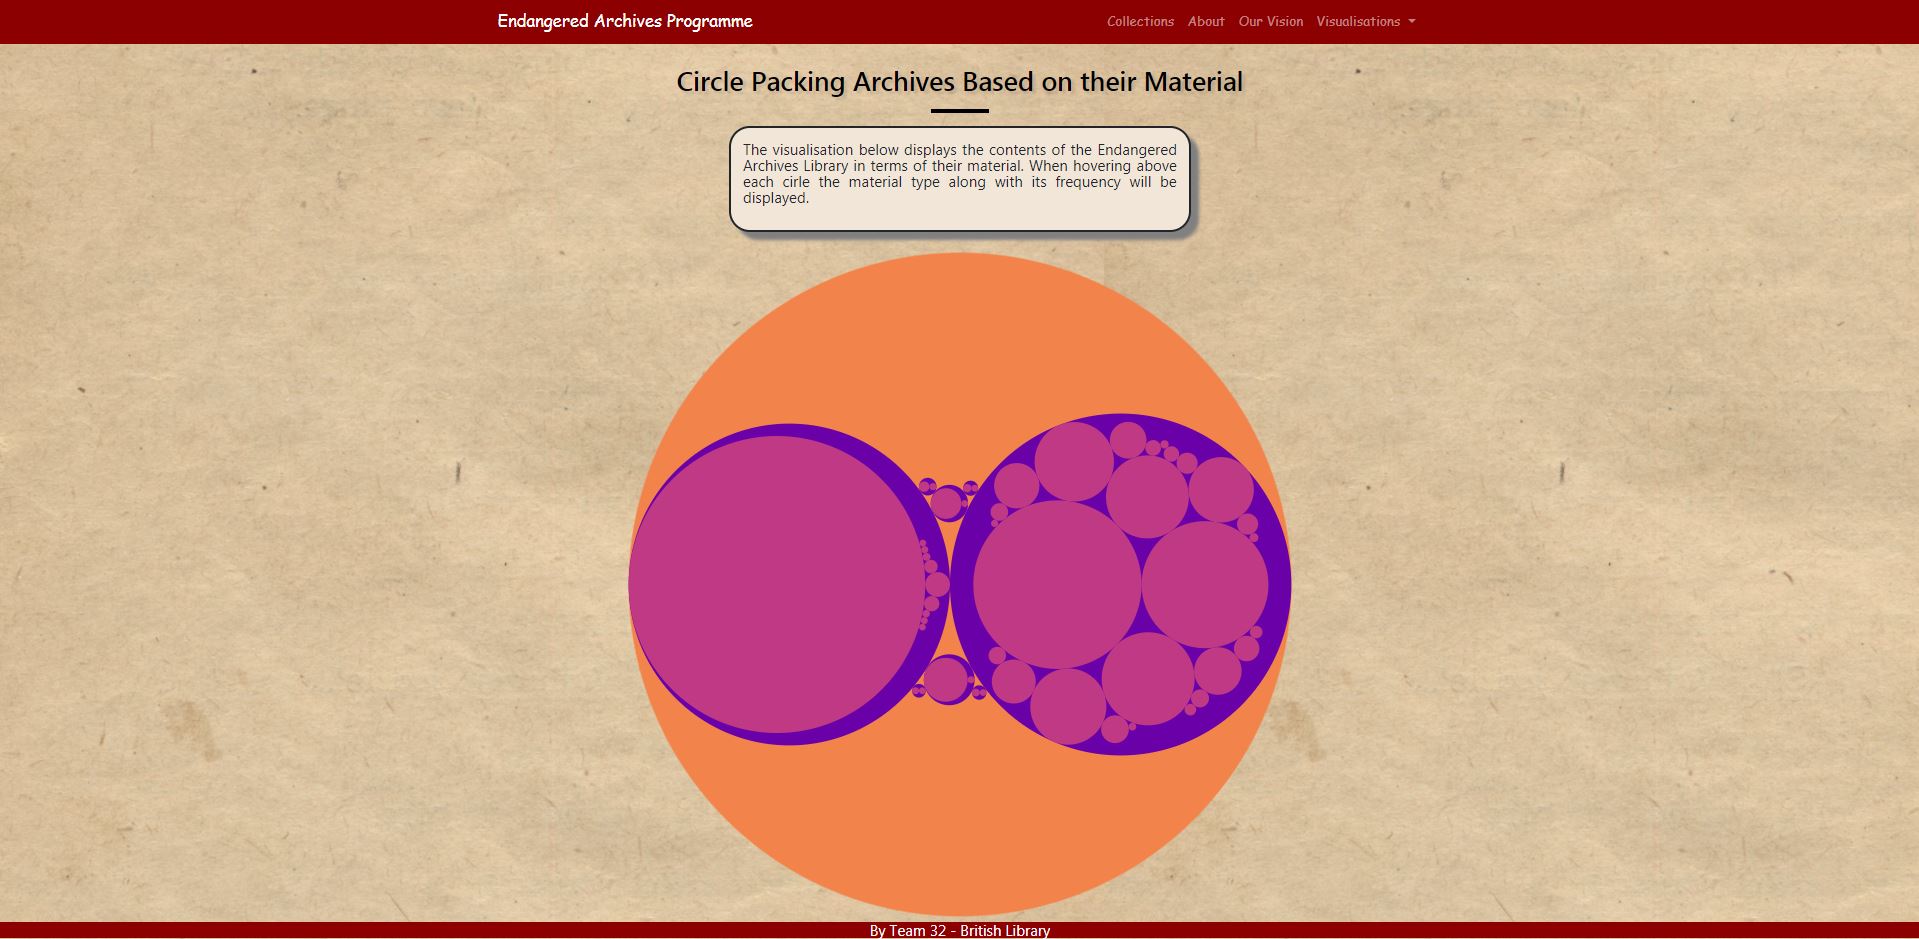
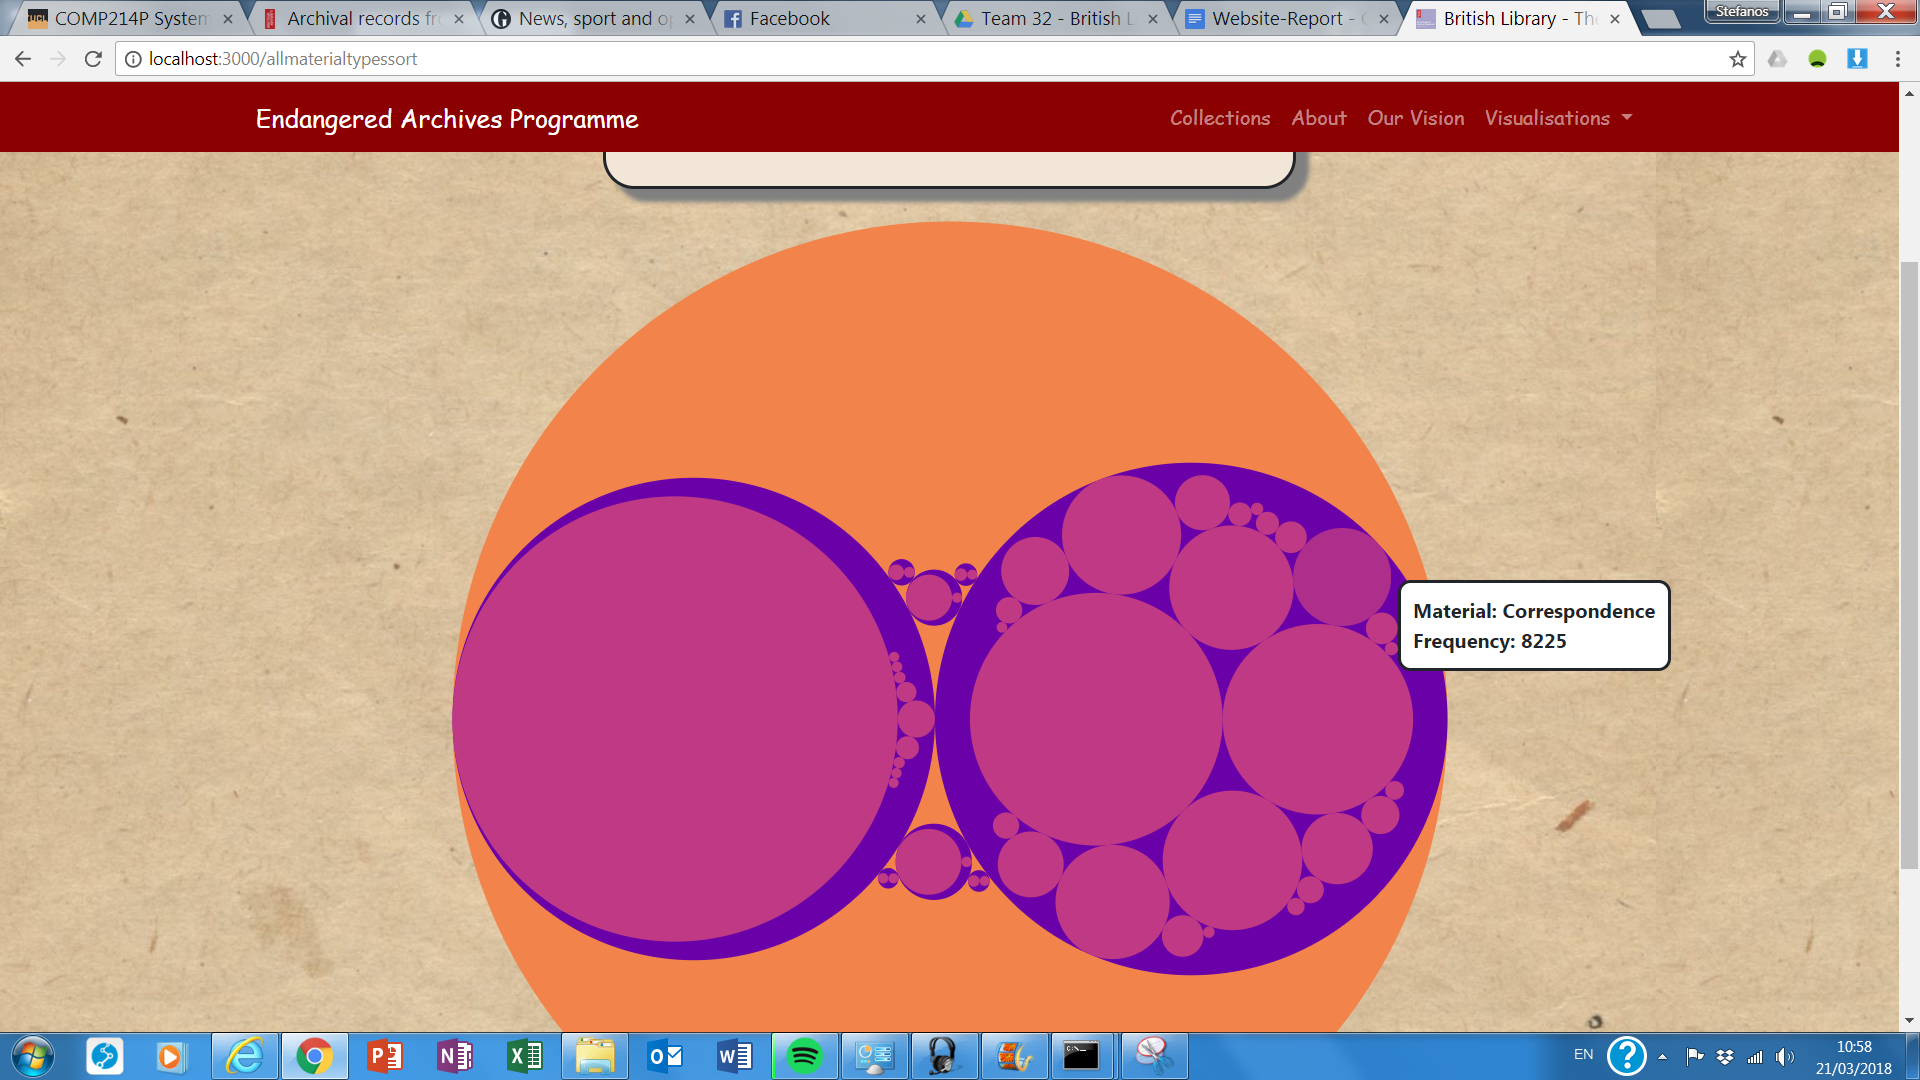
Secondly, the user can select Bubbles by Material Type and will get redirected to the following page.
-
In here, we have clustered the data into three levels in terms of their material.
Again when hovering above each circle, a tooltip will display the material type and its frequency in the database.
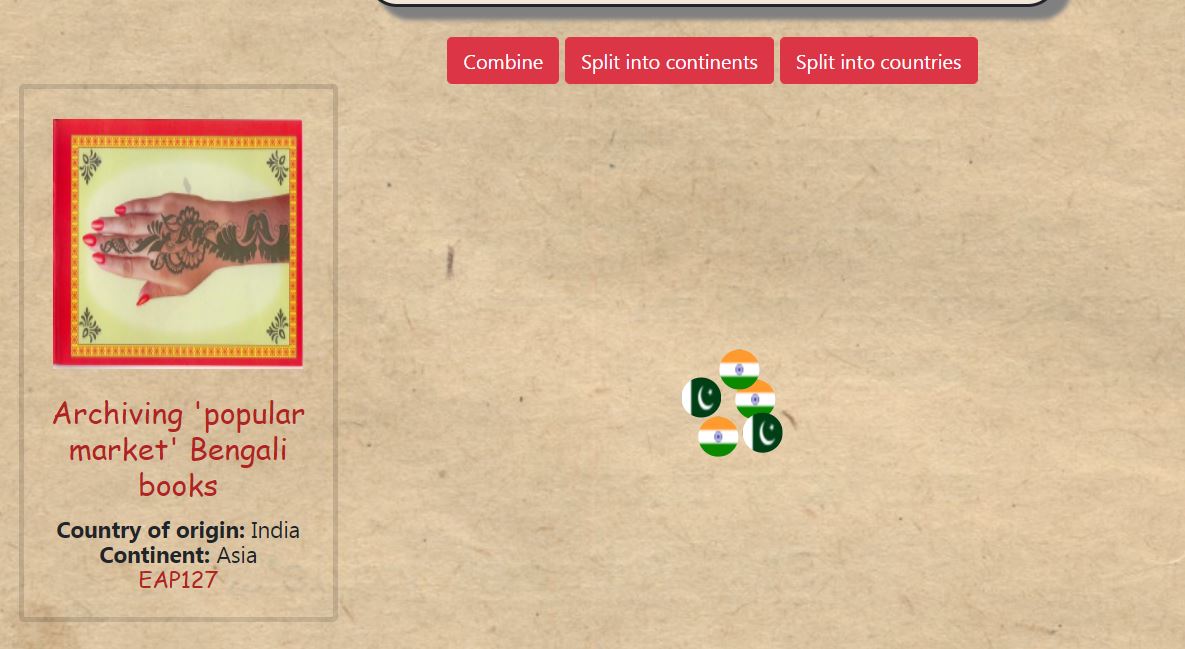
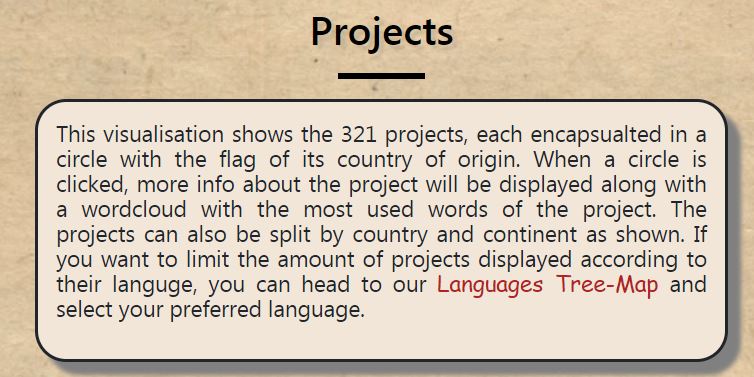
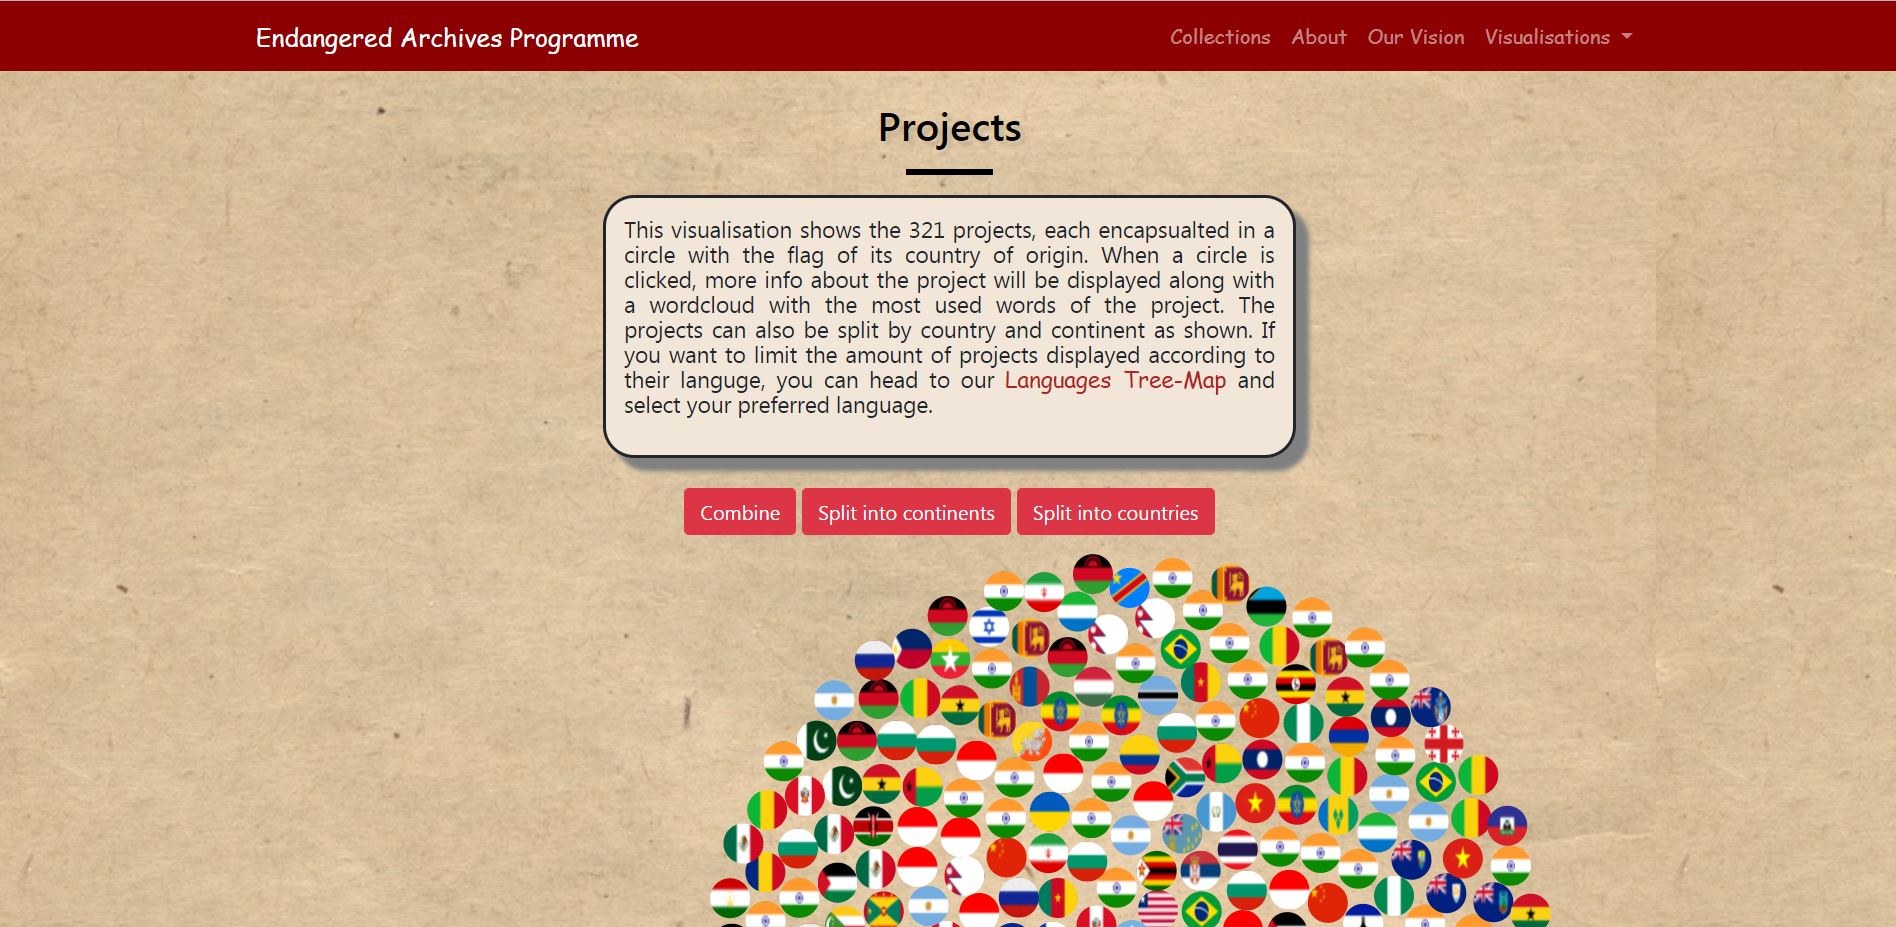
Our third visualisation is Projects by country.
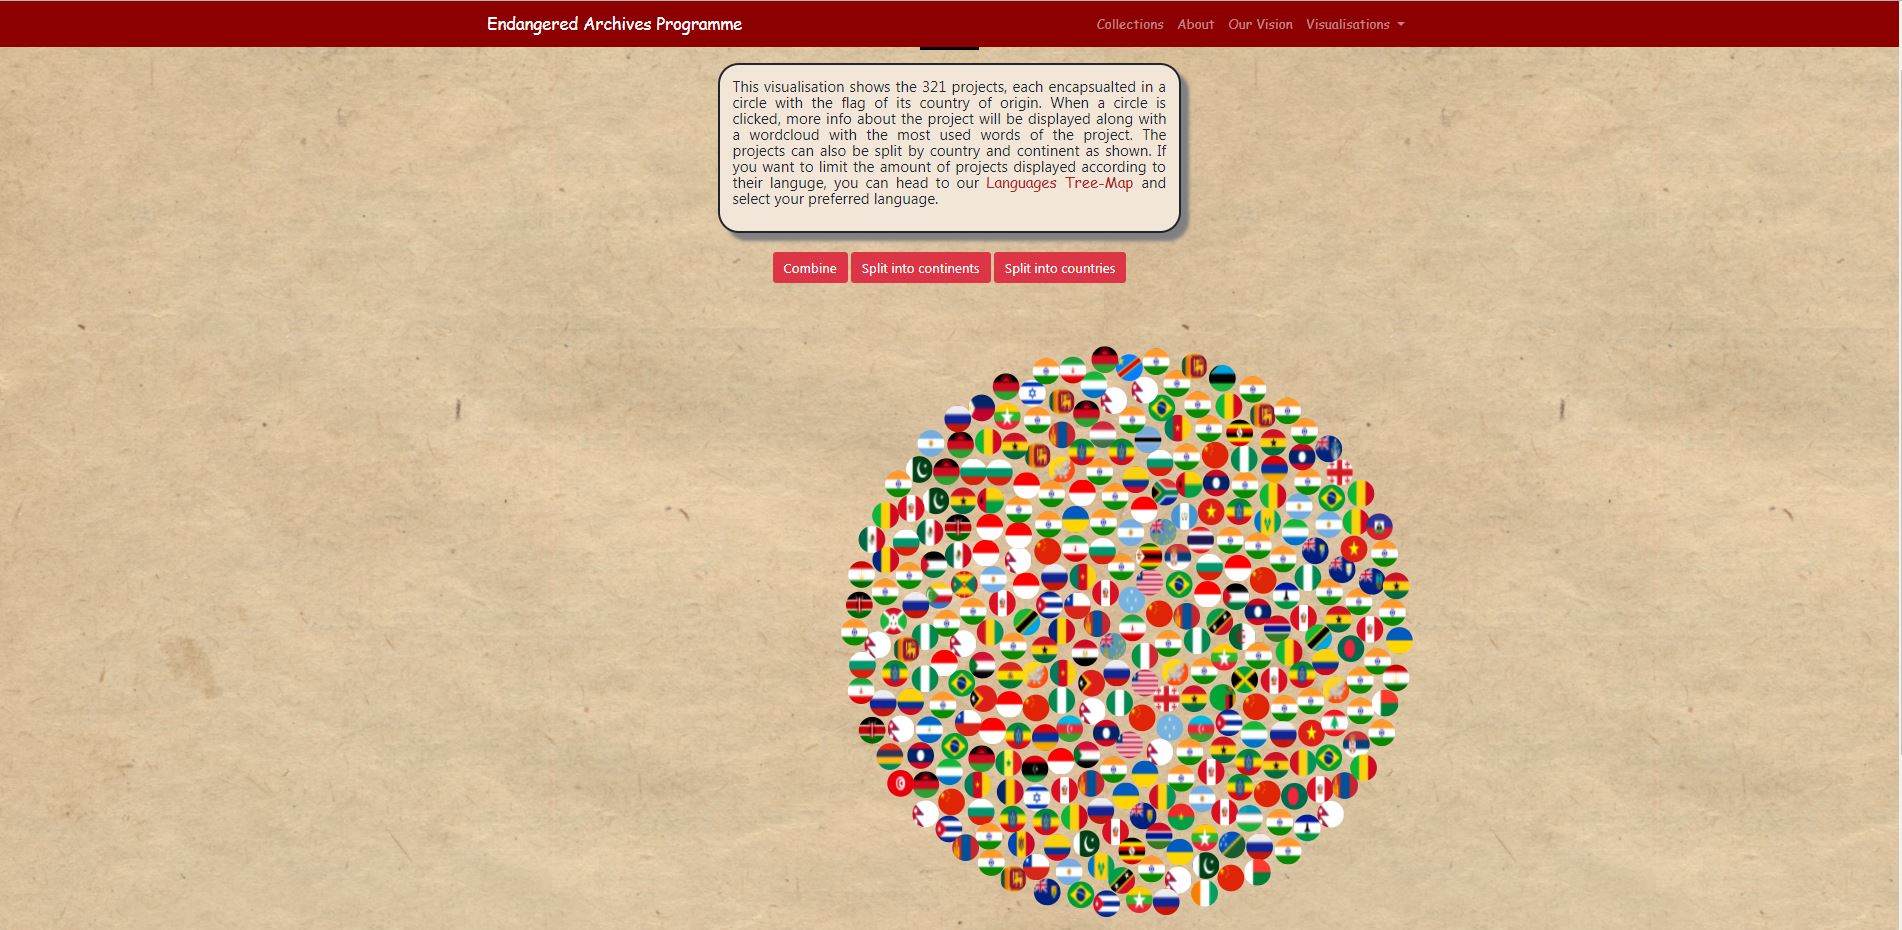
Each circle represents one of the 321 projects of the EAP collection, and is filled with the country's flag where it has originated.
This is the visualisation the user will get redirected to when he clicks on a language on the Language Treemap.
-
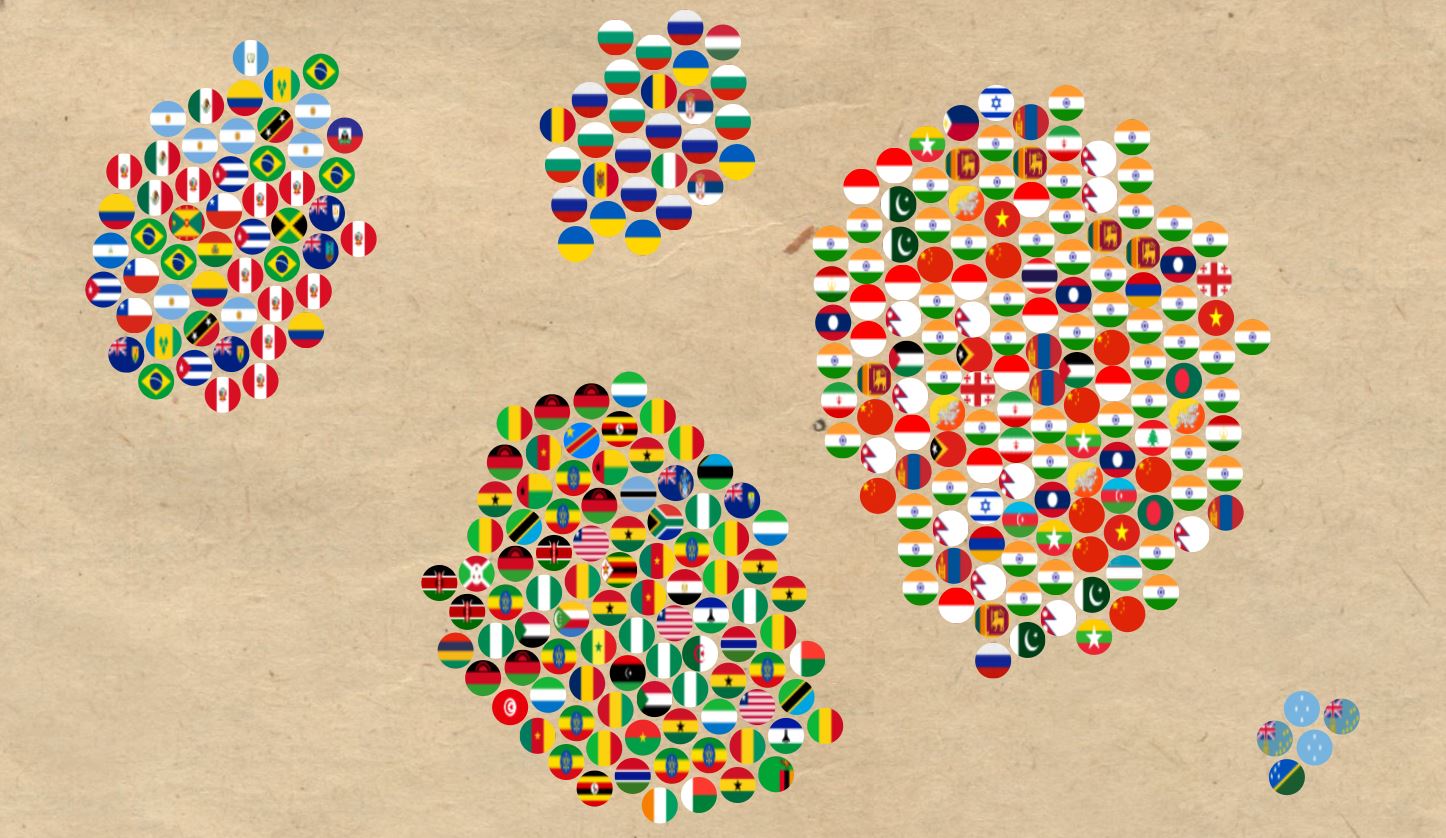
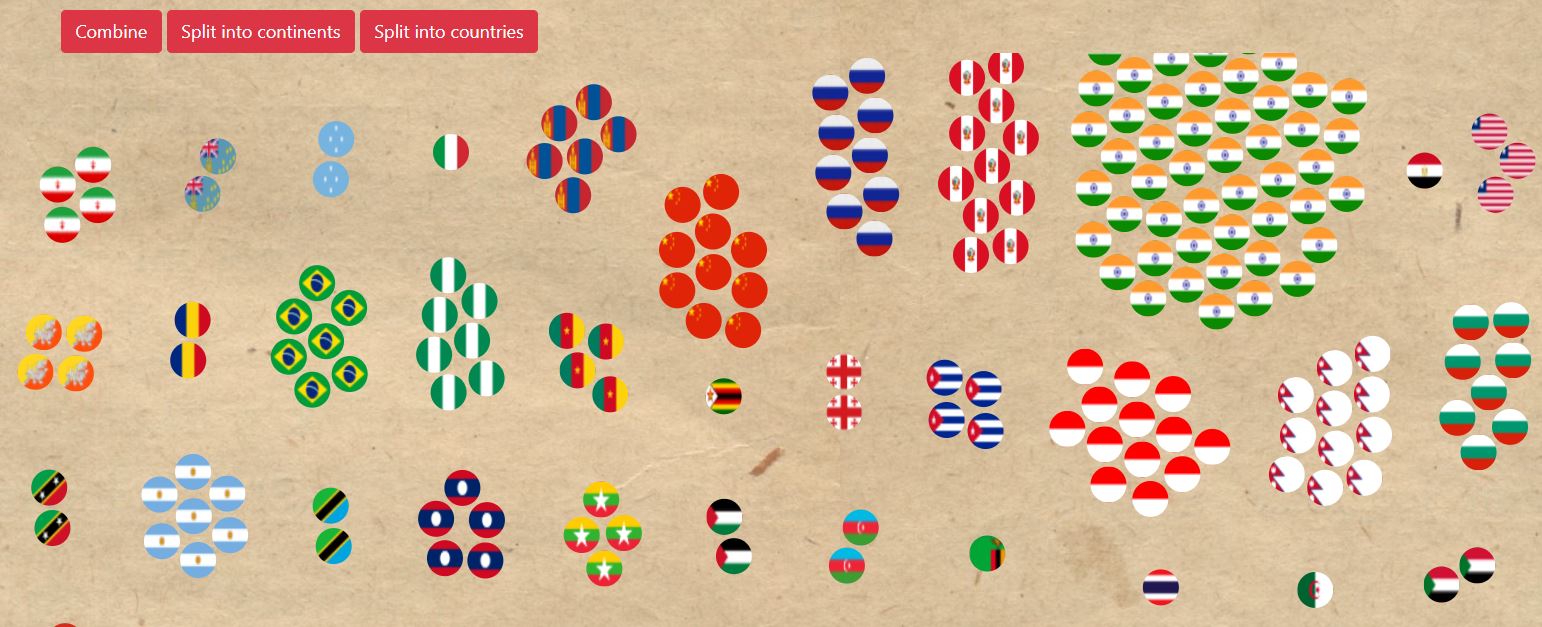
The user can split the projects to continents by clicking the Split into continents button
-
The user can split the projects to countries by clicking the Split into countries button
-
All the projects can be combined by pressing the combine button.
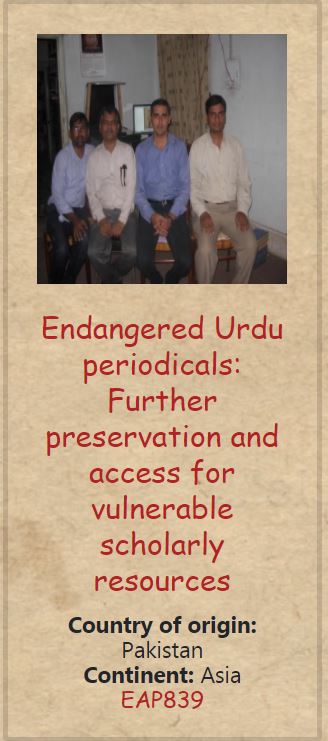
When clicking on a circle a new card will be displayed with the following info: A picture of the Project, and the project’s title, country and continent of origin as well as its reference.
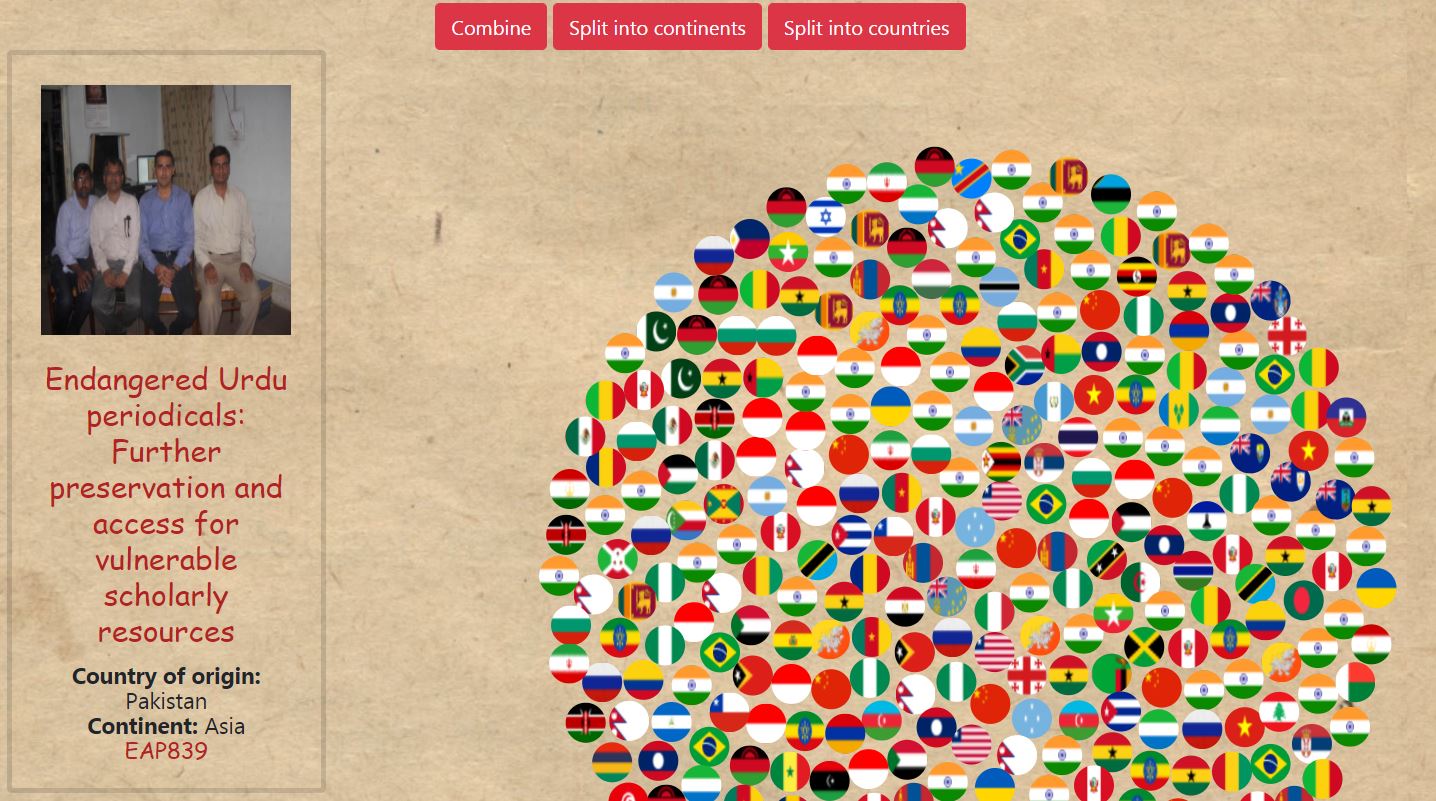
The user can click on the project’s title or reference and be redirected at the official EAP site.
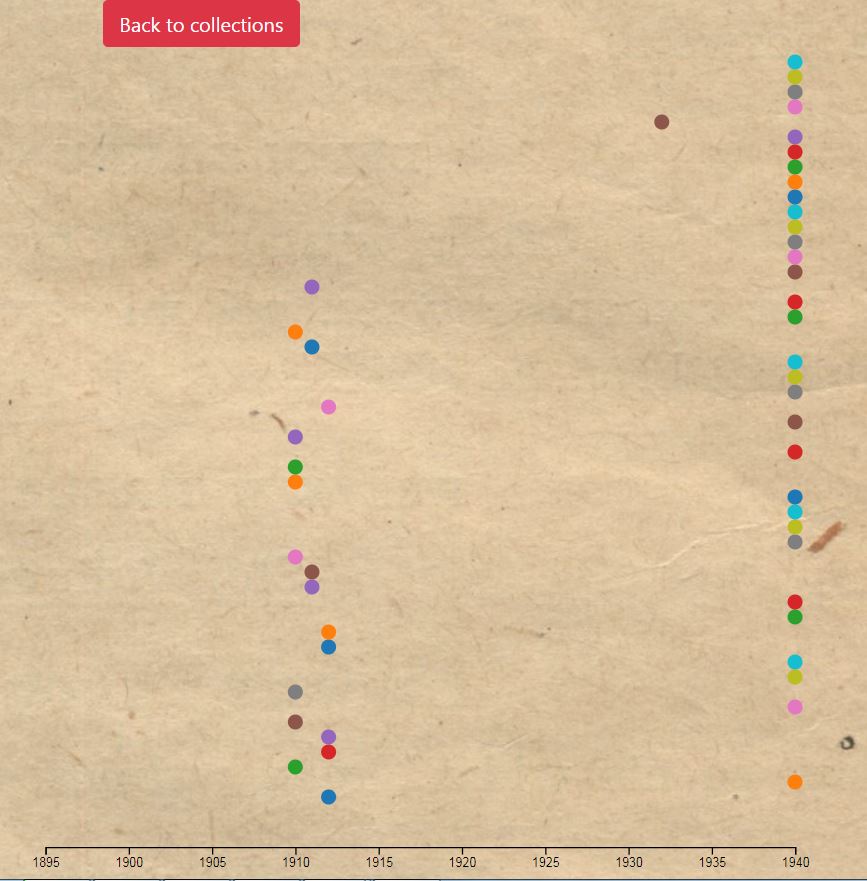
Fourthly, there is the project timeline visualisation. The user will see the following screen
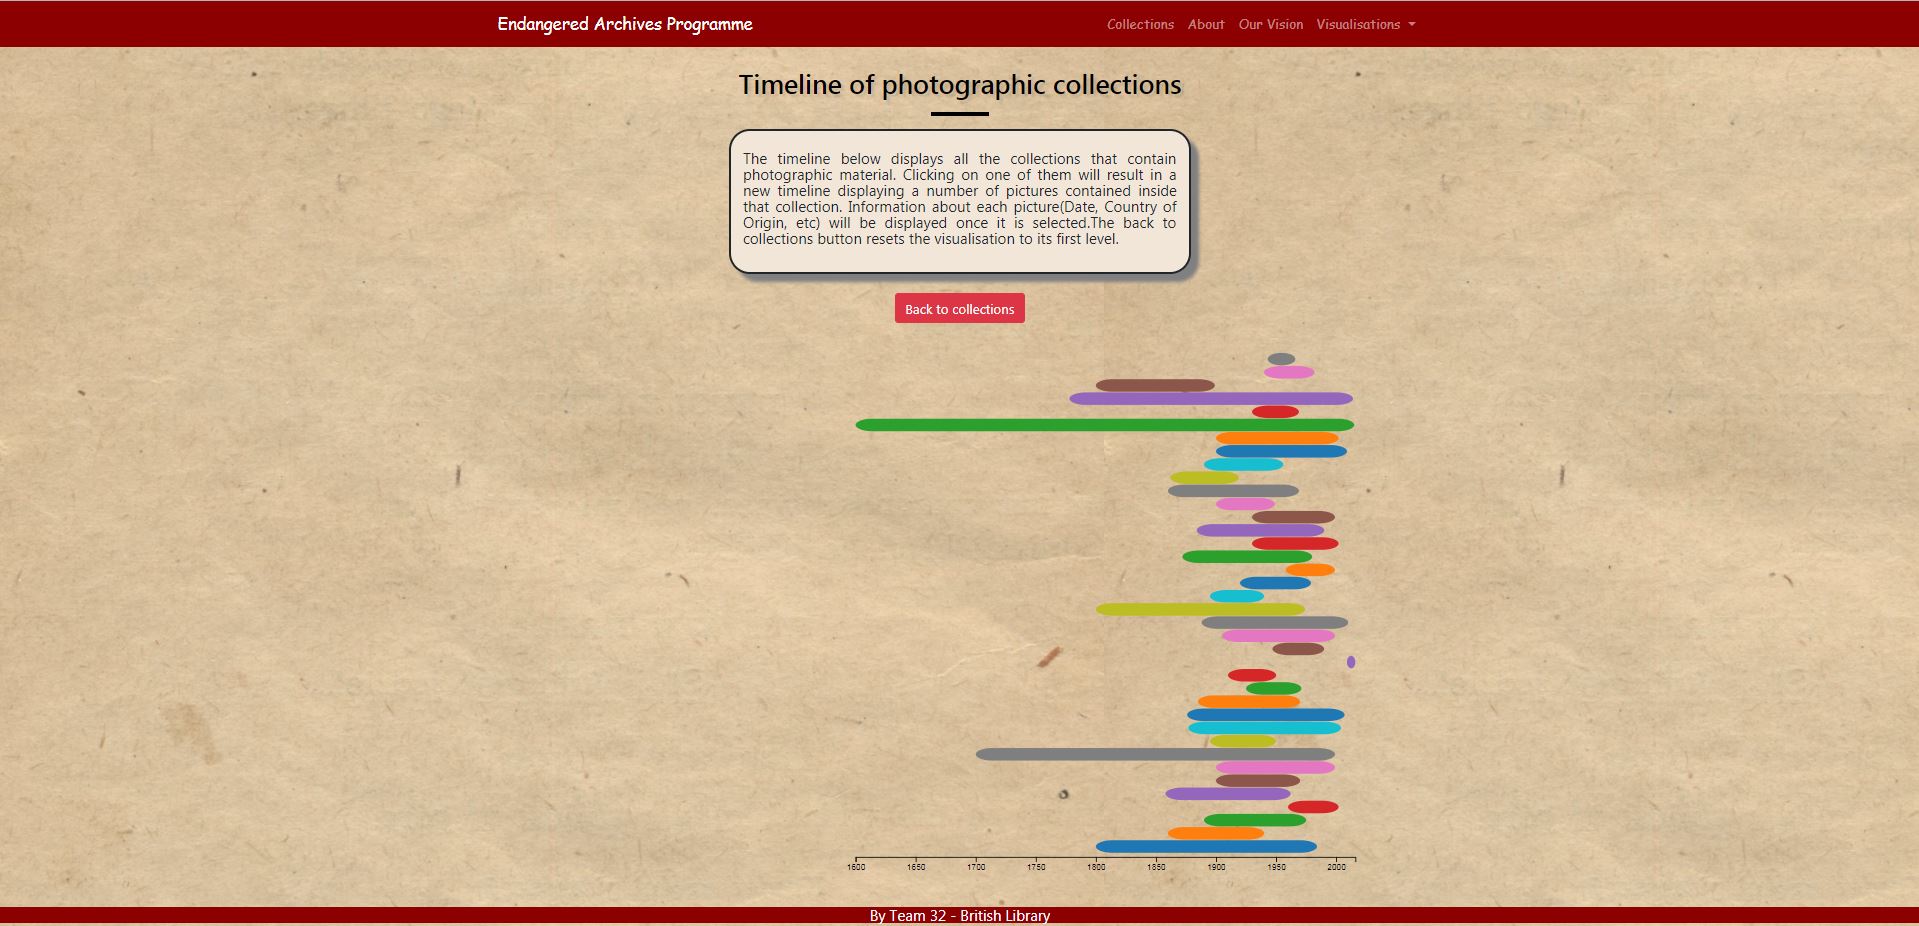
We have taken all projects that contain images and plotted them on a timeline.
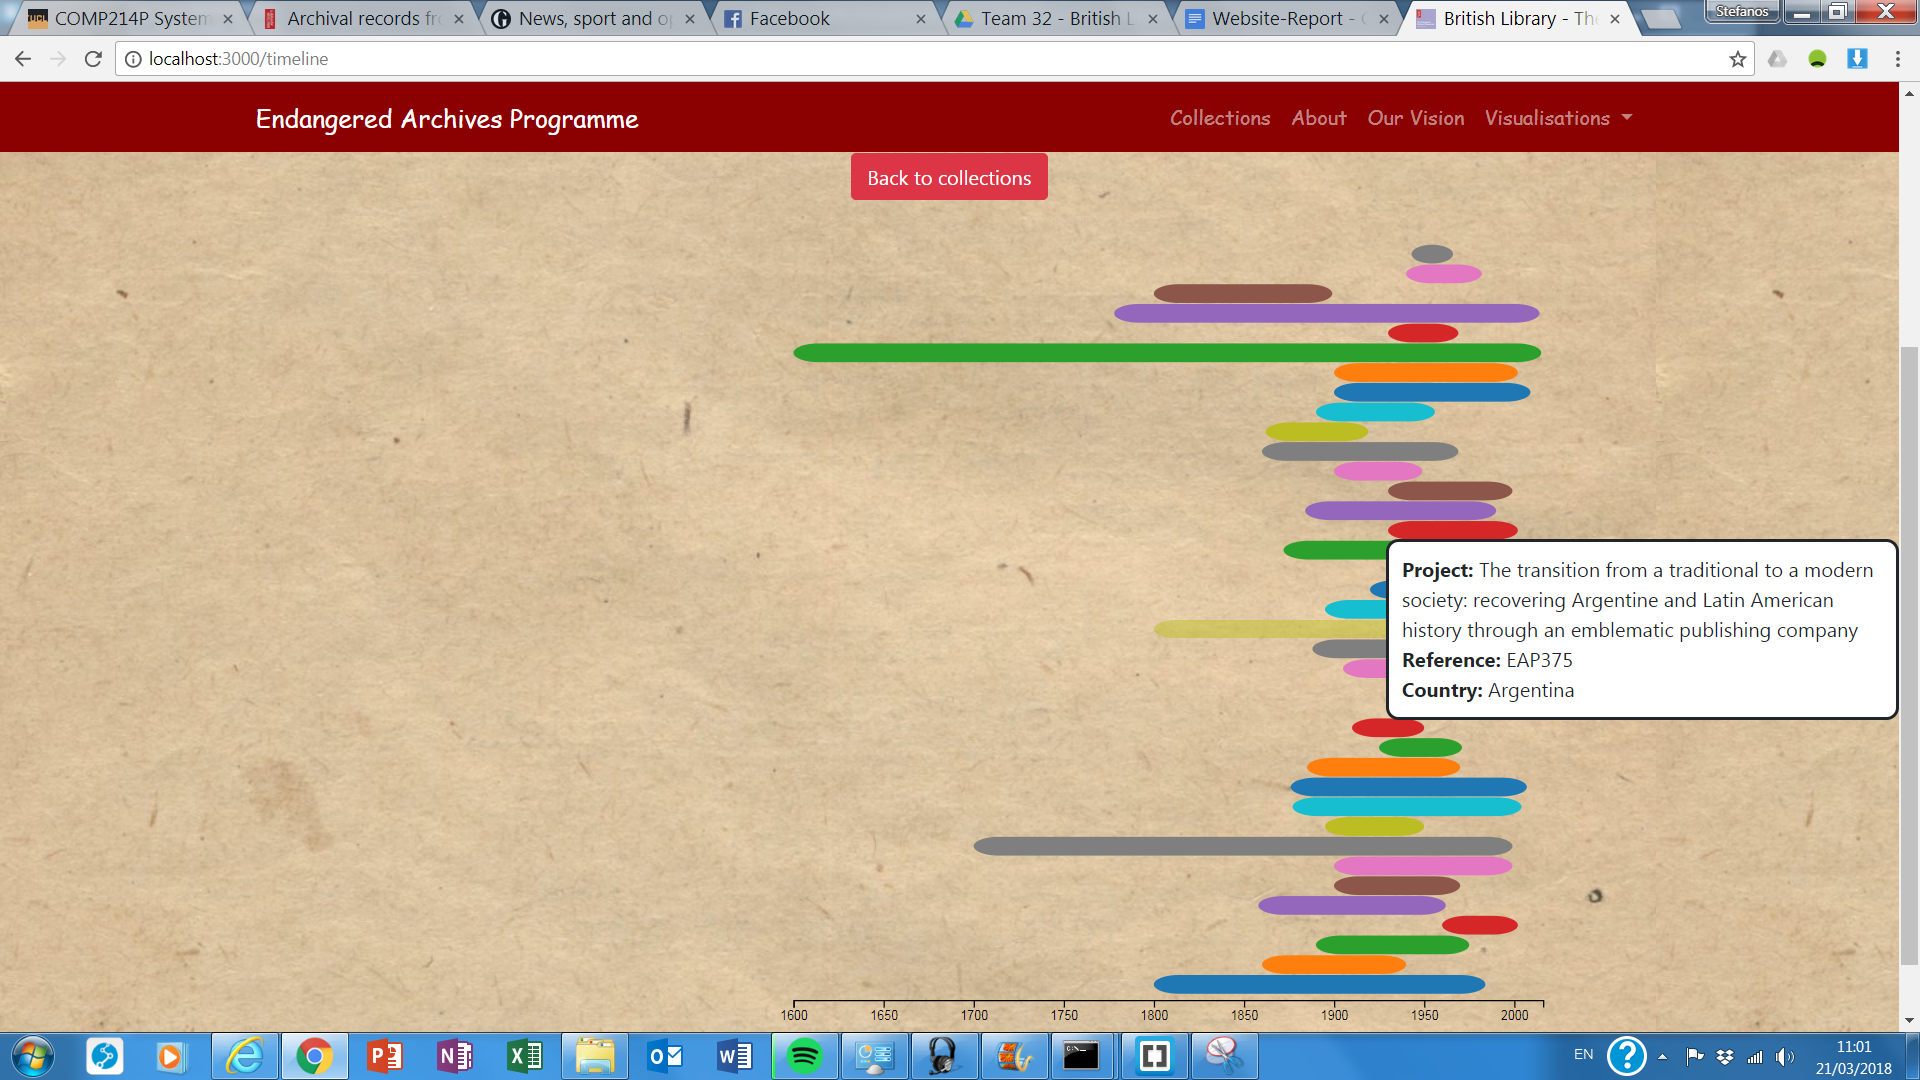
Again as in most visualisations when hovering above a project, a tooltip appears displaying the project's title, reference and country.
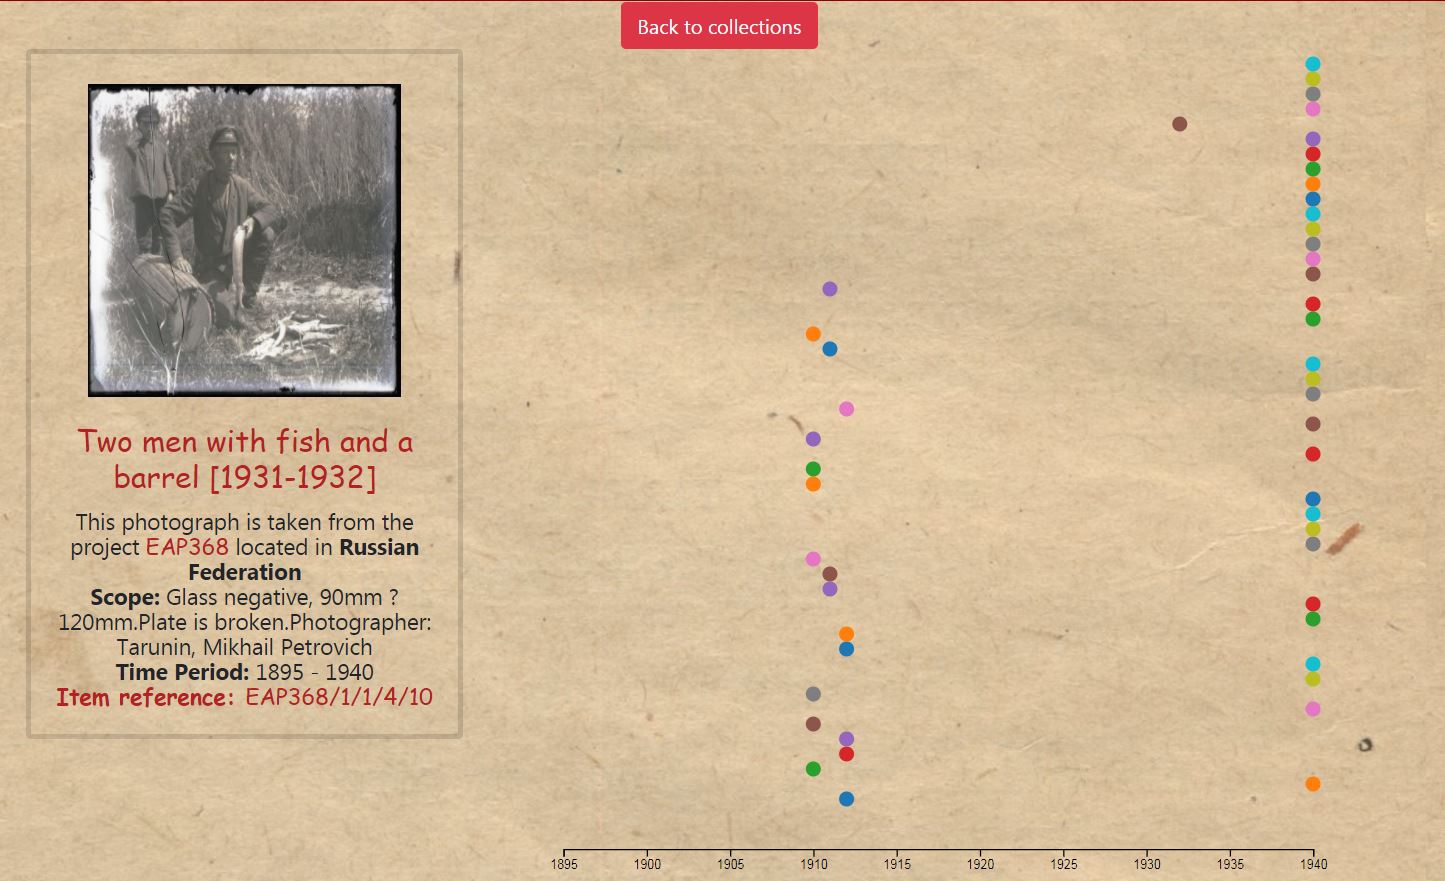
When clicking on a project, the visualisation will display a number of photographs, as much as 50, plotted chronologically.
Clicking on a circle will trigger a new card to appear, displaying the following info about the picture: Image, title, description, time period and reference.
-
Both the title and reference are linked to the official EAP site.
Finally, the user can go back to the collections level in the timeline by clicking the Back to collections button.
-
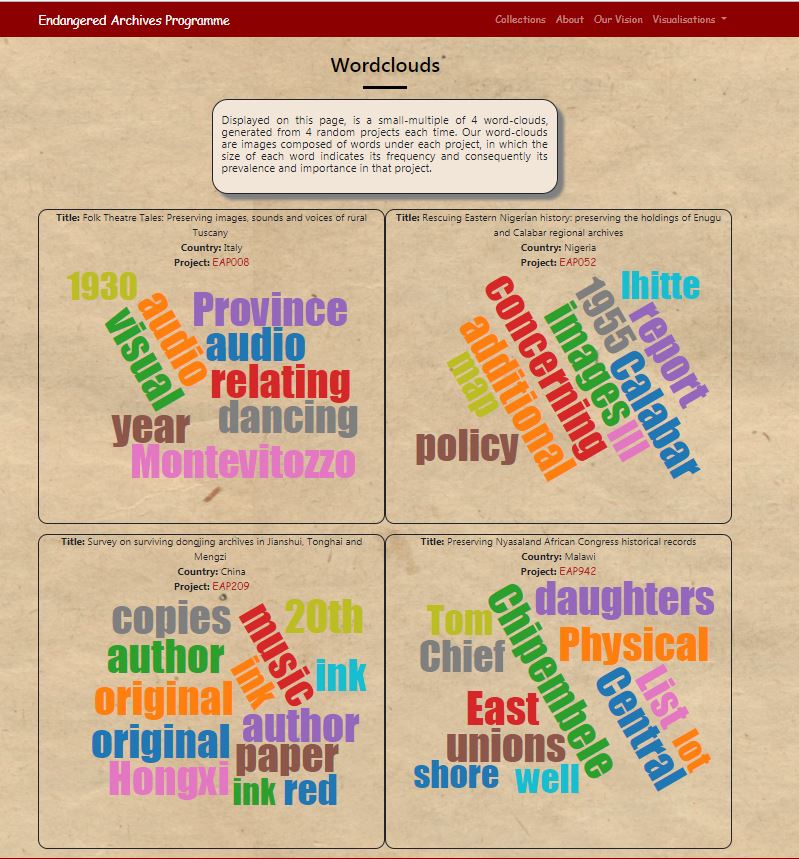
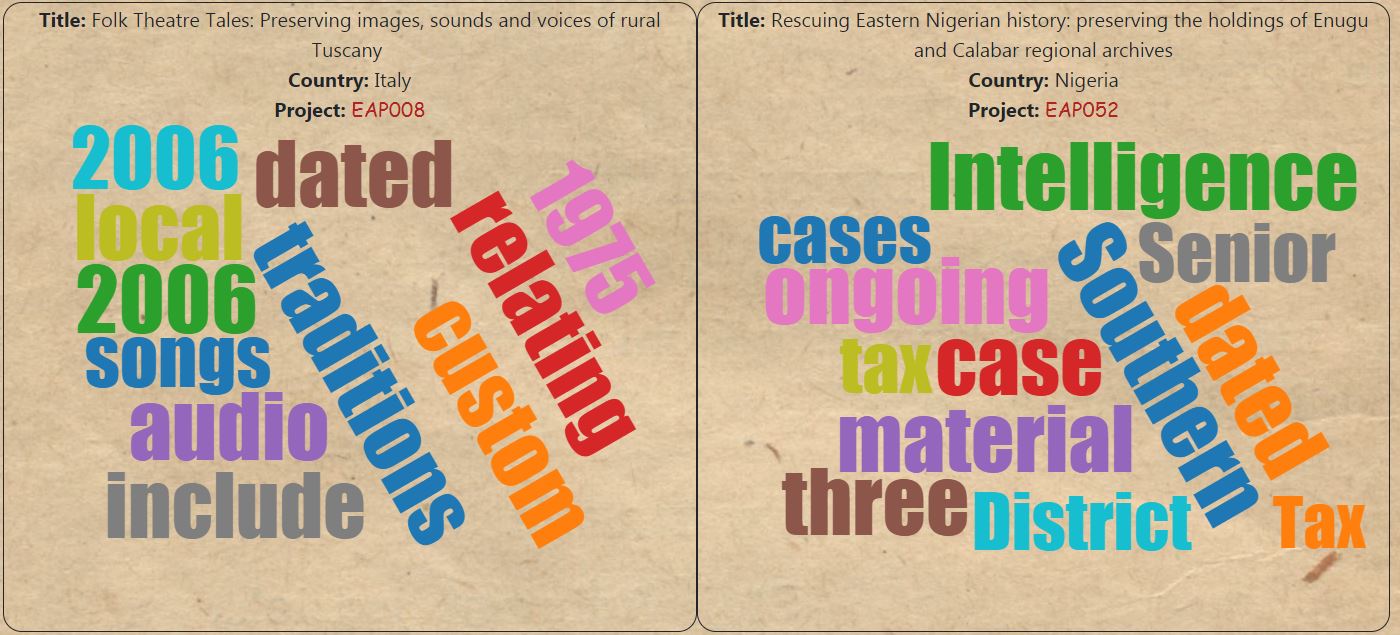
Our final visualisation can be displayed when clicking the Project Word Clouds option
-
Displayed on this page, is a small-multiple of 4 word-clouds, generated from 4 random projects each time. Our word-clouds are images composed of words under each project, in which the size of each word indicates its frequency and consequently its prevalence and importance in that project.
-
The additional info displayed are the title of the project, its country of origin and reference which is clickable and will lead the user to the official EAP site of that project.
Deployment Manual
First. The deployer/client will find many instructions referring back to deployment and even implementation techniques from a trello repo we have kept in order to split tasks, develop stub ideas and overall management and inclusion of the different modules. The repo can be found on: https://trello.com/b/jp7PTI2o/eap. While definitely not complete, the repo gives very detailed explanations and file resources for the basic functionalities of the app, and also details deployment on the “Skeleton” and “BackEnd” boards.
We will repeat those steps here, while adding another element to the mix, Azure deployment. Considering we have finished development and that our data is immutable, this guide should be considered complete and comprehensive. We strongly advise on using a Windows PC for setup, as this is the platform we have developed on successfully. All flavours of Windows 7/10 should be compatible with these steps.
We will first give instructions on how to deploy locally. Firstly, the client should be getting the database in the form of a .csv file from a Google Drive link: https://drive.google.com/open?id=1SBG98RdhBzj76jNKqJXomPOQ-a65aeou. This contains the latest version of the data, completely cohesive and to the highest possible standard of correctness. To complete the process, the client should install MongoDB Community Edition from the URL: https://www.mongodb.com/download-center#community. Install under C:\Program Files\MongoDB\Server\3.6. Place the EAPComplete.csv inside the bin folder of the Mongo installation. Create data\db and log directories inside the root at C:\. Open an admin cmd and navigate to the bin folder. Write the command "mongod --logpath C:\log\mongo.log --logappend --dbpath C:\data\db --directoryperdb --install" while inside the bin folder of Mongo. Exit MongoDB with "net stop MongoDB" if necessary, and type the command "mongoimport --type csv --file EAPComplete.csv --db EAP --collection EAPComplete --headerline" inside the bin folder to import the csv file. We now have a database up and running locally.
Next up, we will install Node.js to get a website connected to the data. Install node by downloading the latest version available on https://nodejs.org/en/download/ that corresponds to the Windows version and architecture you are running.
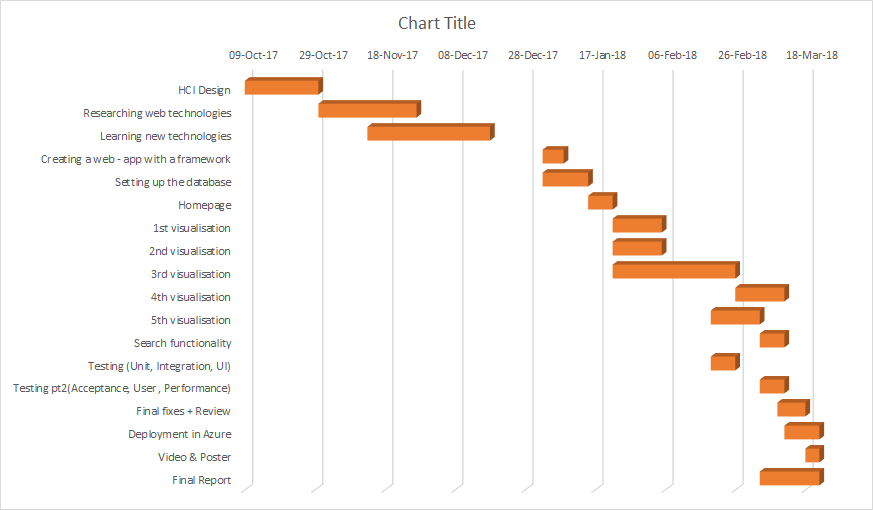
Gantt chart
Displayed below is our Gantt chart illustrating our schedule from the beggining of the academic year until the 22nd of March