White box testing
White box testing is a software testing process in which the internal structure and implementation of items is known to the tester. Hence, white-box testing is performed in two ways, unit tests and integration tests
Unit and Integration Testing
D3 Scale Tests
Our web app uses three main technologies: d3.js, mongoDB and express.js
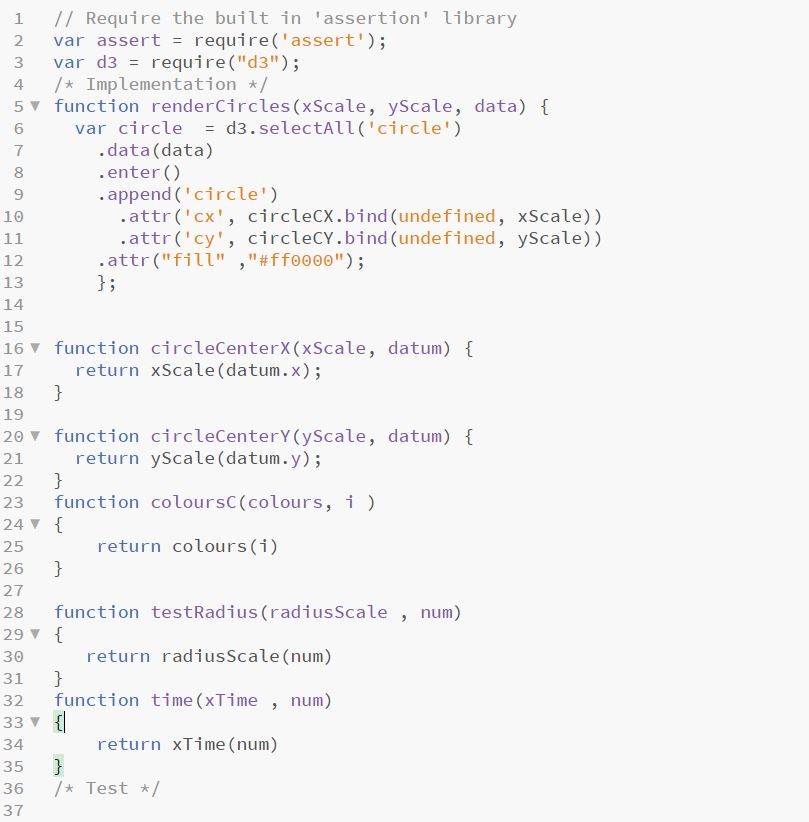
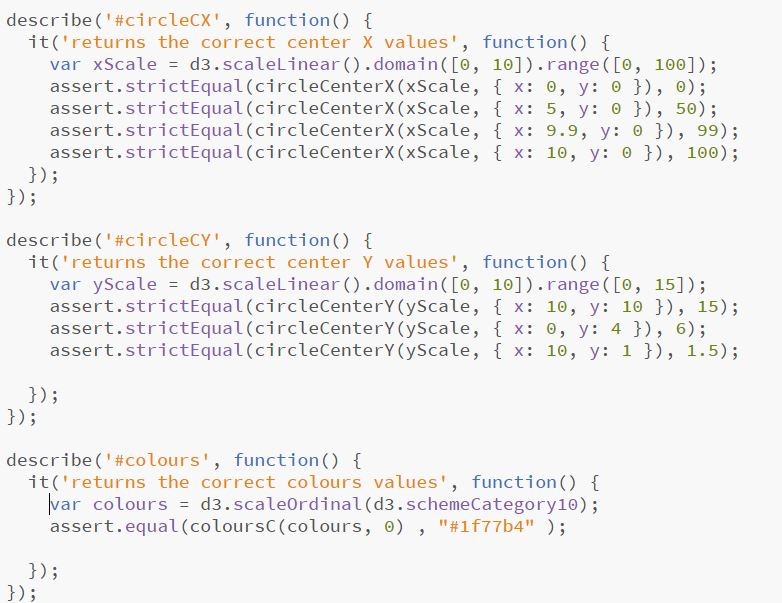
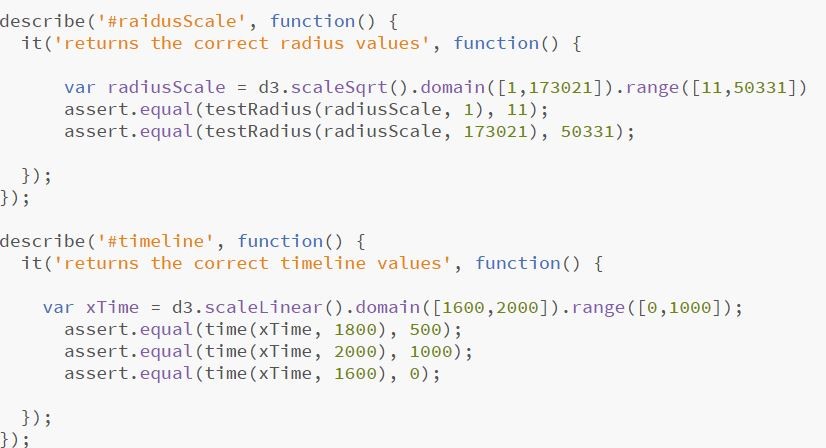
As d3 is a visualisation library, and in general our data just get mapped into svg and graphics there wasn’t much to unit test in our code. However there was one thing that could be tested that was being used by most of our visualisations - scales(linear,logarithmic,timelines,colours etc). With the help of mocha we wrote some simple test cases, by defining our scales domain and range and feeding in data, to see if those scales would return correct results.
For example in a timeline that has a domain from 1600 to 2000 and a range from 0 to 1000 we wanted to see how each year would be mapped to in our graphic.
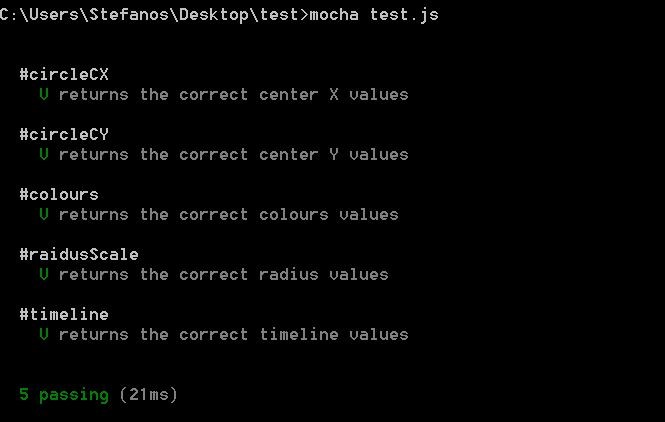
Some screenshots below that show some of our tests as well as the completed result.
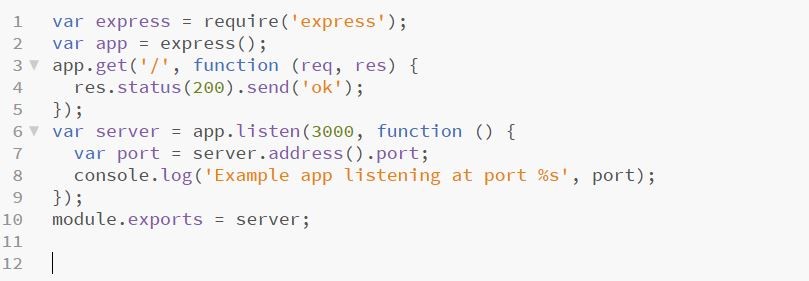
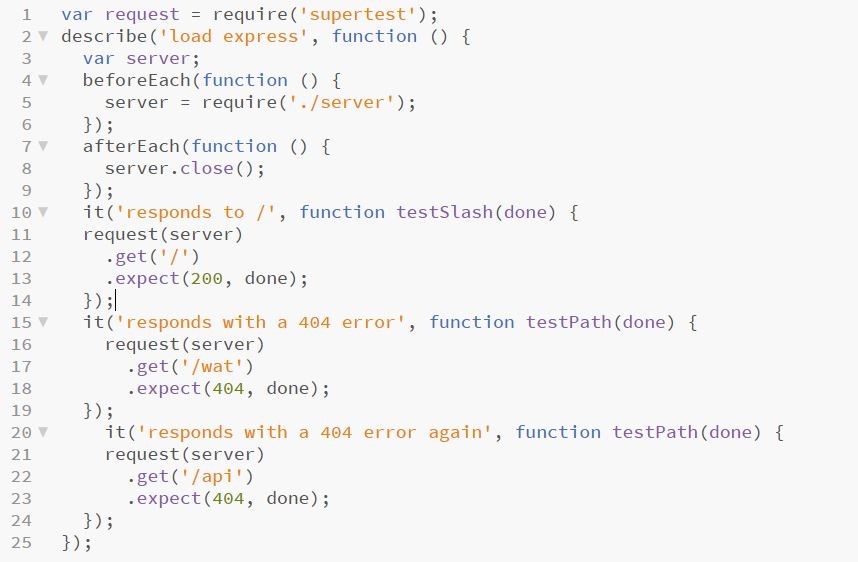
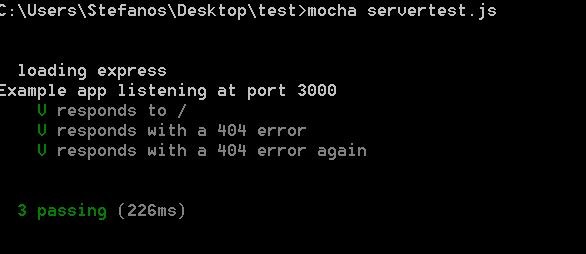
Express.js unit testing
Then we moved on into simple express.js unit testing. Our test was really simple, creating a local server and then testing if our express app will accept links that follow with a ‘/’ and reject everything else with a 404 error.
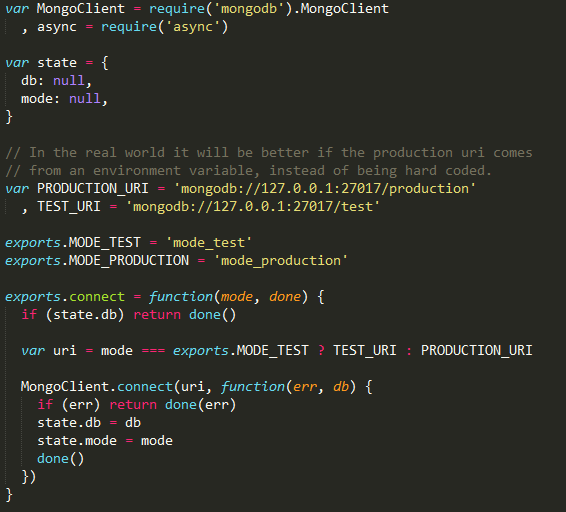
Integration testing
We thought we should test our models, but this is not as trivial as it sounds.
First, when testing a model you don’t know what was the state of the database before you run the test. When you don’t know what the initial state is, you don’t know what to expect as a result from the test.
That is why we have used ‘mocha’, a framework for testing mongodb without interfering with the development environment. The reasons for using mocha are:
- Before each test your database goes into a clean state
- You always know what to expect and the results of your tests is predictable
- While your tests interact with the database, they don’t affect the data that you use while developing
- All this happens automatically and you can just safely create your tests
Our tests mock up a dummy database with parts of the Record model used in development, and connect a dummy webapp to it through mongoose to check for POST and GET requests. This way we split the environment offers us freedom to change from production to testing.
Our tests assert that data sent and data received by the application is conforming to the standard of the restricted model:
Performance testing
Load testing
We used JMeter to load test the EAP project website. JMeter is used to create threads and send requests to EAP project website simultaneously in order to test the capability.
In order to test without bias, we created 100 threads and requests initially, the number is then increased each time after tests, and was up to 1000 threads
The result shows up that the EAP project performs normally, but with slight delays when over 600 requests are sent to the webpage.
Due to limit amount of resources, we could test the maximum loads of the website. However, the result from load test suggested that the EAP program would run under most circumstances
More load testing on visualisations
We had noticed that some of our visualizations were taking too long to visualise: namely the Materials one which tooks around 10s and the Languages one which took around 7s. Since both of them are just taking the data and displaying them, and do not change once they get drawn by the user’s actions we decided to stop calling the database api each time and just preload the data into our Javascript code. There was a tremendous improvement in the loading times, which are now not even visible and in the area of milliseconds, as the user will see the visualisation as soon as the page loads.


We noticed the same problem in our word clouds, as the data was taking to long to load. Additionally the data have to be filtered for stopwords, and also processed in order for the word cloud to be drawn. As we noticed that our visualisations were crashing for certain projects, we decided to limit the projects available to choose from to the ones containing 10 thousand words or less. By doing this we have managed to bring the loading time to around 11 seconds, which may not be optimal but it is definitely an improvement to some projects taking 25 seconds just to load.

User and Acceptance Testing
Black box Testing
Black box testing can also be understood as Behavioral Testing, it is a software testing method in which the internal structure/design/implementation of the item being tested is not known to the tester.
Black box test is conducted by constructing five cases designed and shown in below, testers do not have any knowledge on the project, and were asked to perform the certain task
| Test Case ID | Test Cases |
| Test Case 1 | Search using the search-bar in the home page. |
| Test Case 2 | Select the material visualisation |
| Test Case 3 | Select the languages visualisation and then find and click the Spanish Part. |
| Test Case 4 | Browse the timeline, select a project, browse some pictures and then go back to the projects part. |
| Test Case 5 | Browse the countries visualisation , select the Brazilian flag, and then split the countries by their continent. |
| Description of Test case 1 | The user searches with a keyword like Asia in the search box. |
| Related Use Case | Use case 2 |
| Subsystem | Web-app |
| Main flow | |
| Valid Outcome | Three different results get displayed |
| Invalid Outcome | Some results are the same/ No results appear. |
| Pass/Fail | Pass |
| Notes |
| Description of Test case 2 | Select the materials visualisation |
| Related Use Case | Use case 1 |
| Subsystem | Web-app |
| Main flow | |
| Valid Outcome | The tooltip gets displayed correctly and with the correct info |
| Invalid Outcome | Tooltip is incorrect/ The user cannot understand the meaning of this visualisation |
| Pass/Fail | Pass |
| Notes |
| Description of Test case 3 | The user selects the languages visualization and then finds and clicks on spanish. |
| Related Use Case | Use case 4 |
| Subsystem | Web-app |
| Main flow | |
| Valid Outcome | The user can move and navigate the page. |
| Invalid Outcome | User cannot find spanish due to the tooltip not appearing/ Spanish cannot be clicked. |
| Pass/Fail | Pass |
| Notes |
| Description of Test case 4 | The user browses the timeline, selects a project, browses some pictures and then goes back to the projects part. |
| Related Use Case | Use case 4 |
| Subsystem | Web-app |
| Main flow | |
| Valid Outcome | The user can move and navigate through the collections and photographs level. |
| Invalid Outcome | Back to collections button doesn’t work |
| Pass/Fail | Pass |
| Notes |
| Description of Test case 5 | The user browses the countries visualisation , selects the Brazilian flag, and then splits the countries by their continent |
| Related Use Case | Use case 4 |
| Subsystem | Web-app |
| Main flow | |
| Valid Outcome | The user can move and navigate through the visualisation. All countries and buttons can be clicked and the subsequent actions performed. |
| Invalid Outcome | The user won’t be able to split the countries by their continent/ Not able to see information about a specific project. |
| Pass/Fail | Pass |
| Notes |
Field Testing
In order to know if we meet the expactation standard, we conducted the same survey and compare the result.
We have taken a sample of 10 and have asked them to use the EAP project, the results are presented in the chart below.
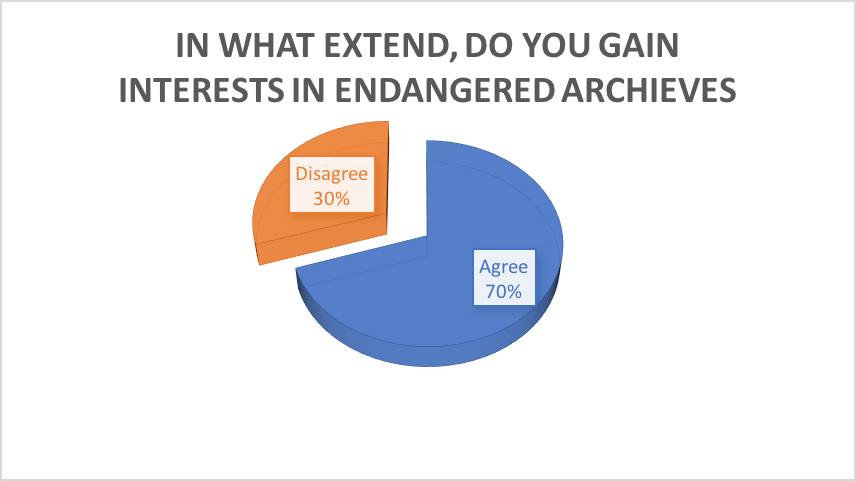
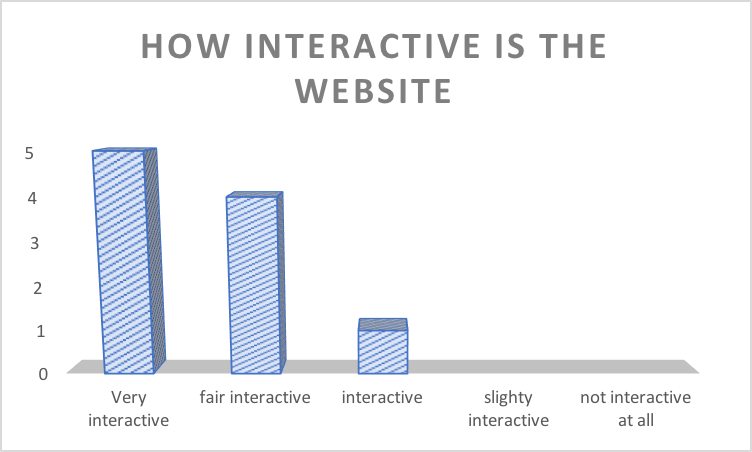
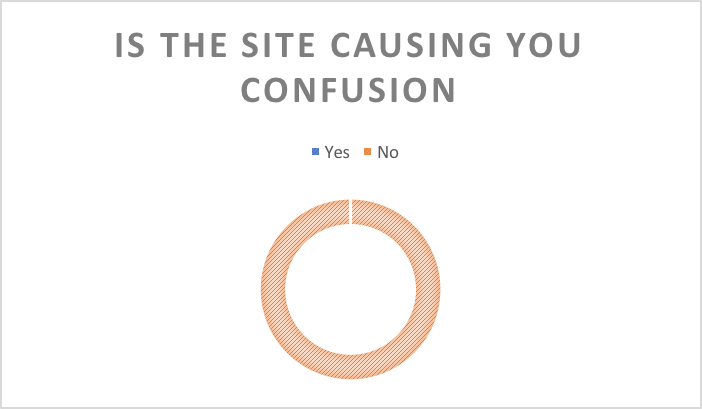
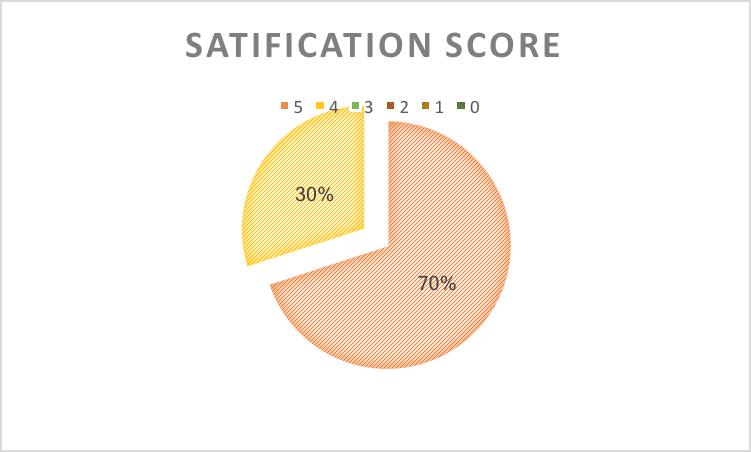
By comparing the result we obtained in October. The overall outcome (in four statements) derviated with no more than 10%. In another words, the EAP project meets the standard we proposed
Clients Feedback
Positives: Liked the interactivity between the languages and countries visualisations ,a lot of potential for discovery. Liked the randomness element, in the word clouds as well as the photographs in the timeline visualisation.
Negatives:There is a tooltip bug on the timeline visualisation. Project’s titles are not correctly linked to the EAP site. Some word-clouds contain dummy data which should have been removed from them
Confirmation emails from clients.
This is the e-mail confirmation we got from our clients after we demoed our application and let them browse it.
Tester's feedback
User1
Positives: Linking between different languages and countries.
Negatives: Not all words in the wordcloud are visible due to the colour scheme used.
User 2
Positives: The photographs in the timeline visualisation were certainly interesting, for example I had no idea how life in Iran in the 1920’s looked like
Negatives: The countries visualisation transitions to countries or continents is slow and requires a lot of scrolling to completely visualise.
User 3
Positives: Like the colourful scheme used throughout the visualisations. The visualization with the countries, has a lot of potential in discovering new flags/countries. Negatives: Sometimes, the timeline is not displayed correctly, as the transition from collections to pictures is only half done.
Conclusion from user testing
The whole user and client testing part was really helpful for us. By just letting people browse our website and discover it, we found a number of bugs that maybe we wouldn’t be able to pinpoint and we were able to fix them before the hand in data.
The biggest outcome of this part of the testing was the feedback we got from our U.I and how we could further change and polish it to be more user-friendly.
Concluding, we find that user testing was a quite useful process, as it proved our app was working up to the agreed requirements and enabled us to take another perspective into it, from inexperienced users who shone some light in problems we hadn’t seen.