Introduction to EAP and our client
The endangered archives library aims in the preservation of material in danger of destruction globally and mainly houses documents from Prehistoric times until the Industrial Revolution.
A device of invaluable anthropologic importance, British Library’s Endangered Collections holds manuscripts, music, images, moving pictures, offering a glimpse into the past. At present, the library holds a digitised copy of the repository on the internet, freely browsable at https://eap.bl.uk/. Our scope is to release a parallel to the existing site, that would present the contents of the archive. It contains about 300 projects with more than 3 hundred thousand records.
Our scope is to release a parallel to the existing site, that would present the contents of the archive.
Project goal
Our clients set out the direction of the project while also leaving it very open ended for Research & Development and coming up with ideas. The impetus was to make the various collections of the EAP more discoverable and encourage exploration of them with data visualisations supported by project metadata and possibly information extracted from images. This required some cleaning and completing the metadata, web-scraping to extract image links from the original site, building a working skeleton platform to develop on the localhost and finally but most importantly designing and developing visuals to encompass the data.
Requirements Gathering
We used a combination of methods to gather our project’s requirements, namely interviewing our clients and making ourselves familiar with the excel spreadsheet that was given to us as metadata export. We also examined the existing site and other additional visualisation examples pinpointed by our clients. Finally after some brainstorming and taking in mind the research done on the existing website and various examples around the net we came up with our set of requirements.
We do hold summaries of the first encounters with our clients. They contain incipitual ideas, stubs of development and discussion on the margin of the data. Many more meetings and emails have been exchanged since those first communications. Our requirements were recursively understood, as our proficiency with the dataset increased.
Interview
Starting of we would love to know more information on the Endangered Archives programme.
The programme is now on its 14th year and its main aim is to fund researchers around the world so they can preserve or transfer to a safe place historical documents of any format as well as digitise them. It currently has more than 6.5 million items which can be found in our website, ranging from pictures, newspapers, books, sounds etc.
Could you tell us some things about the project?
Our project’s aim is to increase the web traffic of these Archives. Currently with our website it is quite hard to search and browse archives as it is aimed at a more scientific audience. This is something we would like to change and we would love a new website working on par with the one we have now which is user-friendlier and generally more accessible to the average user. Sadly the Archives don’t get much exposure which is something we want to change.
How do you propose we could fix the problem?
First of all we need to mention that when the programme started, it was to a much smaller scale and with a narrower focus. 13 years ago we wouldn’t think that the whole database could be stored digitally and accessed by everyone and that is why a lot of the pictures we have weren’t to the highest standards. I should mention that all the pictures are stored under the IIIF protocol. There are also some problems with the database, i.e the date field corresponds to the year these archives entered the library and not the actual date those archives were made. We also expect you could also take a look at the metadata and help us improve them - by cleaning and organising them in a more sensible way. Ideally you could try using image processing to help you categorise these images but this is not our main aim.
Are there any suggestions that you think is going to help us achieve your goal?
Currently the project is really open, with the only aim in having an accessible and engaging way of presenting the archives to the average internet user. We would love to hear your opinions on the subject after you have given it some thought.
Are there any limitations to what we can use/present?
You will discover that some archives are not accessible to the public and so they cannot be displayed in the website. We think the most important thing is to ensure there are no errors or mistakes as well as making sure the presentation won’t touch several sensitive subjects(i.e. Borders, conflicts etc). Another important thing is that the website you will built will work without changing anything on the official website, as this is not a project that can be funded by the Library. We mainly want to use the new website for promotional reasons and if we are satisfied with its use after some time maybe try to make it more official. That’s why it would be good to use a statistics so we have a clearer image of the site’s usage.
Outcomes of the second meeting with them:
Our clients have explained that the scope of the project wouldn’t be a fully functional website, but rather a modular approach to visualising the collection in its entirety. We would have to propose, design and develop 5 different visualisations until the end of the second term. Also, the clients were satisfied with the idea that we could only pick sections of the collection to showcase, displaying what we think is relevant in a meaningful way.
Professor Tim Weyrich has guided us in establishing the new requirements, saying that we should not confuse requirements with specifications and that the requirements could be more vague regarding the actual scope of the project.
We have understood the rather experimental nature of our exploration and the importance of having good design for our data visualising elements. We have been reminded that the collection is organised hierarchically and that the date of some items may be found in the title of the document or in parent fields.
There have been some technologies mentioned, such as Tableau, D3, Processing ( and the languages R and Python).
We understood as well that the clients do not expect us to be able to categorise items based on what they actually are (palm leaf manuscripts, periodicals, newspapers, etc.) because they already have this feature in development. As a limitation, we’ve found out that the sounds are in smaller numbers than the other types of items and that they are on an external site. We might explore this further. And idea was formed to group photographies in activity themed tags.
Researching the official EAP site and already available visualisations on the web as well as those recommended by the clients. Mitchell Whitelaw was recommended to be doing interesting work with 'generous interfaces' http://mtchl.net/tag/generousinterfaces/. After our first meeting with our clients were conducted, we started looking into the web for inspirations. As d3 was recommended by our T.A. we first started looking in their examples at https://github.com/d3/d3/wiki/Gallery. This is where a lot of the ideas were first conceived; the bubbles inside bubbles material type chart, the word-clouds and the languages tree map.
One of our clients also had a tumblr page where she collects interesting visualisations from around the web and it can be found at https://scholarlyvision.tumblr.com/. Those two sites were our main inspirations for the final visualisations as well as other ideas we eventually had to leave out or stop developing, i.e. a sunburst chart with all the primary and secondary languages, images grouped by tags, color or age
The next part in our requirements gathering was to browse the official site and the excel document we were given and try to understand how their hierarchical system worked. We realised that the the upper level consists of projects which are then split down to collections and fonds . The third level consisted of sub-fonds and finally the last level was items. This helped us get a better idea of the data and reminded us that we could use data found in the upper echelons of an item, i.e the project it belongs to, to help us in the future.
Moscow Requirement List
Initial MosCow
After discussing with our clients, the table shows the initial requirement of our projects, however, the MoSCow table is not the finalised version and was yet to be discussed with clients.
| ID | Description | Priority |
|---|---|---|
| 1 | The system must display the metadata and its contents in a human-usable manner | Must have |
| 2 | The system must group similar content based on the fields and attributes found in the metadata excel spreadsheet | Must have |
| 3 | The system must offer basic search functionality by name, year, subject | Must have |
| 4 | The system must allow users to view each item individually with full content available | Must have |
| 5 | The system should provide the user with recommendations based on their location, language, background | Should have |
| 6 | The system should present an interactive map of the documents | Should have |
| 7 | The system should make and display other statistics based on the metadata | Should have |
| 8 | The system could feature some items on the front page as a periodical update | Could have |
| 9 | The system could allow users to take notes (private), comment (public) or review articles and items | Could have |
| 10 | The system could show the user’s interaction with the items as a journey through the map | Could have |
| 11 | The system could use image processing techniques to extract further classification of items or highlight important elements in photographs | Could have |
Amendments from initial idea
Mainly, the changed focus is from an individual item to a holistic view on the collection and to a selection of meaningful, related items. Afler another client interview, we have realised that the project is not about a scholar using the collection, but rather about someone browsing carelessly and finding quality content and presentations out of the collection, to their amazement. The onus was set on the experience being as engaging as possible without disrupting the user with login and sign up.
Finalized Moscow requirement
| ID | Description | Priority |
|---|---|---|
| 1 | The system must display the metadata and/or its contents in an eloquent manner | Must have |
| 2 | The system must group similar content based on the fields and attributes found in the metadata Excel spreadsheet | Must have |
| 3 | The system must allow overviews of relevant and meaningful subsets of the collection | Must have |
| 4 | The system must present the user with intuitive visual ways to browse the collection | Must have |
| 5 | The system should make use of the hierarchical organisation of the data to create layered statistics and visualisations | Should have |
| 6 | The system should use the location of the items to group them appropriately and show a compelling interface for it | Should have |
| 7 | The system should use the date of the items to group them appropriately and show a compelling interface for it | Should have |
| 8 | The system should include an explanation/walkthrough to familiarise the user to the different visualisation tools | Should have |
| 9 | The system should feature some items on the front page as a periodical update | Should have |
| 10 | The system could make use of different subsets of data to propose other statistics and visualisations | Could have |
| 11 | The system could allow some visualisations to be searched via keywords | Could have |
| 12 | The system would use image processing techniques to highlight important elements in photographs and group them by tags | Would have |
Persona1
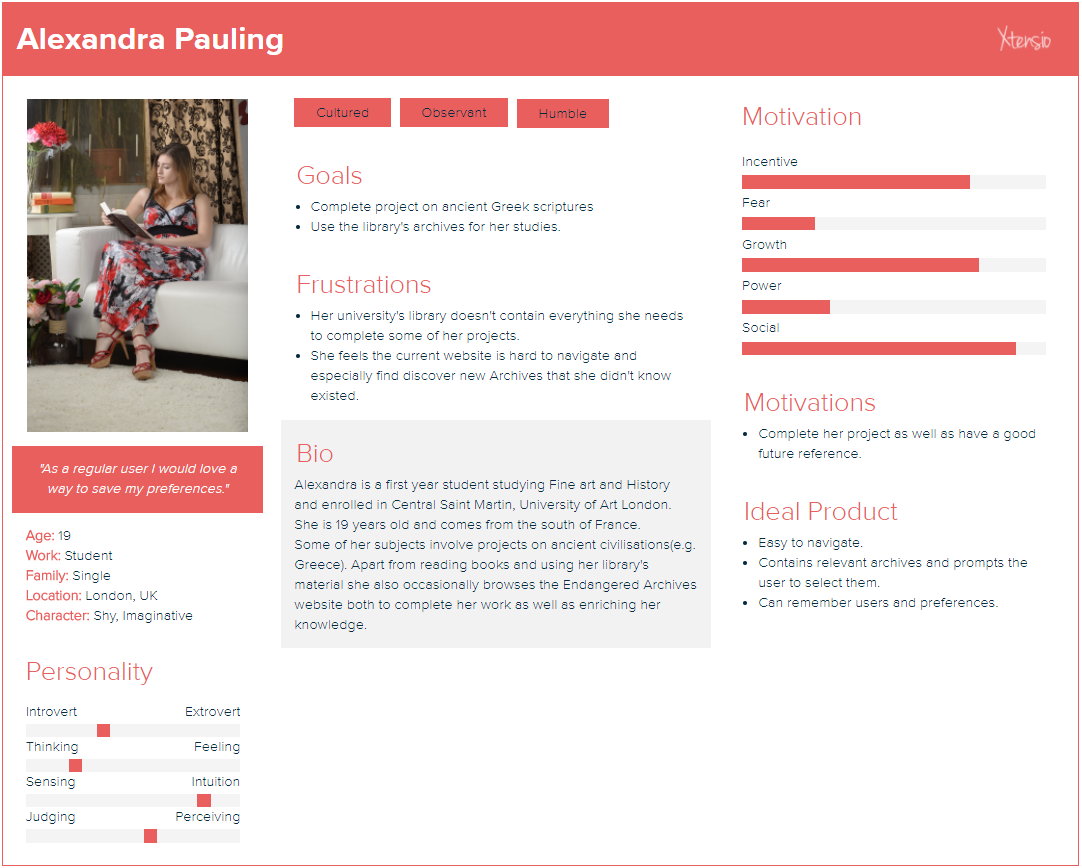
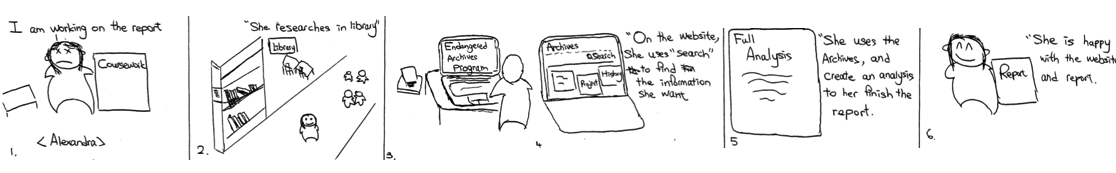
Scenario
One of the courses that Alexandra studies requires her to research on ancient history. She has no insight on the project since she is has just started the course. Apart from visiting the library and reading books, she uses the internet to research on ancient artifacts. While she googles, the endangered archives program is displayed in the result list, a programme run by the British Library. The programme collects a variety of endangered archives from around the world. Alexandra can browse the result by regions and the year that the archive was created, using the interactive map. She chooses the results she wants and analyses it. She is very happy with the website because the results are useful for her projects.
Persona2
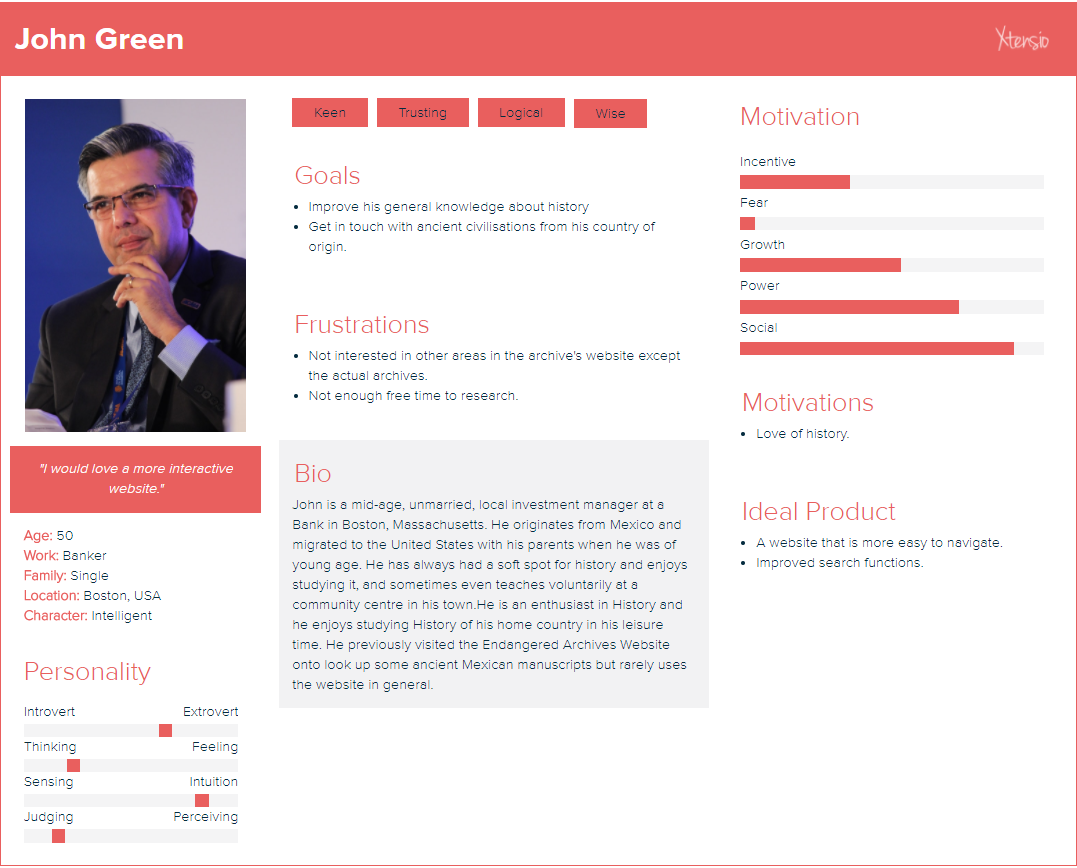
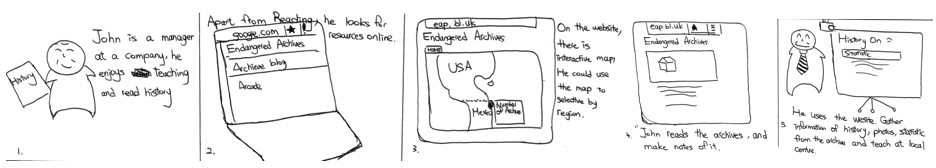
Scenario
John is a mid-age, unmarried, local investment manager at a Bank in Boston, Massachusetts. He originates from Mexico and migrated to the United States with his parents when he was of young age. He has always had a soft spot for history and enjoys studying it, and sometimes even teaches voluntarily at a community centre in his town. He is an enthusiast in History and he enjoys studying History of his home country in his leisure time. He previously visited the Endangered Archives Website onto look up some ancient Mexican manuscripts that thought would be nice to teach at the community centre, but found it pretty difficult to navigate and uncover useful information.
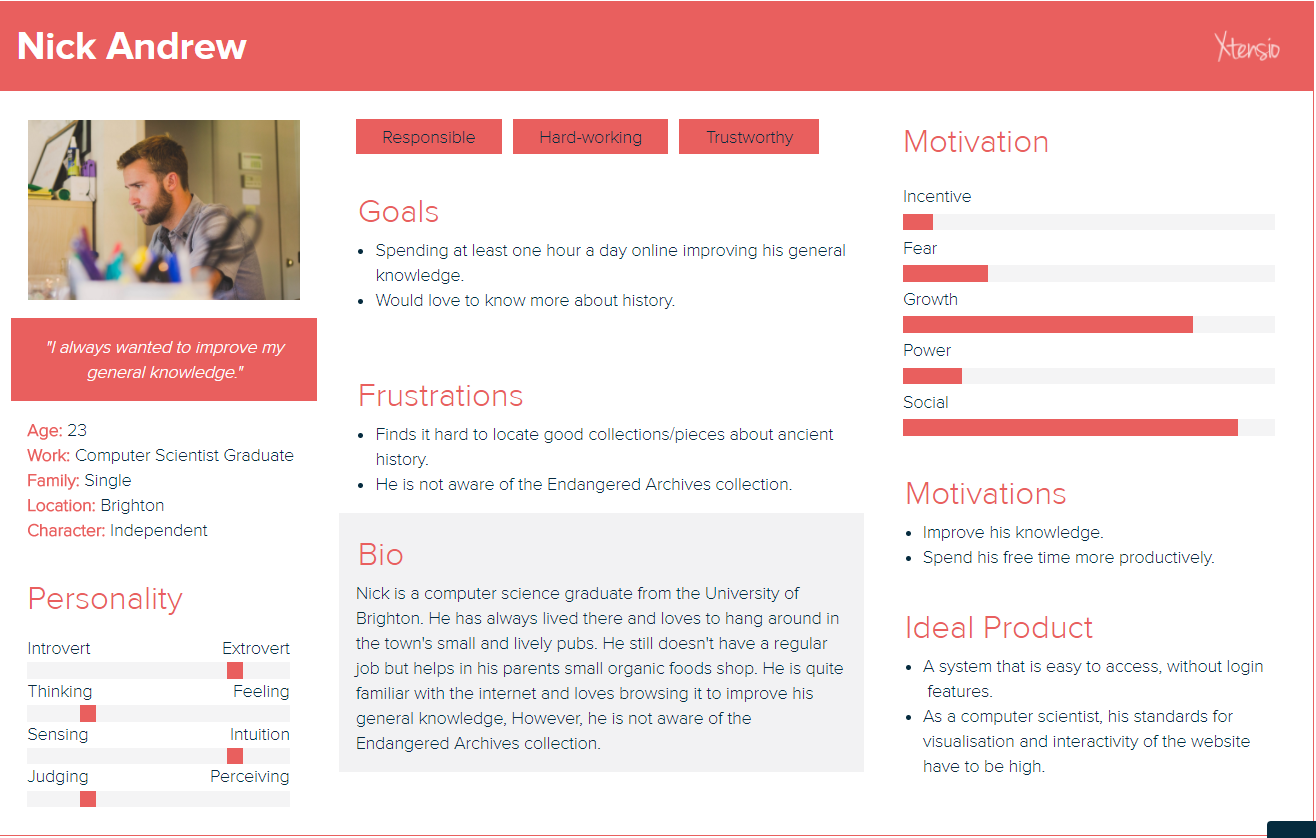
Persona3
Scenario
Nick has recently graduated as an computer scientist. He couldn’t get the job he wanted because of the competition among all fresh graduated students and the demand of jobs in the market. However, he receives a freelance job on improving and upgrading the website representing some history. He is pleased with himself, not only because he likes coding and development, but also because it gives him a good chance to know more about history. He browses around on the internet and has found out a website called "Endangered Archives Programme". On this site, there are interactive features that he could use for reference. Beyond that, he has improved his general knowledge.
Use Cases & Use case diagram
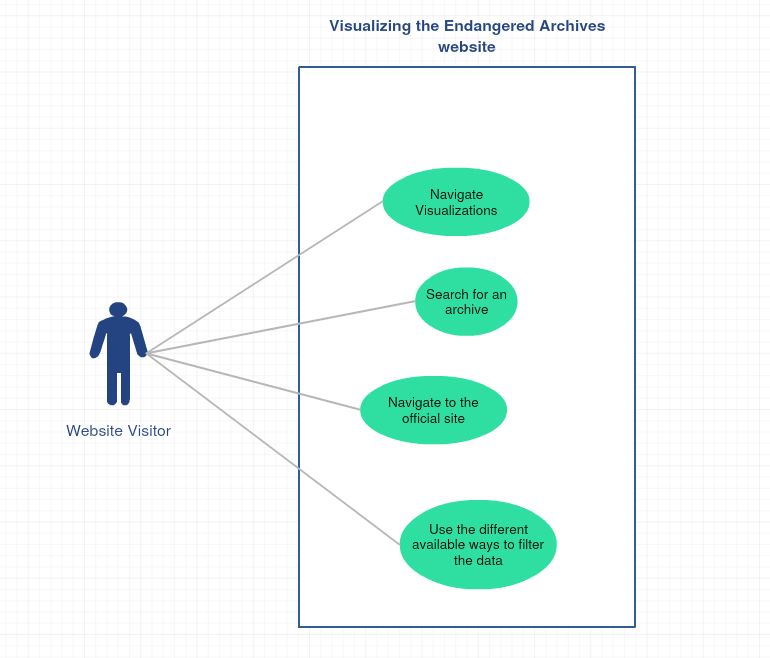
Use case diagram
Use cases
| Use Case ID | Use case |
| UC1 | Navigate Visualizations |
| UC2 | Search Database |
| UC3 | Go to the official British Library site |
| UC4 | Navigate between linked visualisations, make use of the buttons to navigate through a visualisation |
| Use case | Navigate Pages |
| ID | UC1 |
| description | The app users can navigate the app to enter different visualisations. |
| Primary Actors | Website visitor |
| Secondary Actors | None |
| Precondition | The website is working and loaded |
| Main Flow | 1. The user selects the visualisations option from the toolbar. 2.The user selects the visualisation he wants to go to from the top-down menu. 3. Or he may choose to browse the main page. 4. This continues until they have found the information they want |
| Post Condition | The desired visualisation is displayed |
| Use case | Search Database |
| ID | UC2 |
| description | The visitor can use the search function to search the archives |
| Primary Actors | Website visitor |
| Secondary Actors | None |
| Precondition | There is a connection with the database. |
| Main Flow | 1. The user enters his query in the search.
Three random results will be displayed. |
| Alternative Flow | 2. Less than three or even none options get displayed if the search query doesn’t match anything in the database. |
| Post Condition | The search results will be displayed |
| Use case | Go to offical site |
| ID | UC3 |
| description | The website visitor can access the official EAP website |
| Primary Actors | Website visitor |
| Secondary Actors | None |
| Precondition | The webpage is loaded |
| Main Flow | 1. The user clicks the link that redirects him to the official page.
2. If he is in any visualisation that is linked to the official site, the user can click on one of the corresponding links. |
| Post Condition | The official EAP site is displayed |
| Use case | Navigate between linked visualisations, make use of the buttons to navigate through a visualisation |
| ID | UC4 |
| description | The visitor can alternate between the linked visualisations and use the buttons to filter the data |
| Primary Actors | Website visitor |
| Secondary Actors | None |
| Precondition | The webpage is loaded |
| Main Flow | 1. The user selects clicks on a language to be redirected to the countries visualisation
2. The user can use the buttons to filter countries by continent, or country. 3. The user can use the back to collections button in the timeline to go back to the collection level. |
| Post Condition | The desired guideline is displayed or the results are filtered. |