System Architecture Diagram
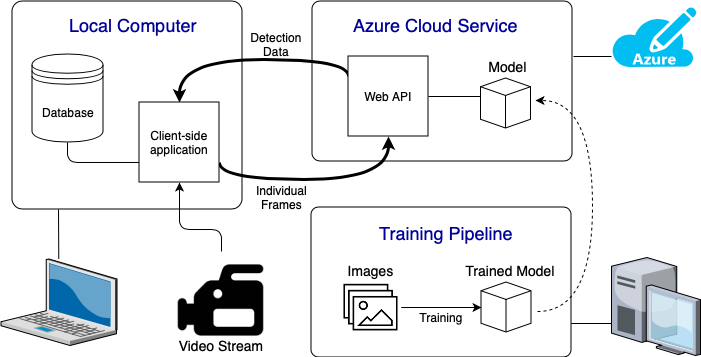
Above we can see the complete System Architecture Diagram of our system. Below we will give a breif description of each of these component:
- Local Computer: This is where the user interacts with the system. This could be any computer/laptop connected to a video input. The client application will show the live detection feed and will save all the data in a database. We made the client application using the PyQt framework.
- Azure Cloud Service: Here have created a web based API which handles the detection of objects in the images it receives. It will use the trained model from the training pipeline to run inference on the images it is sent. The connection side of the API is handled using the Python sockets library. The API also used TensorFlow GPU to run the inference graph.
- Traning Pipeline: This is where we take our images of the various medical instruments to train different detection models. This took up a large portion of our project as we needed to train a model which accurately identifies the different objects.
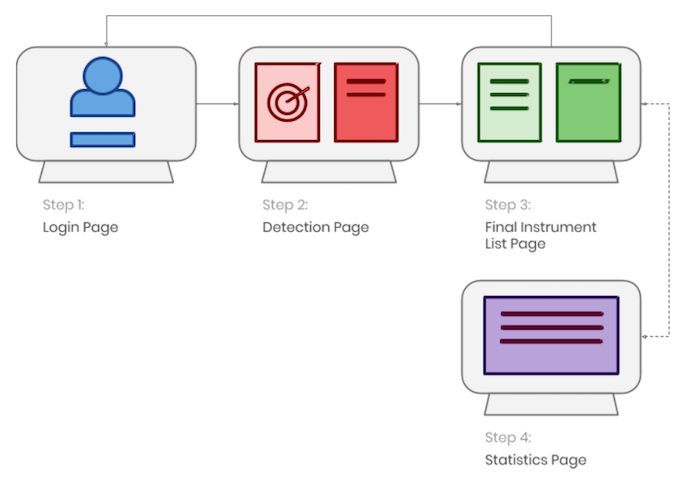
Page Flow
The system was designed to be as simple as possible allowing the user to take in all the necessary information without having to switch between multiple pages of a system. This makes the system more efficient and time saving.
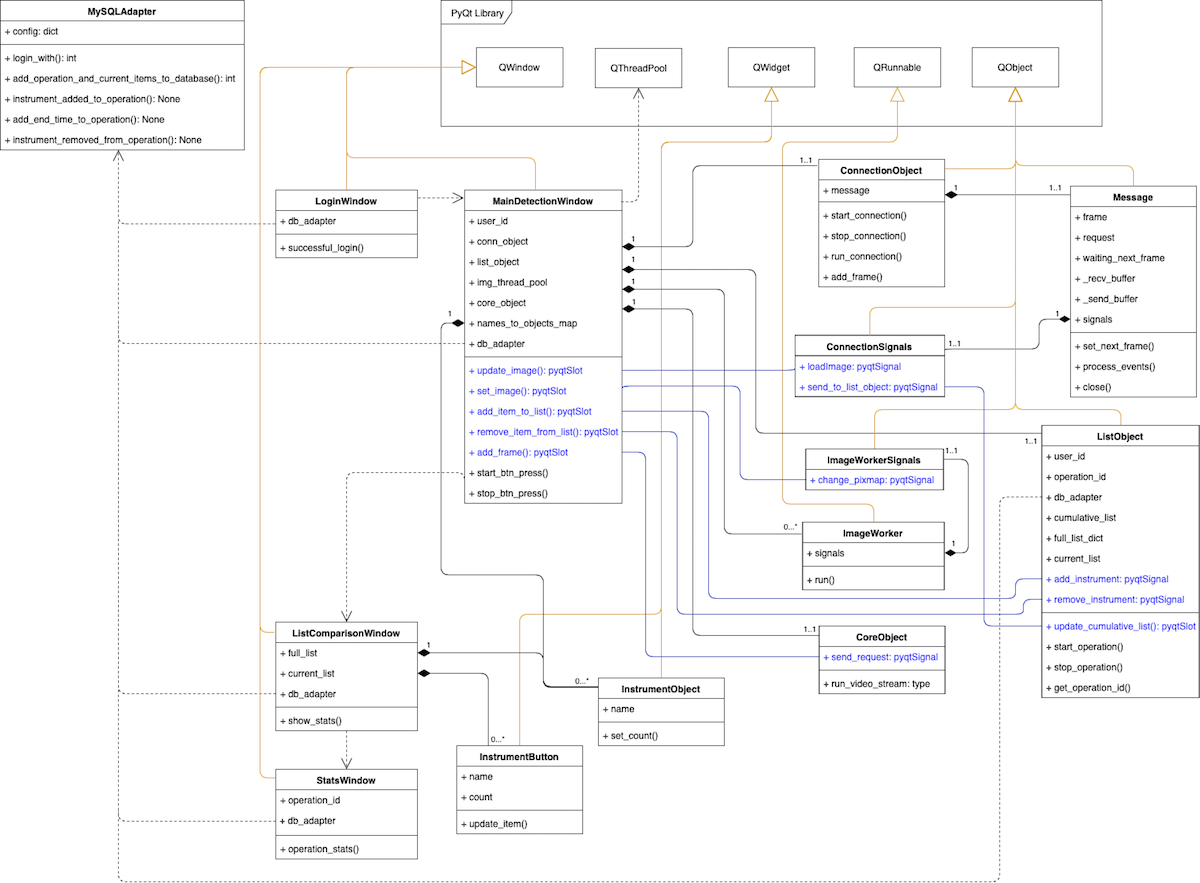
Class diagram
The document below showcases the main hierarchy of the system.
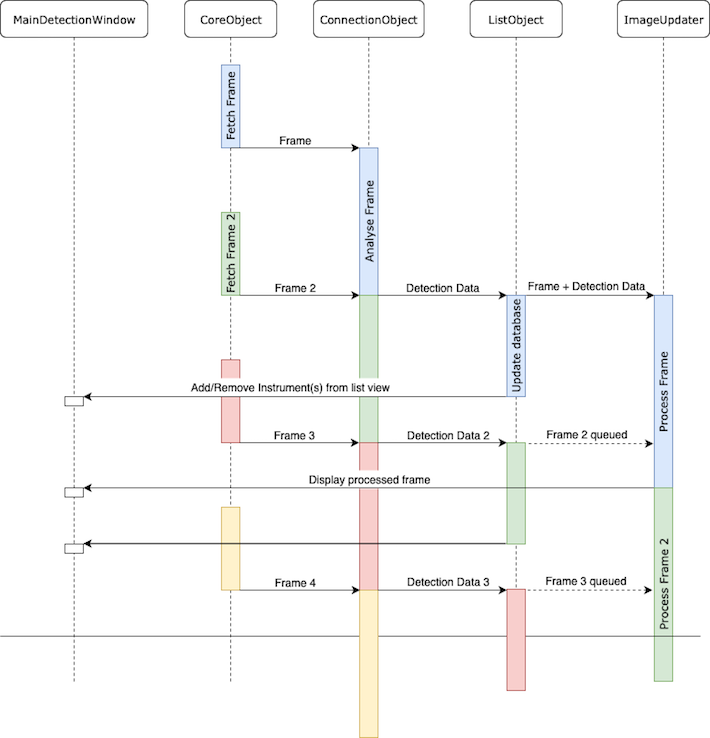
Sequence diagram
The image below showcases the sequence of events taking place in the system:
design patterns
ADAPTER
In our program we have made a database adapter (MySQLAdapter). By doing so we can define what the program specifically wants to do to the database in the function names. This allows us to easily switch out the database used by the application with a different type of database without changing the main application. All the developer needs to do is create their own adapter with the same core functions. These core functions should perform as the name states but should be modified to communicate with the different database used.
OBSERVER
We use the PyQt signals-slots feature to notify different objects about changes in states of other objects. Although not exactly the same, slots act as observers to the signals they are connected to. The slots respond when the signal is emitted which notifies when an object's state is updated.
STATE
In the detection window, the ListObject is constantly updated with changes to the instruments in view. However, the application only logs the changes to the database when the operation is started (by pressing the ‘start operation’ button). Instead of creating two seperate objects, the ListObject stores a state called live_update. When the operation is started, the state is set to True and the ListObject also log changes to the database on top of updating the UI list which it already did.
FACADE
For the transmission of data between the client and server, we created a facade on both ends which simplify the creation and manipulation of the packets being sent between the two. This allows us to just pass a dictionary of the data that we want to be sent into the Message class. The class then handles the formatting and wrapping of the data that needs to be sent internally making the client application’s interaction with the Web API simpler.
THREAD POOL
For our image processor we used a Thread pool. Instead of creating a new thread that draws the detection data onto the frame for each frame, we can recycle the threads used saving time and memory. This is because the number of threads we want to be running at the same time is limited anyway.
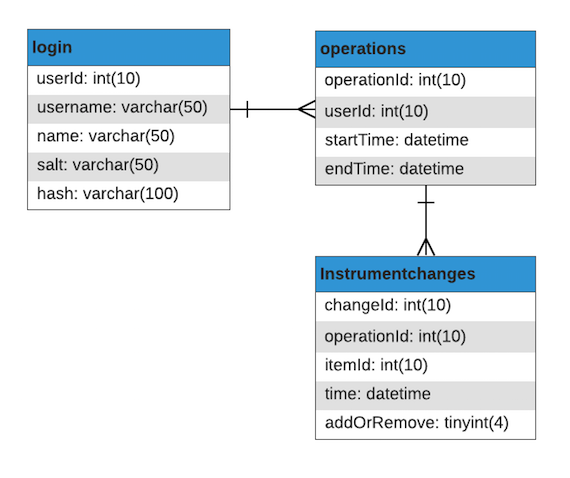
data storage
The system stores all the operation information in relational databases using MySQL. The database consists of three tables:
- Login: User information and details.
- Operations: Operation information and details.
- InstrumentChanges: Changes made in every operation relating to each instrument.
- addOrRemove: binary variable showcasing what action was performed on the instrument
Implementation of Functionalities
Client Application
As the system's main purpose is detection we decided to make the detection speed a priority, for this reason we decided to use PyQt to create our front-end system in order to increase the speed of the application.
The system is comprised of multiple technologies which are described below:
-
Plotly: Python graphing application used to create statistics for the application
OpenCV: a open source programming functionality used for real-time computer vision and object detection.
PyQt: a free cross platform GUI toolkit for Python.
Google's object detection API: Used to draw the data detection onto the images. The API also gives provides a framework over tensorflow.

The system is based on object oriented design allowing the team to create objects that interact with each other such as creating objects for each of the lists displayed in the ‘Final List View’ window. As PyQt is written in python and is object oriented based itself this allows the font-end and back-end to interact closely with one another. This also made the code more readable and easier to understand as the system will be given to the client after the handover.
The user interface is split into 4 main pages. The system follows a simple page flow making interaction with the system extremely easy and intuitive for the user. The main windows consist of ‘Login Window, ‘Detection Window’, ‘Full List Window’ and ‘Statistics Window’ which we discuss below.
LOGIN
When opening the application the system the user is shown the login window where they will be prompted to enter their password. The system requests the user’s login information for the user to later on be able to look-up the statistics to learn and help improve the operation.
In order to keep the system secure passwords are not stored in the database but instead the the team uses salts and peppers to keep the passwords stored securely. The database stores the salted hash as well as the salt itself in order to verify the user when they request to login. The hash is generated using SHA256, a secure cryptographic hash.
The pepper is a randomly generated letter appended to the end of the password before the salt is added. This is just an extra level of security given to the system if the database is comprised the attacker still has an extra layer of security to go through in order to get users information.
The login system takes the unique username given by the user and finds the corresponding hash and salt from the database. The system then checks the given password, salt and random generated pepper with the hash, if the two match the system allows the user to login. The system tries every single pepper option when authenticating. Although this may seem time consuming, it only checks upper and lowercase letters in the alphabet (52 variations) which does not need much computational power.
When designing the system the team also realised that some operations would happen very suddenly, making every second count. For this reason we created the ‘Emergency Login’ Button. This allows users to enter to the system and its detection functionality automatically without having to enter their details. Choosing the Emergency Login functionality does not hinder the system’s functionalities and the system is able to do all that it is intended to do in order to help medical professionals. The only difference when logging in using the Emergency Login functionality is that the system is no longer able to correlate the operation and its statistics to a specific user, therefore the surgeon themselves will not be able to view and learn their statistics as the system cannot find their specific surgeries .
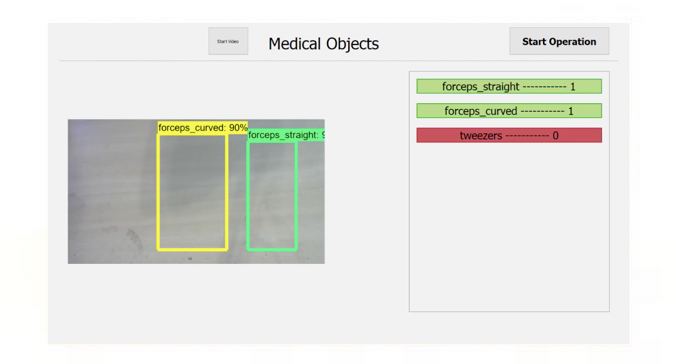
DETECTION WINDOW
This window handles the live detection of medical instruments in the video feed and visualises the information output from the detection model. As the application aims to analyse a live video feed, the efficiency of processing each frame has to be taken into consideration when building the application. If it takes too long to process each image then this would cause a low frame rate or high latency. Thus meaning that using the application wouldn’t be very practical and serve no functionality.
Therefore to try and increase efficiency, we decided to incorporate multithreading into the application. When designing this window we split the processes into 5 sections:
- (Core thread) The Main UI backbone. This handles the various inputs from the user and constantly updates the UI.
- Retrieving frames from the webcam and sending it to the connection object.
- Connection object. This handles the communication with the web API, and constantly sends the frame data to the server and receives the detection data back.
- List object. This object stores all the data about the instruments used in the operation. It will also notify the UI and log to the database when instruments have been removed/added.
- We also need to take the detection data and and draw the information over the frame which will then be displayed on the UI.
The core thread needs to be kept free at all times (to enable a responsive UI), therefore, as much of the processing of data is done outside of the MainDetectionWindow object as possible. During the initialisation of the window, 3 threads are also created which each run one of the objects: CoreObject (retrieves the frames from the webcam), ConnectionObject or ListObject. A thread pool of size 1 is also created for the image processing (drawing detection data onto the frame). The reason a thread pool is used instead of moving an object on to a thread, is so the frames displayed do not lag behind. The application only processes the most recent frame along with its data that has been added to the stack. Therefore, if 2 frames have been added to the queue in the time it takes to process just one, the first frame that was added is then skipped.
To update the UI, specific functions in the MainDetectionWindow object are called using the PyQt signal-slots system. In our application we use the PyQt signal-slots system to communicate between the different threads. Below is a sequence diagram showing how the different threads would interact of and one of the many sequences in which the events occur. The diagram will differ however depending on how long each process takes. After much testing, for our current iteration of the application, we have found that the longest process is analysing the frame (sending the frame to the web server) followed by processing the frame (drawing the data on top of the frame). In the evaluation section we will go further into how this could be optimised if we had more time.
When writing the ListObject we had to take into consideration the reliability of the model and obstructions cause when someone removes or replaces an object. Therefore the list does not update on every frame. Instead the application counts up the number of appearances of each object in the last X number of frames (MAX_LIST_COUNT). Then after every X number of frames, if the number of appearances is equal to or above a threshold (MIN_COUNT_THRESHOLD) it will be added to the list. This list is then compared with the list of the last iteration to find changes. If there is a difference in the lists then the functions item_added or item_removed are called. These functions log the changes to the database and update the UI to represent the new list. By implementing ListObject in this way, it means that if models does not manage to detect an object in 1 frame, it does not remove that item from the list. Likewise, if an object is detected wrongly for 1 frame when it will not add that item to the list. However, this also has its drawbacks as increases the delay between removing an object and the list being updated. We believe that this is still the best implementation as we want the representation of the operation in the database to be as accurate as possible in terms of inst]rument usage.
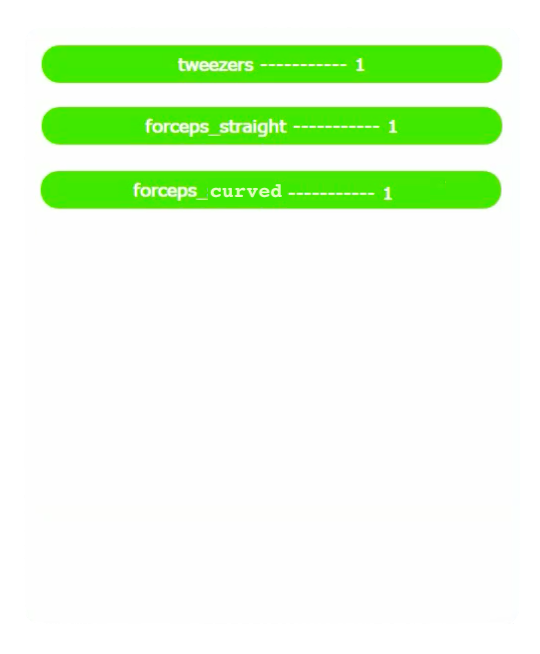
FULL LIST WINDOW
After finishing the operation and pressing the ‘Stop Operation’ button the system opens the Full List Window page which gives an overview of all the instruments that were used. The window is separated into two sections, Full Object list and Missing Object list.
The Full Object list gives a complete view of all the objects used in the operation. The objects inside the lists are from the same ListObject class that the Detection window uses keeping the program more simple and readable (one of the benefits of object oriented design)
The Missing Object list, located on the right hand side of the page gives the user the opportunity to view all the objects that are not accounted for in the final detection in one place so that they can make sure all objects are accounted for. The objects in the list also act as button that allow the user to click on each one once the object is accounted for. If there are multiple instances of the object that are missing the user can click on the object to decrease the missing count. This list does not use the same class system as the others as it is interactable and PyQt does not allow labels to change into buttons.
The window also gives access to the statistics function. Unlike previously in the system where the user could not go back to the previous page, the user now has the ability to toggle between the two windows in order to get a comprehensive look at the system.
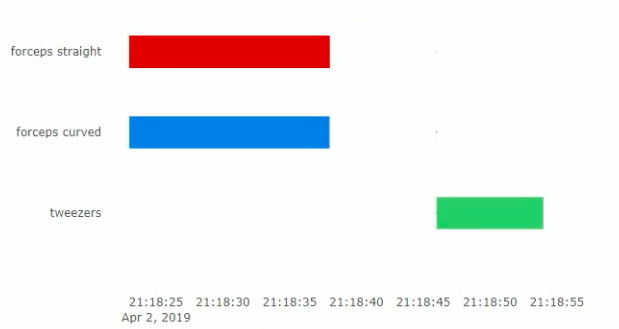
STATISTICS
The Statistics window is made in order to show the operation statistics, what instruments were on the tray, at what time and for how long. By having access to these statistics doctors will be able to get a complete view of what happens during the operation and what can be done to optimize the process.The window can be accessed from the Full List Window allowing the user can toggle between the two.
An example of this is if an instrument is missing and the user does not remember when it was used. By having the options to go back and forth the user can see at what time the instrument was used which can help find out where it was placed.
The team decided to visualise the information using a Gantt chart with each row showcasing the usage of a single tool. The team looked into using different graph types but ended up using gantt as the cart allows the user to get a complete view of the operation and and more importantly when each instrument was used. This is very important as other charts such as Pie or Bar charts do not take timings into consideration.
We decided to use Plotly as out a graphing application it would allow easy expansion later on if we decide to update the statistics and add another option. Plotly is also very well integrated with python and can be adapted easily to the system The application also gives an auto scaling opportunity when viewing graphs and is therefore very useful when viewing longer operations with a variety of different tools.
Cloud Based API
The Cloud API handles the detection of instruments for our application. It can handle multiple connections and can therefore support multiple client running at the same time. The API is written using Python and the main libraries it uses are:
- TensorFlow (GPU): used to run inference on the images it receives.
- Selectors: Allows the API to handle multiple connections giving each connection its own read/write events.
- Sockets: Wrapper for the transmission of data between client and server. Allows the data to be streamed in both directions along the connection.
For our project we want to analyze live data from a video feed which means that the detection of the objects have to be fast as. Although we could have included the object inference within the client application, the speed in which we could run the live detection data would be very slow if the computer is not compatible with TensorFlow GPU. As the client application also has to render the video feed and the UI onto the screen, the performance of the application would be further decreased. When using TensorFlow CPU, we found that we would be limited to around 1 frame every 10 seconds compared to up to 10-20 frames a second using TensorFlow GPU, a significant improvement. However TensorFlow GPU requires a compatible GPU which are very expensive. Thus, making our project not very scalable as it would be very costly to have such a setup on each client machine.
To get over this problem, we decided to run the inference on a web service, thus allowing the client application to be run on any device without its performance being affected too drastically.
To send data between the client and server, we used the Python sockets library. This allows us to open a TCP connection between the two allowing data to be streamed in both directions. The client application sends one frame of data to the server in a packet, which is then unpacked and run through the inference graph. The detection data is then all sent back to the client in a single packet and the loop starts again until the client closes the connection. To build the API we used the Nathan Jenning’s tutorial to help us along the way which can be found here.
Come See Us @ UCL
University College London (UCL)Gower Street, London