Evaluation
1. Summary of Achievements
1.1 Achievement Table
The group was determined to get all functionalities done to perfection. Following this ideal, all Must-haves, Should-haves and Could-have features were fully implemented or performed.
| ID | Requirement | MoSCoW Category | Priority | Completed? | Main Contributors |
|---|---|---|---|---|---|
| R1 | Identification of all hazards in a report according to the UNDRR-ISC Hazard Information Profiles (HIPs) | MUST | 1 | YES | All |
| R2 | Intra-Hazard linkage classification, clustering of hazards | MUST | 1 | YES | Wonjun |
| R3 | Semantical Similarities Warning System | MUST | 1 | YES | Jasper |
| R4 | Individual Components Testing | MUST | 2 | YES | All |
| R5 | Ranking hazards by order of occurrence and impact | SHOULD | 3 | YES | Aryan |
| R6 | Easily view hazard definitions | COULD | 4 | YES | All |
| R7 | Export hazard data in standard formats | COULD | 4 | YES | All |
| R8 | Upload text files | COULD | 5 | YES | All |
| R9 | Accessibility features | COULD | 5 | YES | All |
| Key Functionalities (Must haves, Should haves) | 100% Completion |
|---|---|
| Optional Functionalities (Could haves) | 100% Completion |
1.2 Known Bugs
Following extensive testing of the entire codebase, the group identified several bugs and pushed updates that fixed them.
| ID | Bug Description | Priority | Fixed? |
|---|---|---|---|
| BUG1 | Tool sometimes spams the GPT API for no reason, exhausting OpenAI credits | 0 | Yes |
| BUG2 | API returns 400 error code because functions do not explicitly return anything | 0 | Yes |
| BUG3 | Some clarification questions are presented as “None” | 1 | Yes |
| BUG4 | Association Matrix deployment script makes nested HuggingFace directory that is unnecessarily complex | 2 | Yes |
| BUG5 | Command-line rules-based model represents empty upstream hazards list as NaN, causing type mismatch | 2 | Yes |
1.3 Individual Contribution Distribution Table
All members worked equally as hard to produce a deliverable they were all proud of.
| Work Packages | Wonjun | Jasper | Aryan |
|---|---|---|---|
| Project Partners Liaison | 5% | 5% | 90% |
| Requirement Analysis | 33% | 33% | 33% |
| Research and Experiments | 33% | 33% | 33% |
| UI Design/Coding | 5% | 5% | 90% |
| API Coding | 5% | 90% | 5% |
| Associations Matrix | 90% | 5% | 5% |
| Semantical Similarities Matrix | 5% | 90% | 5% |
| Testing | 33% | 33% | 33% |
| Website Content | 33% | 33% | 33% |
| Project Website Code | 90% | 5% | 5% |
| Presentations | 33% | 33% | 33% |
| Overall Contribution | 33% | 33% | 33% |
| Main Roles | Researcher, Components Developer, Report Editor | Researcher, Core API Developer, Components Integrator | Researcher, Frontend Developer, Project Administrator |
2. Critical Evaluation of Project
2.1 Empirical Analysis of Tool (Functionality)
To quantitatively determine the accuracy and efficacy of both tool variants, the group experimentally compared tagging reports manually and using the tool to tag the reports.
Ten reports of differing content and lengths were manually tagged by a group member (amateur), as well as a classification expert. The same reports were then run through both the rules-based model and the GPT model. For simplicity, the following terms are defined and referred to as such from here on:
- Expert Manual (E_M): the classification process that was manually conducted by a hazards classification expert.
- Amateur Manual (A_M): the classification process that was manually conducted by an amateur (group member).
- RB: the classification process as conducted by the rules-based approach. **
- GPT: the classification process as conducted by the GPT-based approach. **
- Expert RB (E_RB) / Expert GPT (E_GPT): the classification process as conducted by the expert using the RB / GPT tool.
- Amateur RB (A_RB) / Amateur GPT (A_GPT): the classification process as conducted by a group member using the RB / GPT tool.
** Used in scenarios where the details of the user does not matter; for example during the analysis of matched questions. In this case, it does not matter who the user is, as the skills of the user is independent to the result.
2.1.1 Absolute Correct Hazards Percentage (pre-confirmation)
The first experiment compared the absolute correct hazards percentage. This was a percentage of how much of E_M’s matched hazards was identified. For example, if E_M matched 10 hazards, and another participant matched 9 of the 10 hazards, their score would be 90%. To calculate the Absolute Correct Hazards Percentage, the total number of correctly identified hazards across all ten reports was divided by the total number of hazards produced by E_M across all ten reports. Through this, the group measured the absolute efficacy of using the tool.
E_M’s answer was taken as “ground truth” - that is, since E_M’s answer would be the closest to a theoretical “perfect” answer, it was set as the metric for comparison.
Participants: E_M (ground truth), A_M, RB, GPT
Measured: Percentage of Correct Hazards matched in relation to E_M
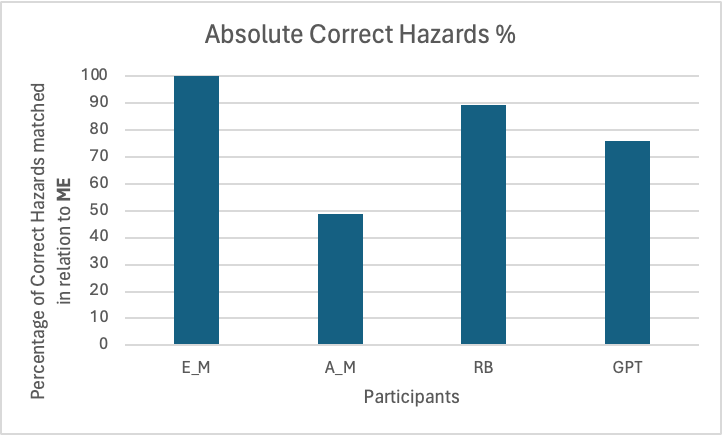
Figure 2.1.1: Comparison of the Absolute Correct Hazards for each participant.
As demonstrated by the table, both RB and GPT displayed remarkable performance, especially compared to a non-expert. RB, as expected, identified almost 90% of the hazards that were identified by the expert using its overzealous strategy. Whilst the GPT version did not quite identify as much, it still identified almost 80% of them; the amateur in comparison failed to even identify 50% of them.
2.1.2 Accuracy of Identified Hazards Percentage (pre-confirmation)
The second experiment compared the accuracy of hazards identified in relation to ME. This was a percentage of the number of “correct” hazards compared to the number of hazards identified. For example, if a participant identified 9 hazards that the ME identified in a pool of 20 total identifications, the accuracy score would be 45%. To calculate the Identified Hazards Percentage, the total number of correctly identified hazards across all ten reports was divided by the total number of identifications produced by that participant across all ten reports.
Once again, E_M was taken as ground truth.
Participants: E_M (ground truth), A_M, RB, GPT
Measured: Percentage of hazards in total hazards matched that was also matched by E_M
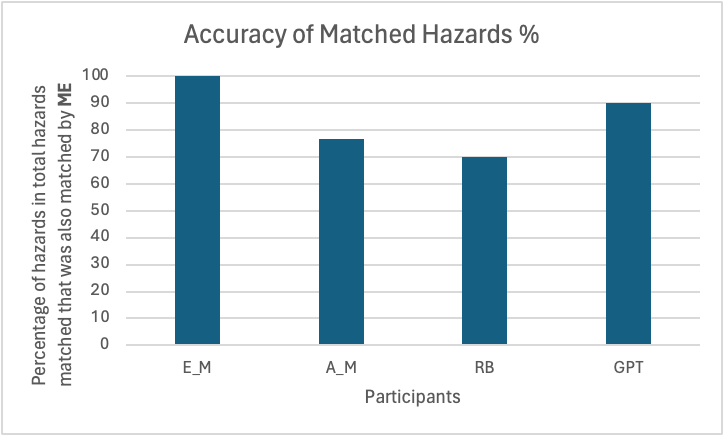
Figure 2.1.2: Comparison of the Accuracy of Matched Hazards for each participant.
Unlike the Accuracy Correct Hazards Percentage, GPT took the spotlight here with 90% of all identified hazards being correct. This meant that GPT identified hazards were likely to be relevant. Meanwhile, RB struggled in this metric: its overzealous nature that powered its ability to find the most correct hazards also made it identify multiple irrelevant hazards.
2.1.3 Time taken (including confirmation)
The final experiment compared the time taken to classify the report. The time taken in seconds was recorded.
Participants: E_M, A_M, E_RB, E_GPT, A_RB, A_GPT
Measured: Time taken to fully classify report
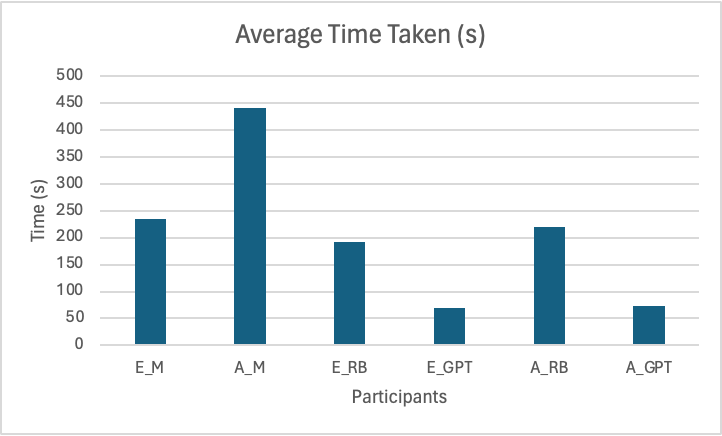
Figure 2.1.3: Comparison of the time it takes to classify a report for each participant.
In terms of how long it took for a user to classify reports, it was no surprise that both E_GPT and A_GPT took the top spot here. What was rather a nice testament to the success of this project was that the both E_RB and E_GPT took less time than E_M, and certainly much less time than A_M. This was even considering the overzealous nature of RB. Interestingly, the time differences between an amateur and expert using the tool was almost negligible, demonstrating that the tool did not require any expert training.
2.1.4 Conclusion
The group is very pleased to demonstrate that the classification tool identifies between 70-90 percent of the hazards that an expert would when manually tagging the report. This is also accomplished in a significantly shorter amount of time. The tool does not discriminate between experts and amateurs, meaning that anybody can begin tagging reports at this same accelerated pace. Overall, the group was pleased to have made the field of hazard classification more accessible and faster - this solved every important requirement and pain point that they had set off to resolve.
2.2 UI / UX
Although the frontend was not a main focus of this project, the group still considered it vital to create a streamlined and intuitive UI that would serve as a template and concept to the clients. The UI was designed to be as simplistic as possible so that anyone with any level of technological expertise could use it without needing any help.
As user acceptance testing showed, the target groups appreciated the easy-to-learn nature of the tool and the speed at which they were able to complete the classification process - there was no need to consult documentation or the user manual to simply use the tool. Thus, the group members considered the UI to be successful in making hazard classification more accessible.
2.3 Stability
The project was especially crafted to be as stable as possible - the reliance on third party cloud servers and APIs made sure that internal mishaps would not hinder the usage of the tool. Alongside this, an option to forgo to GPT API (the rules-based version) also covered the scenario if OpenAI servers were to go down.
The code was also written so that GPT API could be replaced with any LLM API - it was simply a matter of changing the API endpoint. This further allowed for stability in making sure that the tool was not heavily dependent on one singular 3rd party. The only scenario in which the tool could be rendered unreachable would be in the event that Google Cloud Functions would go down - however, the Express.js framework allows for local launching of the API in emergencies.
2.4 Efficiency and Benchmarking
The usage of Google Cloud functions to process all server-side calculations allowed for an easily scalable deployment of the tool. Google Cloud functions allows for a maximum instance count of 59, allowing for reasonably high calls to the tools API to be handled with ease. During the testing, even 1000 concurrent API calls in parallel were handled with no problems, returning a 200 OK value for every call.
In terms of how long it takes for the tool to run, both user acceptance testing and empirical analysis revealed that the processing times on the actual tool itself were very reasonable. As testing showed, the GPT tool (even with its buffering time for the LLM to respond) still took significantly less time to finish a classification than an expert manually classifying a report.
In conclusion, the tool was successful in performing well under extreme stress, and also provided all of its functionalities and services without having to bottleneck the user’s workload.
2.5 Compatibility
During the testing phase, both the frontend UI and the tool itself were tested on multiple devices with varying performance, display sizes, and operating systems. The group was especially proud to demonstrate that the tool was able to run flawlessly on any modern device. This was in part due to it being heavily API based (with most of its computations being handled by Google Cloud), as well as the extremely lightweight Streamlit UI. Recognising the real-world scenarios where users might need to access the tool under resource-constrained conditions, ensuring its compatibility across any sort of devices was deemed an important objective. This commitment demonstrated the group’s dedication to delivering a solution that remained accessible and functional regardless of the user’s environment.
2.6 Maintainability, Extensibility, and Testing
The group considered good code practices to be of significant importance during the course of the entire project. This was to ensure a smooth handover of the codebase to the IFRC. Principles such as DRY and KISS, as well as the use of several Object-Oriented Principles further increased the degree to which the code was extensible and maintainable.
With all major methods and components documented with inline comments and docstrings, as well as with an entire comprehensive document on the various files and components, the group made sure that anyone reading the code would instantly understand every design choices and code details that were implemented.
Unit-testing and integration testing also played a crucial part in making sure that the code was bug-free and that all components worked as expected. The API, which formed the crux of the code, was tested to extensively to 100% coverage. Integration testing was performed by only mocking Axios and hazardDefinitionService , as they required external calls. This made sure that all API components were able to not only function as expected individually, but also together. To bring this all together, GitHub CI/CD was employed to make sure that new changes did not break existing features.
Through following such core software development principles, the group made sure that the code was as clean as possible allowing extensibility and maintainability of the codebase.
2.7 Project Management
The group members specifically emphasised collaboration during the entirety of the project. All progressions or status updates were detailed on Notion. In addition to this, the constant updating of the Gantt Chart as well as taking meeting minutes for every meeting boosted the team’s productivity. As a result, the team was able to flawlessly function as one entity to achieve their goals without any inter-communicational bottlenecks.
3. Future Work
Although the team was very proud of the work they had completed, they recognised that this was only the beginning - if there would have been more time, they would have implemented the following features.
3.1 Combining Rules-Based and GPT-based
The main change that the group would have wanted to implement given enough time was to merge the rules-based and GPT-based tool together. Given their specific advantages and disadvantages, a combination of the two would serve as a singular tool that would have the best of both worlds. Below, a couple of approaches to combination are listed: they are ranked according to what the group thought was the best approach.
3.1.1 Dual-Pass Approach
Perhaps the best method to approach this problem is to first generate a list of hazards through the rules-based version, then pass the list through GPT to eliminate redundant hazards and to match inferred hazards. As thus, the final questions list would be significantly refined, but still include implied hazards for a more accurate classification approach.
Unfortunately, this is easier said than done: LLMs tend to refuse extreme ends of probability. That is, LLMs avoid telling users that something is “impossible” or “always happens”, as this could theoretically not hold. This means that if implemented improperly, the pass through to GPT could not filter out any irrelevant hazards, making this dual-pass approach redundant. Given more time, the group could experiment with fine-tuning and prompt-tuning the LLM to reduce the probability of hallucinations or unwanted behaviour.
3.1.2 User-Choice Approach
Another (perhaps less intuitive) way of combining the two variants is to first return hazards generated by GPT, and then have a toggle for “advanced mode” - that is, allow the user to choose whether they see the further matched hazards from the rules-based model. This would preserve the advantages of both models except for the time aspect - it would still take a longer time to complete all of questions that the overzealous rules-based model surfaces.
3.2 Clustering of hazards through statistical analysis techniques
As mentioned throughout the project, the association matrix is meant to be replaced later on with actual probabilistic data generated through the aggregation of big data. Given (significantly) more time, the group could have allowed the IFRC to use a beta version of the tool to begin clustering and gathering real hazard correlation data. They could also have implemented a database and storing mechanism that keeps track of all tagged reports and automatically generates probability values for intra-hazard links.
3.3 Proper language translation
As the IFRC is a largely international organisation, the tool could have been translated into various languages to increase accessibility to everybody around the world. This was indeed an optional feature that the group was considering at first - due to the lack of time and the logistical problems of translating the entirety of the hazards_definitions.xlsx in a group of just three (English-speaking) members, this was eventually deemed beyond the scope of this project.
Translation can be done rather easily: only the hazard_definitions.xlsx database would need to be translated. Embeddings models operate beyond languages, and hazard associations would be the same regardless of the representation language.
3.4 Fine-Tuning LLM specifically for hazard classification
A very ambitious future project (that is very beyond the scope of this project yet still relevant) would be to fine-tune an in-house LLM specifically for hazard classification. This would potentially allow for even more accurate hazards to be matched by the LLM. However, many hurdles would need to be overcome for this to be viable: the least of which is the server costs to maintain several running instances of the LLM.
If taken further, the LLM could simultaneously tag the report and also answer the clarification questions itself - making for a truly abstracted classification process.
3.5 Accessibility Features
The group could have implemented more convenience and accessibility features given more time. Although features such as dark mode and high contrast was implemented, more features such as a narrator function, dark mode, magnification capabilities, and others could have been included as well. Although the group recognised the importance of the accessibility, they considered it a lower priority to implementing the main functionalities of the tool. In addition, many of these features are dependent on the front-end component - as this project was mainly back-end focused, it was further pushed to the lower priority levels.