Project Overview
1. High-Level Design
In this section, we will talk about the project structure and its various components. It will also explain how they link up together to create the final deliverable.
1.1 High Level Overview
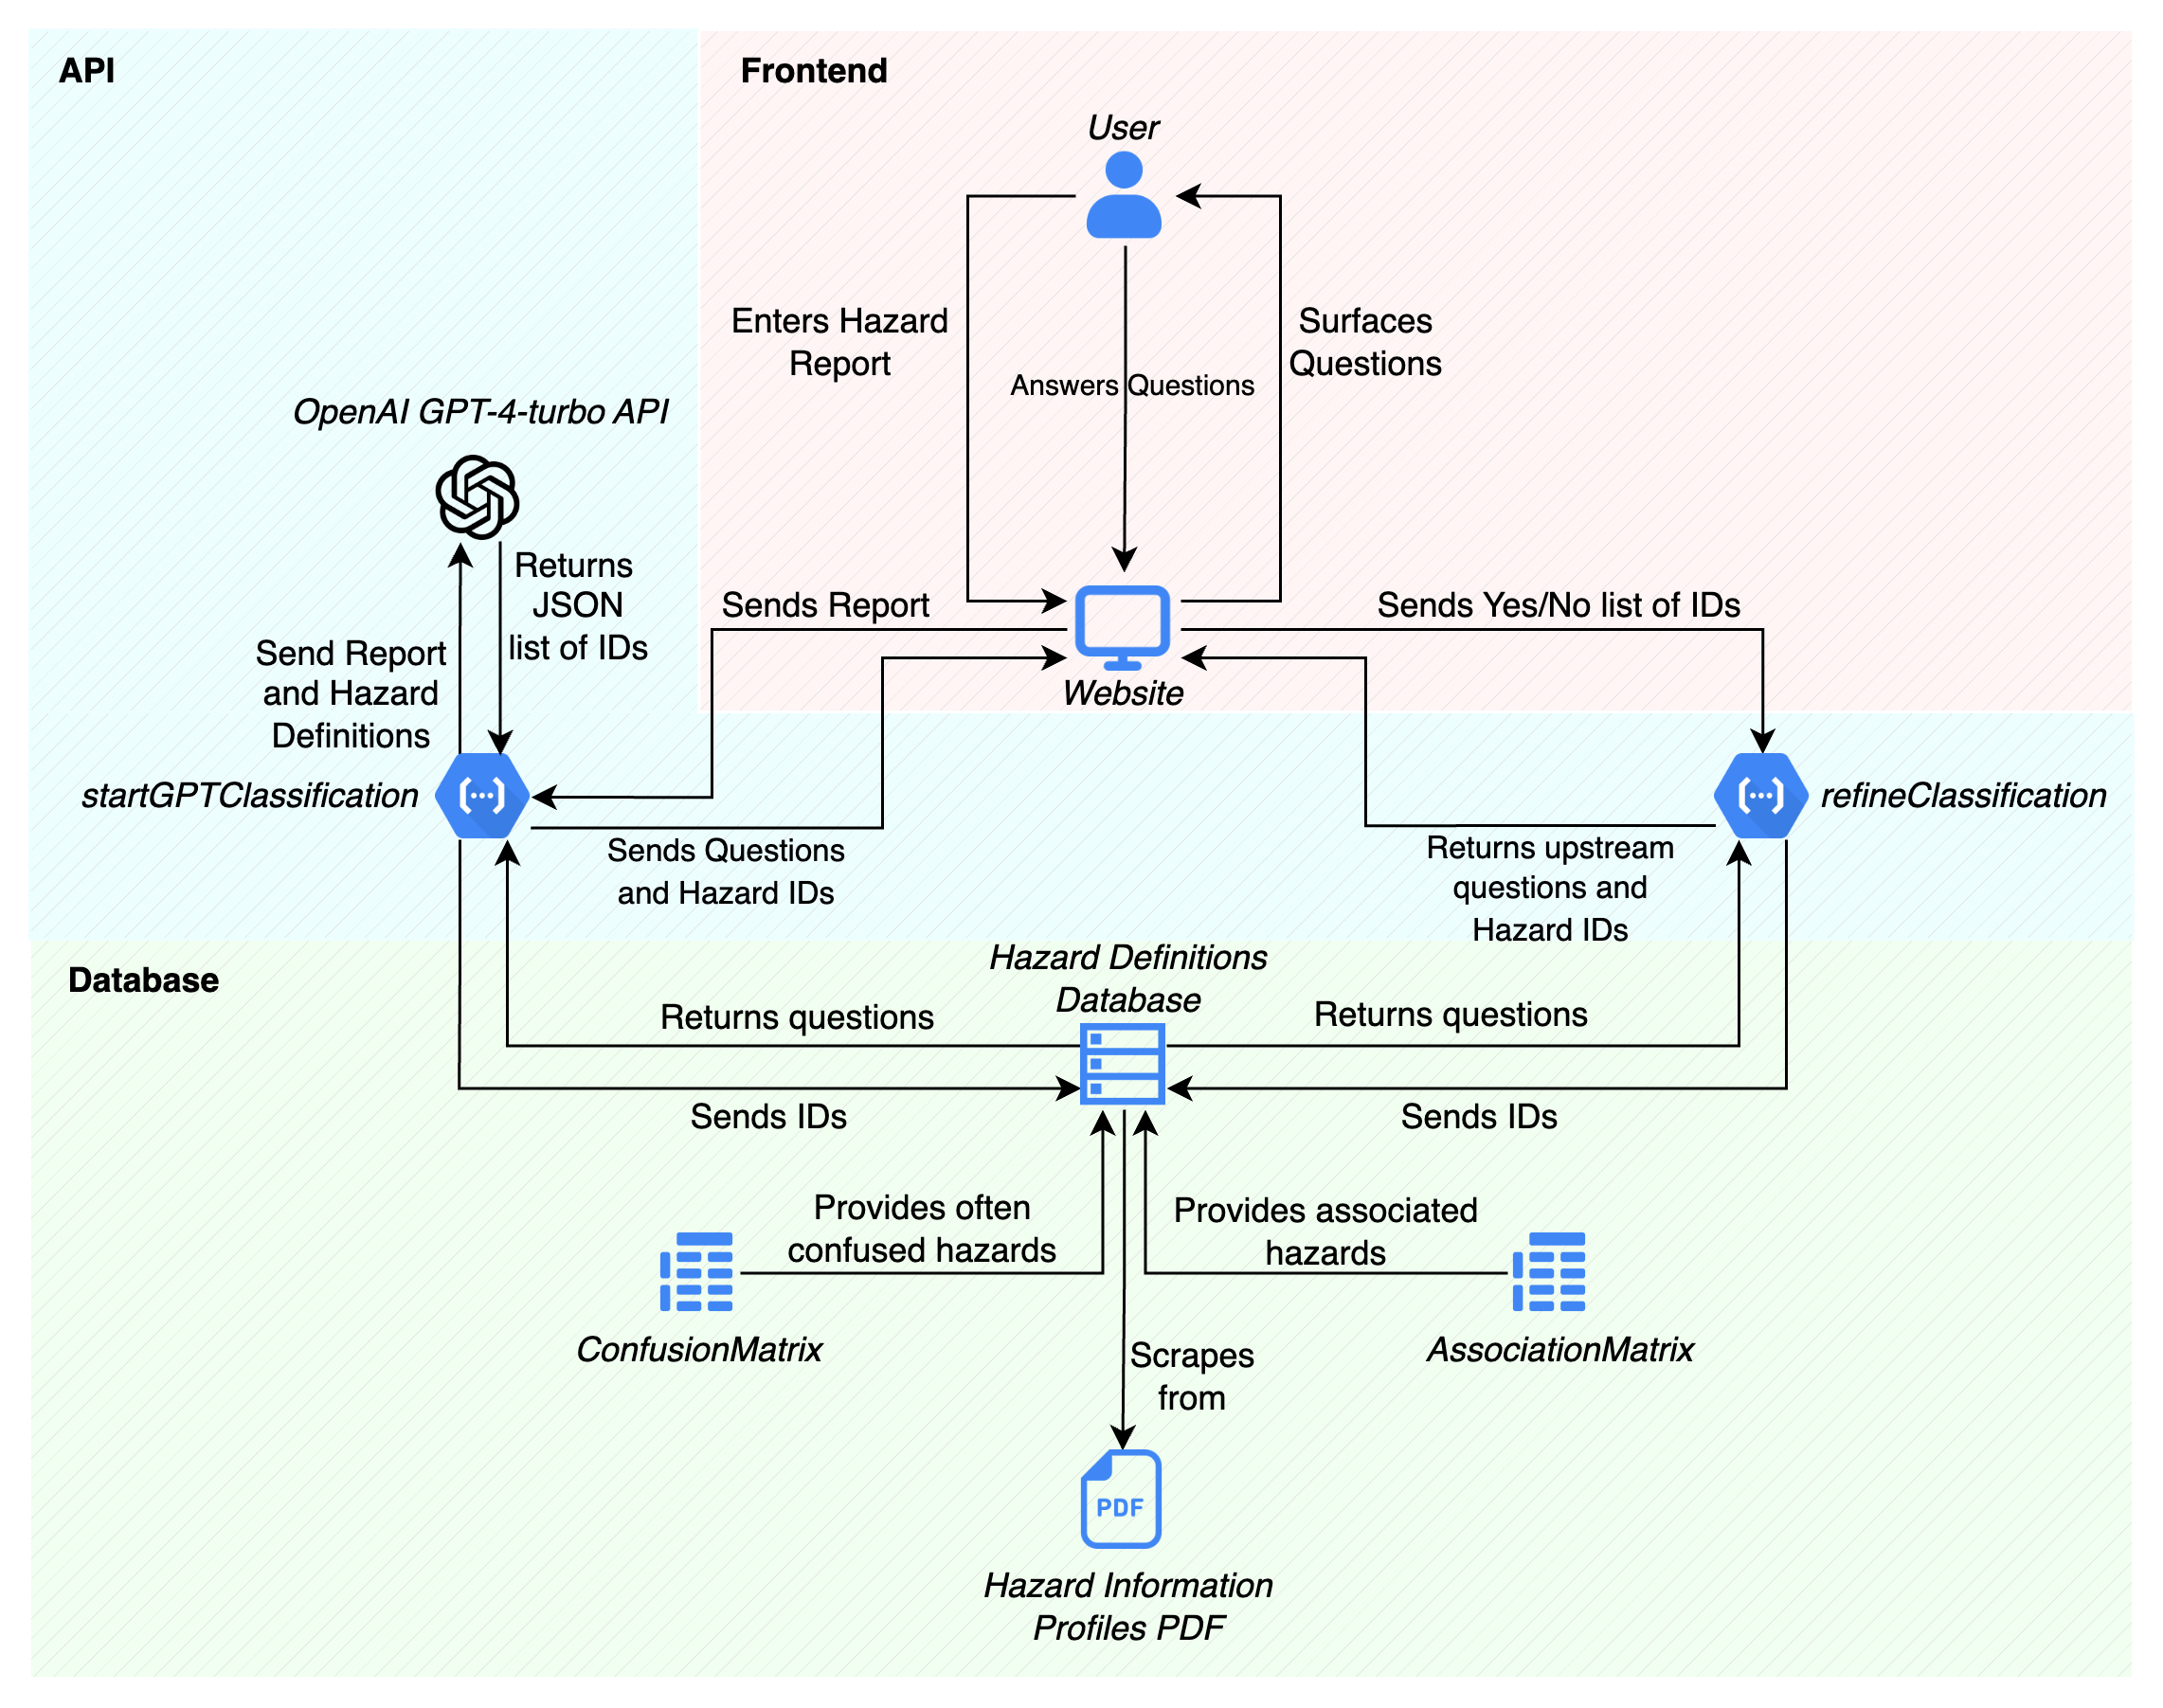
Figure 1.1a: A comprehensive overview of the entire tool.
N.B. where databases are mentioned, the group members do not reference a formal SQL or similar database. The clients specifically mentioned that the group members should focus on the core backend functionality, and that creating a formal database was beyond the scope of the project. The term ‘database’ is mentioned here, as the spreadsheets and JSON files used in lieu of them could very easily be translated into a formal database.
When the user inputs a hazard report into the website (front-end), the website forwards the report to the startClassification endpoint of the tool API. The next action in the program flow differs slightly depending on whether the machine learning or rules-based model is selected.
If the machine learning model is selected, the tool API sends the report and hazard definitions to the OpenAI ChatGPT 3.5 Turbo to be processed. When ChatGPT finishes processing, it returns a JSON list of matching hazard ID’s back to the tool API.
Conversely, if the rules-based model is selected, the API does not send the report to OpenAI. Instead, the natural framework for JavaScript is used to match keywords within the report. A list of matching hazard ID’s is then generated.
The tool API then matches the hazard ID’s to its appropriate clarification questions as per the hazard definitions database (currently, an Excel spreadsheet), and acquires the necessary clarification questions. It then sends the matched hazard ID’s and questions back to the website, where it is surfaced back to the user.
When the user submits the answers to the clarification questions, the website sends the results to refineClassification, another tool API endpoint. refineClassification then checks for any upstream hazards through the AssociationMatrix database. If any exist, it checks the Hazard Definition Database and returns a new JSON of matching upstream ID’s and clarification questions. This continues until there are no more upstream hazards remaining.
Finally, refineClassification correlates the final list of identified hazards with the ConfusionMatrix database, and acquires a list of commonly confused hazards for each identified hazard (if any). These are then returned back to the website to be surfaced to the user.
1.2 Overview of Individual Components
1.2.1 API
The tools API is the main component of the entire project. It connects the website front-end with the ChatGPT API and the various databases, acting as an intermediary processor between each individual component.
The API is written entirely in JavaScript, using the Express.js framework. This Node.js framework streamlines the process of creating back-end APIs by abstracting the fine details of handling HTTP requests and responses, routing, and middleware integration. The framework’s modular nature also allows for easy extension, which was a core requirement set by the client.
1.2.2 Website (front-end)
The website is the platform on which the user would access the tool. It provides an intuitive UI that abstracts all details of the API to the user.
The website was written in Python, using the Streamlit framework. This allowed a quick and attractive front-end to be put together quickly. Since the UI was not a primary focus for the team, a swift and straightforward solution was required to effectively showcase the back-end. Once integrated into the client's platform, the tool would adopt its own UI to align with the existing platform. Therefore, dedicating significant time to this aspect was deemed unnecessary.
1.2.3 AssociationMatrix
The AssociationMatrix component is a database holding information on intra-hazard relationships. For every individual hazard, the likelihood that it could cause another named hazard is recorded.
The AssociationMatrix was generated using the Llama2 Large Language Model (specifically, the 5-bit quantised model llama-2-13b-chat.Q5_K_M.gguf provided by Meta and TheBloke on HuggingFace). The model was prompted with inquiries about the feasibility of hazard 1 triggering hazard 2. It is important to note that this LLM-based approach to the AssociationMatrix is meant to be a stopgap solution. When the tool is further developed and the taxonomy scheme is more broadly adopted, the matrix is intended to be replaced with a database generated through the aggregation of empirical data.
1.2.4 ConfusionMatrix
The ConfusionMatrix component is a database containing information on commonly confused hazards. For every individual hazard, the semantical similarity (that is, how similar the words are) is recorded.
The ConfusionMatrix was generated using the “all-mpnet-base-v2” embeddings model to leverage sentence embeddings. This helped capture the semantic relationships between the hazard descriptions. The hazard descriptions were first encoded using the SentenceTransformer model, and then a similarity matrix based on cosine similarity was produced.
1.2.5 Database Structure
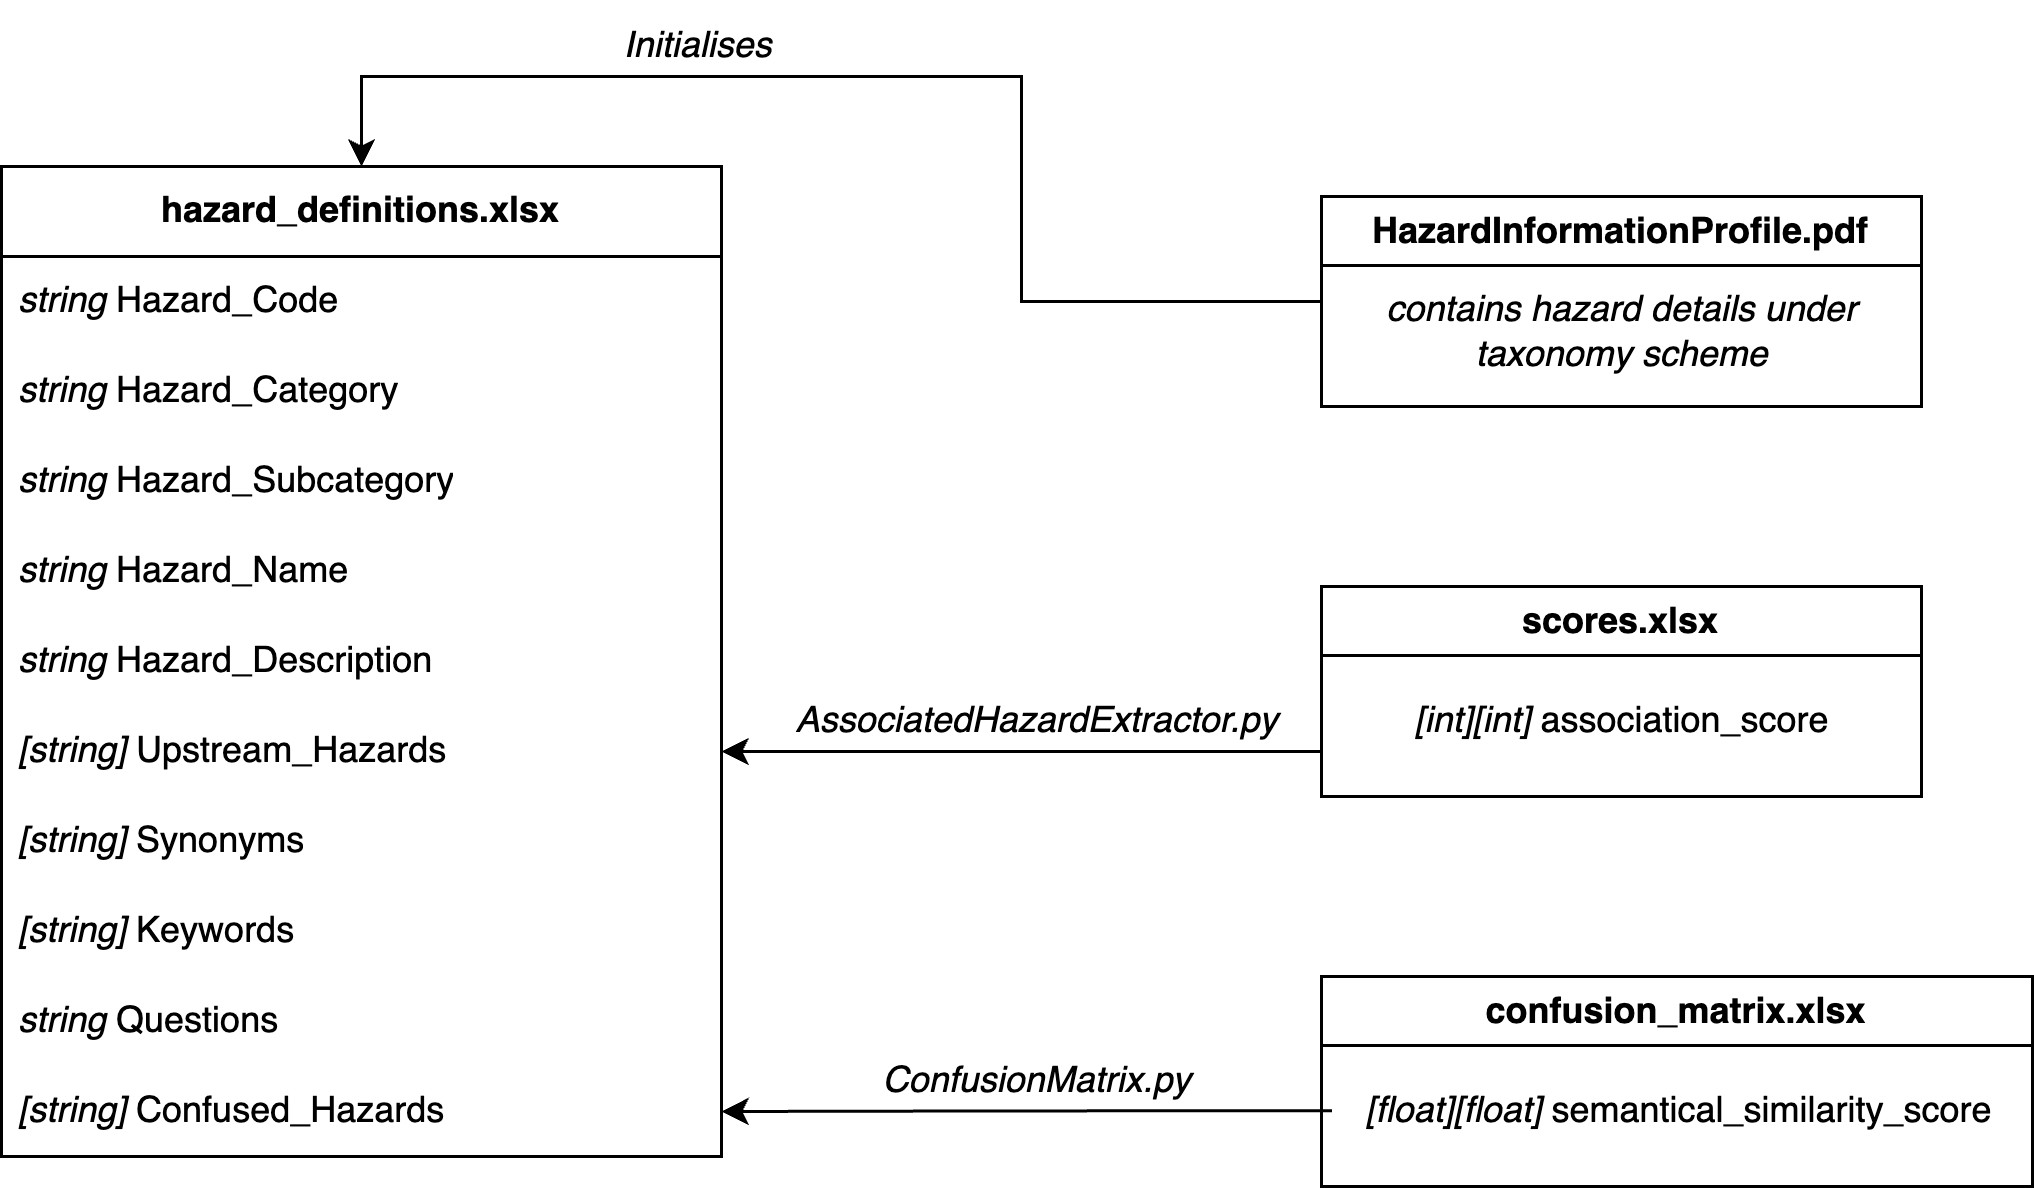
Figure 1.2.5a: ER Diagram of the database structure of the tool.
The main database for the tool is a spreadsheet called hazard_definitions.xlsx. It contains the following information:
| ID | Type | Name | Description |
|---|---|---|---|
| HD1 | string | Hazard_Code | The official unique hazard code. |
| HD2 | string | Hazard_Category | The high level category to which a hazard belongs. |
| HD3 | string | Hazard_Subcategory | The more specific subcategory to which a hazard belongs. |
| HD4 | string | Hazard_Name | The official unique hazard name, in English. |
| HD5 | string | Hazard_Description | A brief description of the hazard, in English. |
| HD6 | [string] | Upstream_Hazards | A list of other hazards that are associated with the hazard. |
| HD7 | [string] | Synonyms | A list of synonymous terms that could a hazard could be referred to as. |
| HD8 | [string] | Keywords | A list of keywords that could reference the hazard. |
| HD9 | string | Questions | A clarification question that asks whether a hazard was present. |
| HD10 | [string] | Confused_Hazards | A list of other hazards that are semantically similar in description to the hazard. |
Most of the information comes from text scraping the Hazard Information Profile PDF. However, HD6 and HD10 come from separate databases.
HD6 (Upstream_Hazards) comes from scores.xlsx, which is the product of the Association Matrix. HD6 was generated by iterating through the columns of a row in the matrix, and extracting any hazards that were marked with a score of 4 or higher. This was done by the AssociatedHazardExtractor.ipynb Jupyter notebook.
Similarly, HD10 (Confused_Hazards) comes from confusion_matrix.xlsx , which is the product of the Confusion (Semantic Similarities) Matrix. HD10 was generated by iterating through the columns of a row in the matrix, and extracting any hazards that were marked with a score of 0.8 or higher. This was done directly in the ConfusionMatrix.py script as soon as the matrix was generated.
1.3 Sequence Diagrams and Program Flow
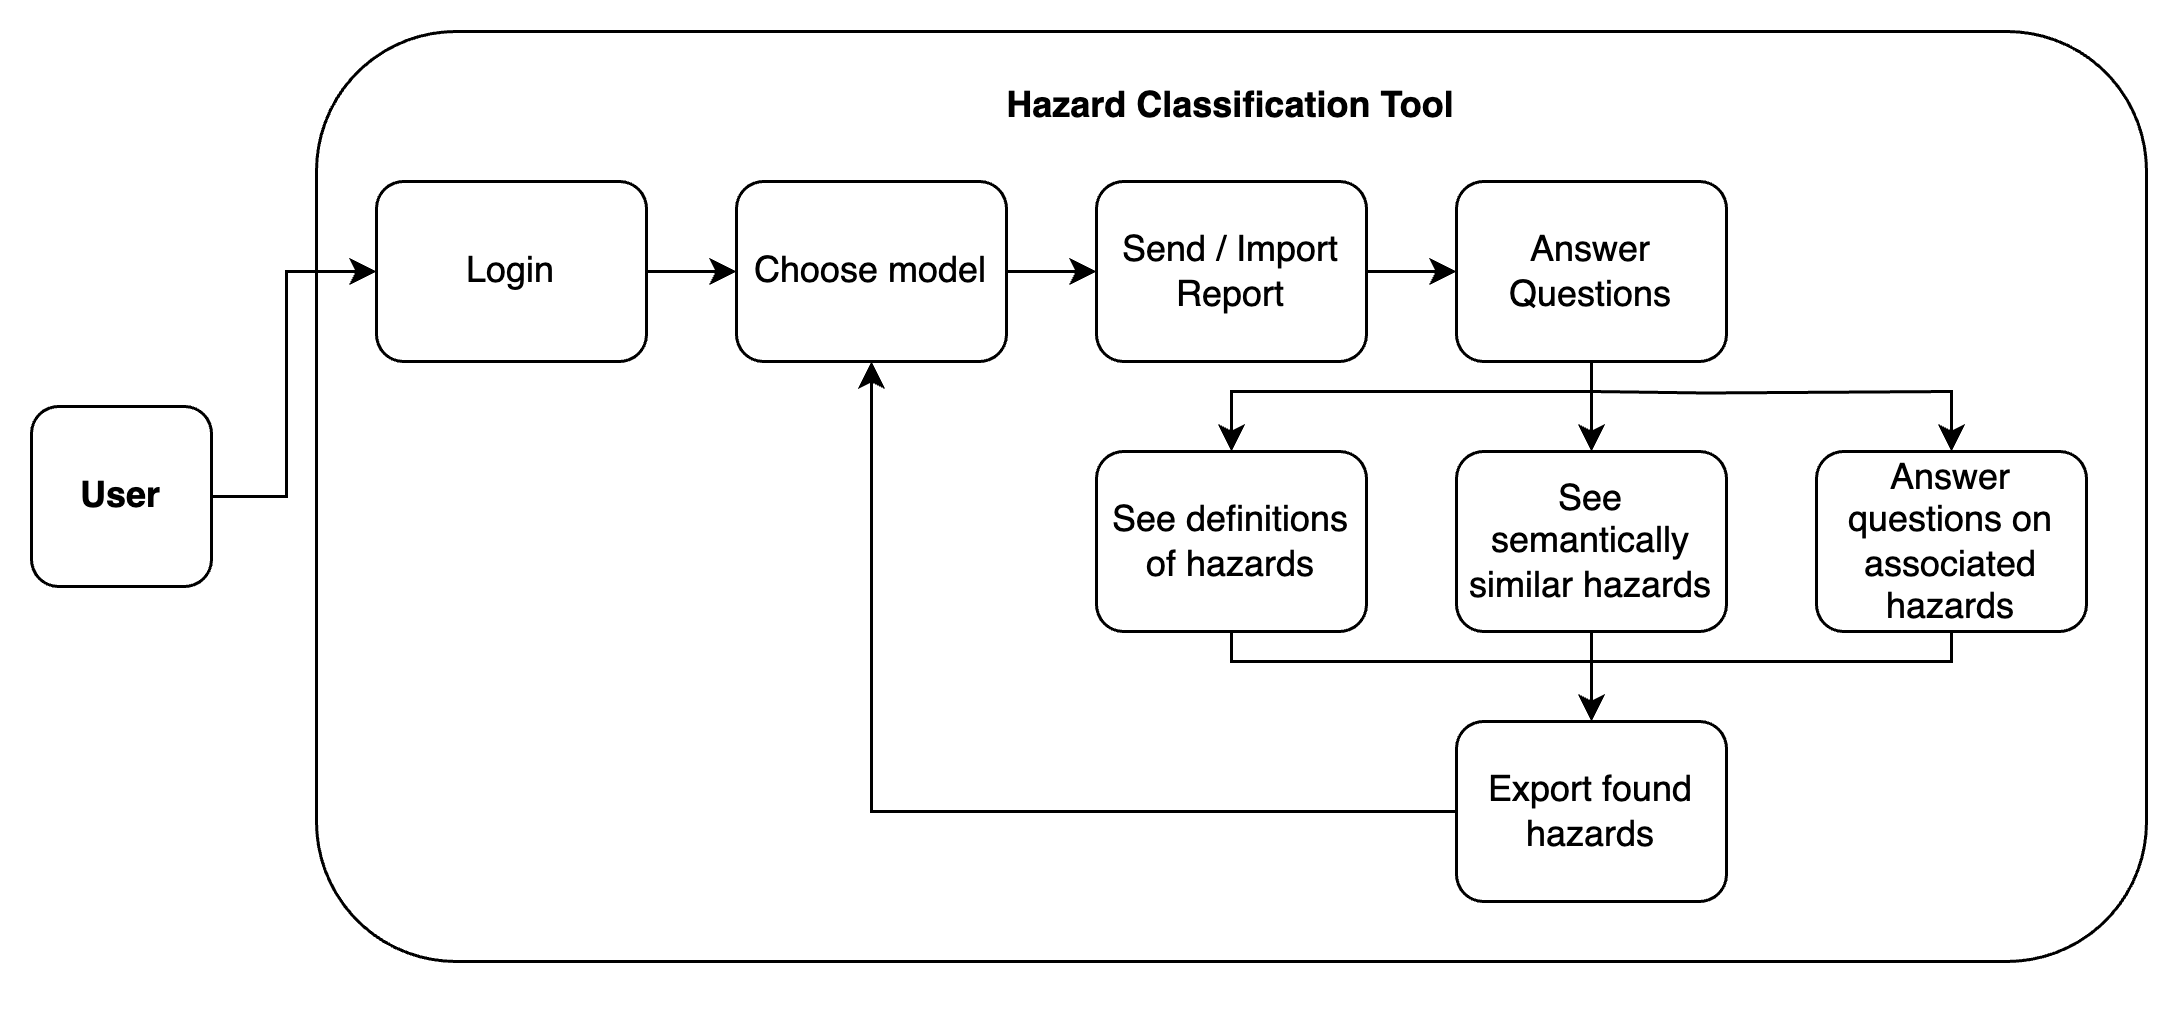
Figure 1.3a: A simple program flow diagram of the tool.
For the user, the process of classifying a report is rather simple. After logging in, they are presented with a choice between the two models. There is a brief description of their differences and how they work on the page as well. Once the user makes their selection, they can then send in their input report. They are then presented with clarification questions, to which they can answer either yes or no. The user can also check out the hazard definitions.
Once the user submits the first round of questions, they are presented with clarification questions of the upstream hazards. When those are answered, the user is left with a list of confirmed hazards. They can then check out commonly confused hazards, as well as export the list of confirmed hazards as a JSON file. Finally, they have the option to either start over or rerun the same report with the other model.
2. Front-end Design
While the frontend was not the main focus of this project, the team members still devoted some time to making the UI and UX as streamlined as possible. The goal was to create an intuitive and easy-to-learn interface whilst not becoming distracted from the main backend project.
2.1 Initial Sketches and Mockups
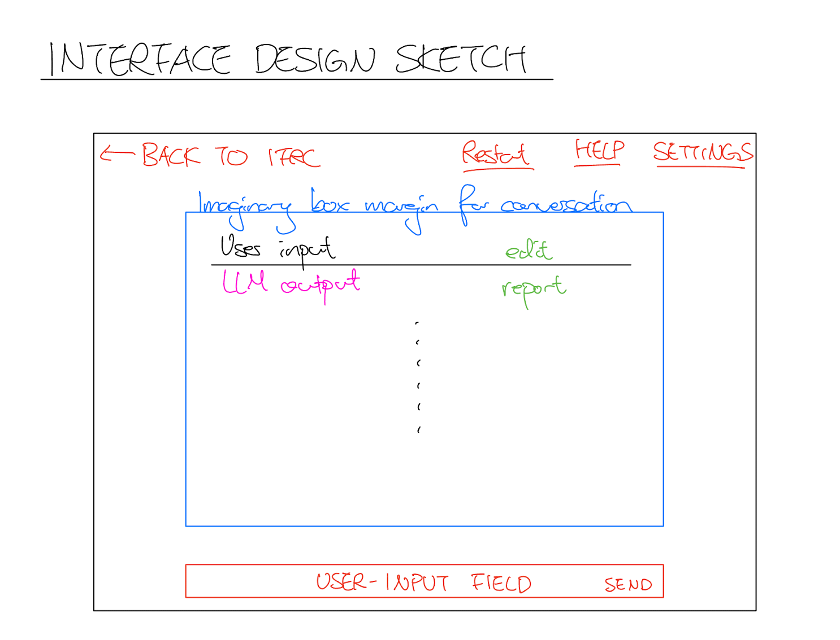
Figure 2.1a: An initial “day 1” sketch drawn by the team whilst brainstorming.
At first, the team considered a chatbot like approach: this reflected the group’s focus on a simple yet intuitive interface. This design leveraged the familiarity and consistency of an interactive question and response system, making the tool more accessible. Taking inspiration from various chatbot solutions, the following Figma was created.
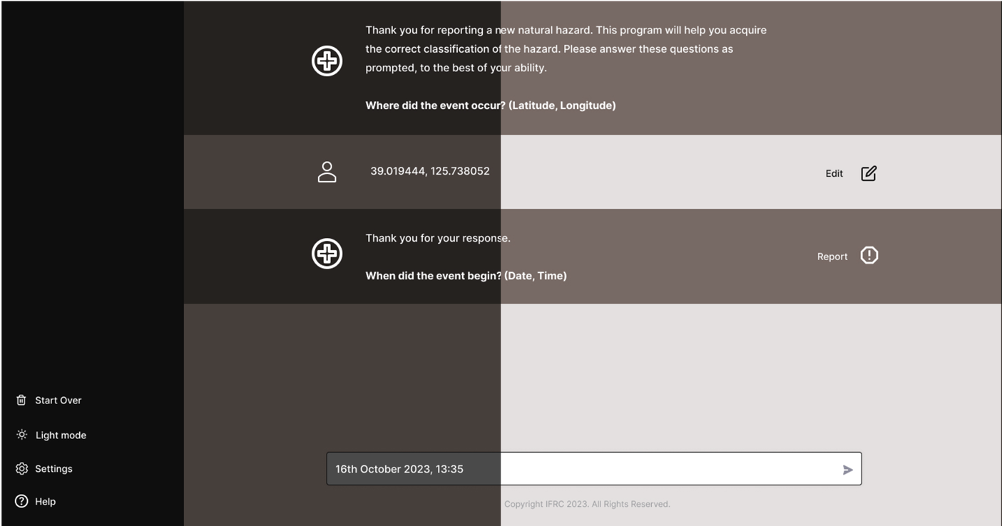
Figure 2.1b: A Figma mockup created to illustrate the sketch in Figure 2.1a in a more formal sense.
The tool would ask questions, and the user would type their responses into the text input field at the bottom. Through this, the user would not have to worry about conforming to certain input forms, as the LLM would handle the parsing of the answer instead.
2.2 Shift to Questionnaire-based approach
While the chatbot idea was well-received by the general test audience, the group members received feedback that “chatting” to a chatbot was unnecessarily tedious. The members realised that they could vastly improve the efficiency of the tool by converting the previous conversational approach into a list of simple questions. This eliminated the time the user spent forming a written response, and reduced the amount of text required to be generated.
The loss in efficiency and extra overhead rendered a chatbot style interface less appealing, despite its more impressive appearance. This is because it would require more calls to an external API, or need an in-house LLM customised to this particular task. Both options seemed economically and logistically nonviable. Thus, the group members decided to change their approach.
Taking into account all of the feedback given, the group members did another sketch. This considered costs and viability, as well as reducing time spent answering questions. The sketch is as follows:
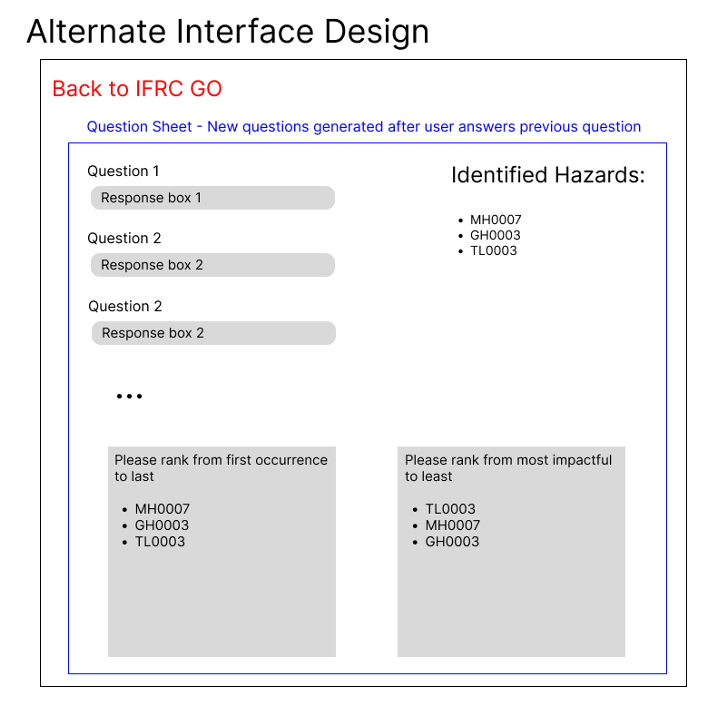
Figure 2.2a: A questionnaire-style approach that was considered as an alternative. The group ended up pivoting to this approach.
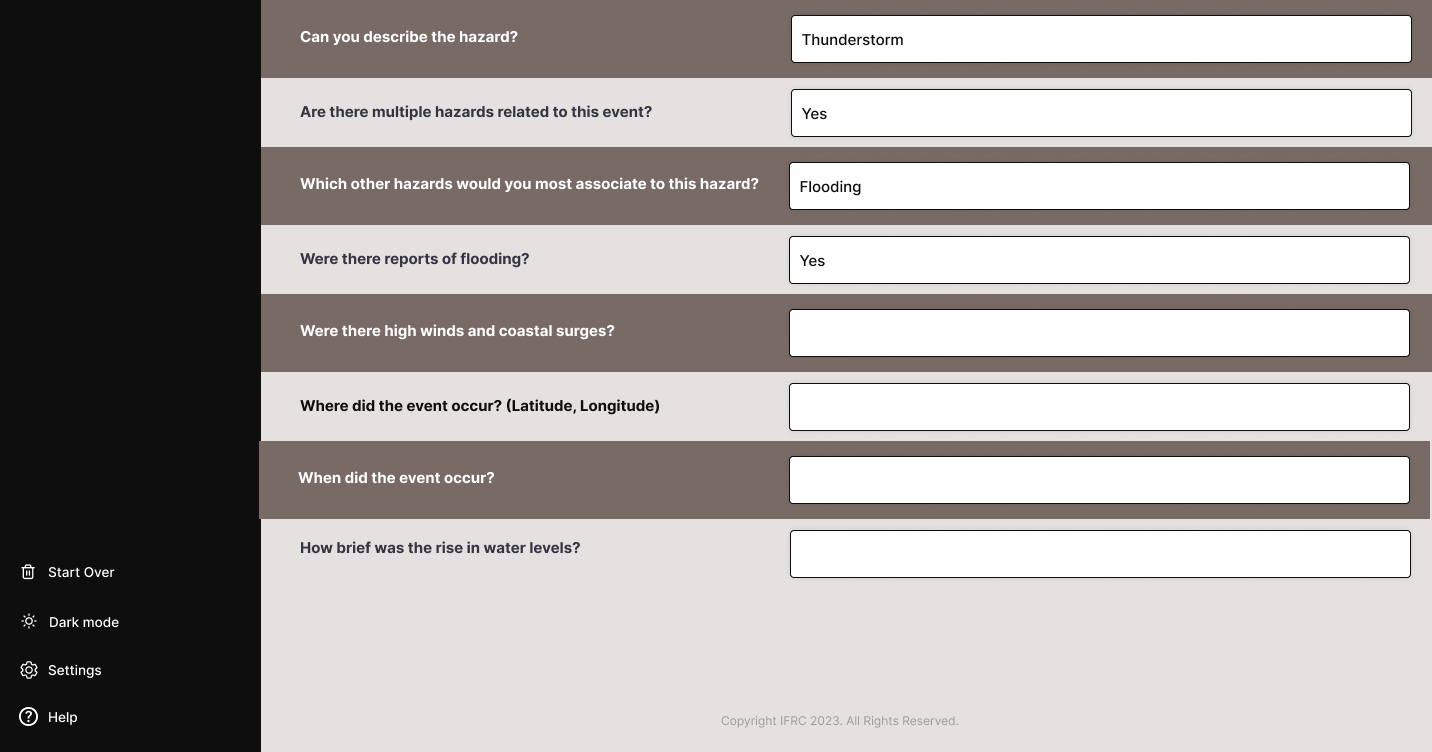
Figure 2.2b: The Figma created from the questionnaire-style approach.
This time, a questionnaire style interface was produced. A user would write the answers to a list of questions that were surfaced. By switching to such a format, the interaction became more structured and efficient, reducing the tedious nature of the tool. Limiting the responses also aligned with the project’s goal of streamlining the classification process. The complexity of the implementation was also minimised, as the need for both extensive natural language processing and external API calls was diminished. Furthermore, this version of the tool allowed for better control over the user experience whilst ensuring that the tool remained cost-effective and logistically viable. Overall, the questionnaire-style interface offered a more user-friendly and practical solution while still fulfilling the project's objectives.
This mockup version was sent to the target group users for further testing. Following the positive feedback, and with praise that the most pressing issues were solved, it was deemed to be the optimal version to be used in the final product.
2.3 Final Product
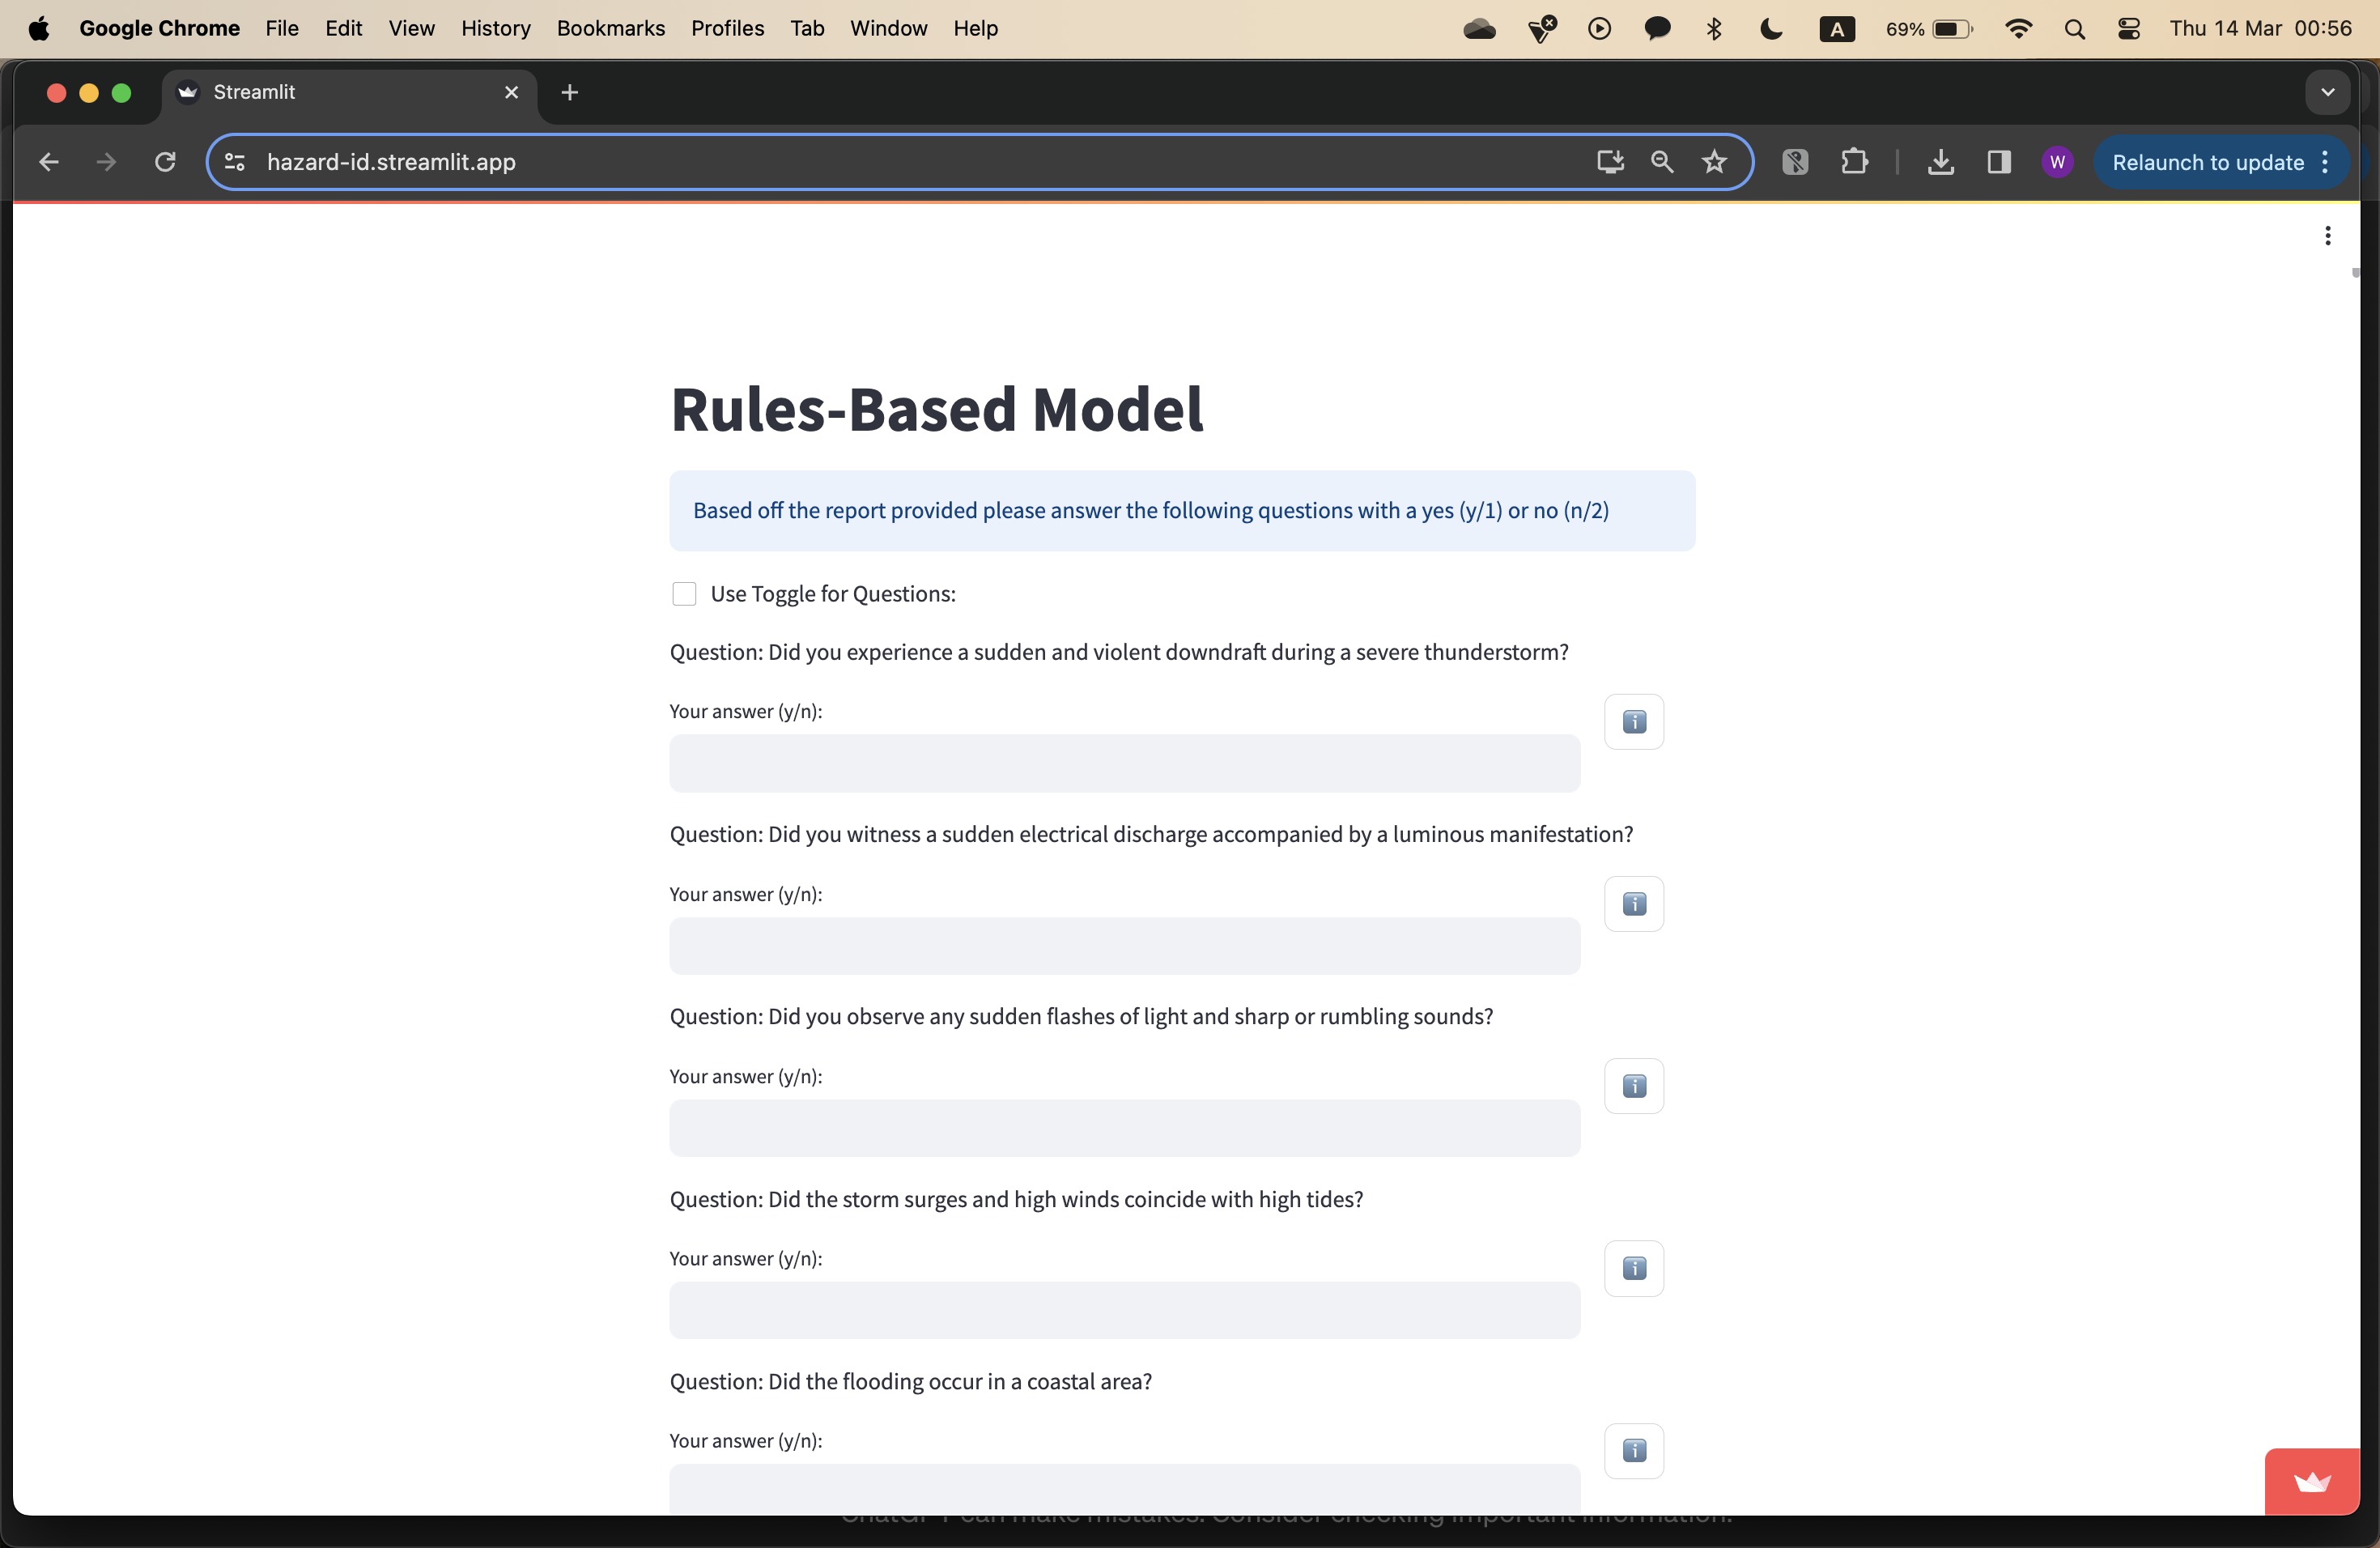
Figure 2.3a: The question answering page in the final product. Note the questionnaire style approach.
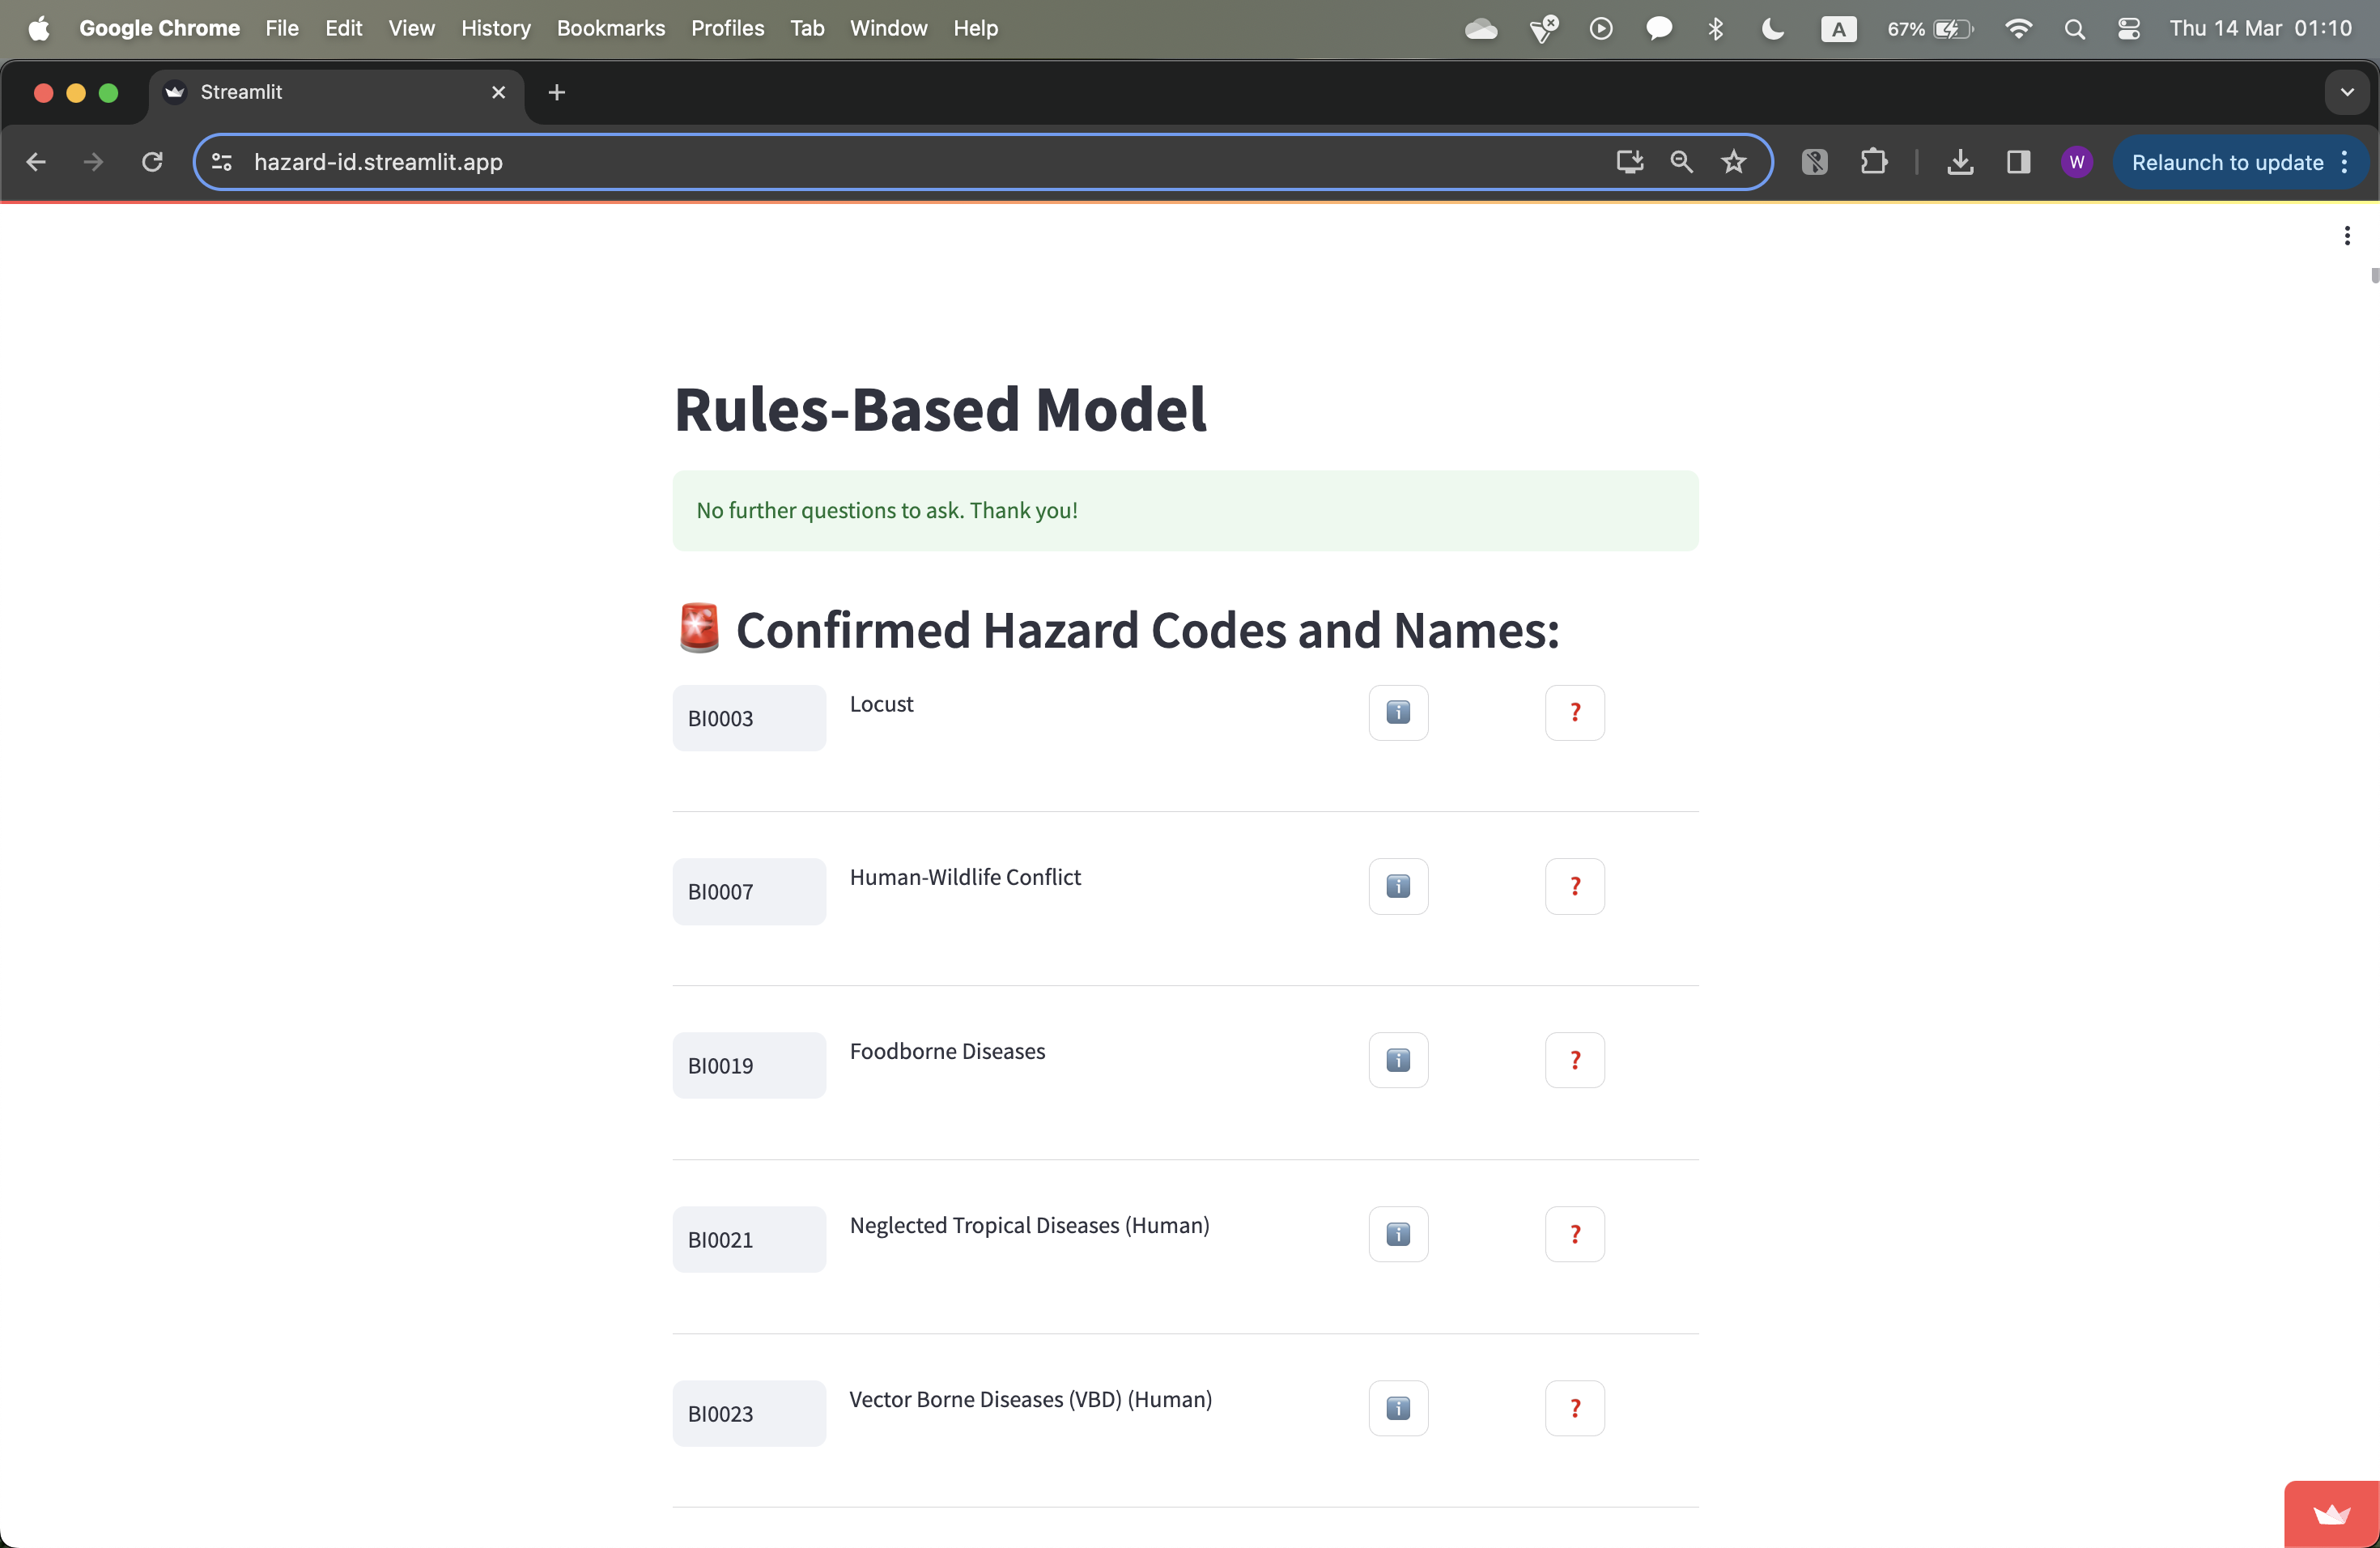
Figure 2.3b: The confirmed hazard codes page in the final product.
Finally, when the AssociationMatrix and ConfusionMatrix were in the works, it was determined that a user would realistically only have to answer either yes or no to a list of clarification questions. Thus, the question answering process was simplified even further to only accept yes or no; a toggle option was added for even more simplicity. These minor design changes ensured that the tagging process could be as fast as possible - with some practice, a user could blitz through the process with little effort. Overall, the group members had implemented an appropriate front-end, one that was efficient, easy to use, and simple, whilst also maintaining economic and logistical viability.